The pace in which new releases of the Elastic Stack are being rolled out is breathtaking. Just two weeks after Elastic Stack 6.7 was announced, versions 7.0 of Elasticsearch, Kibana, Logstash and Beats have been released full of new features and improvements.
The rapid pace of development attests to both the engineering feat of the folks at Elastic and the strength of this community. I find it hard to come up with an open source project developing at this pace.
If you’re an old ELK hand, though, you might not be as enthusiastic. As much as Elastic Stack 7 is jam packed with goodies, it also includes a long list of changes that will affect the way you currently index data in Elasticsearch, parse it with Logstash and analyze it in Kibana.
I’ll let you be the judge of the matter. Let’s get started.
Kibana
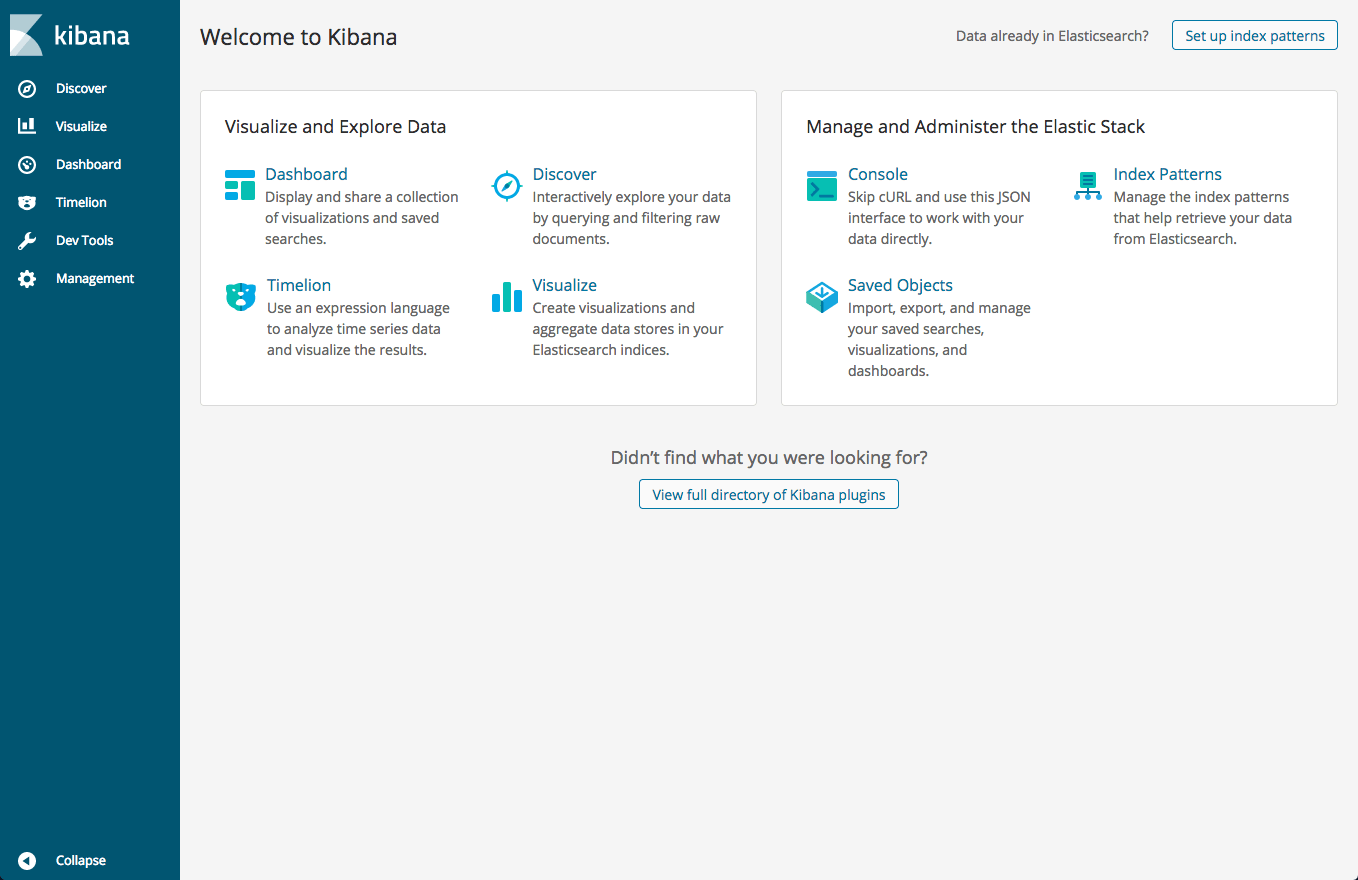
I’ve decided to break my habit of starting my review with Elasticsearch because I simply love the new look and feel that Kibana has been given in version 7. Remembering version 4.x, it’s hard to believe it’s the same product!


Going dark
Ever since version 5.x and the introduction of Timelion and Visual Builder, Kibana has made efforts to close the gap with Grafana — its open source twin for visualizing metrics. From a visual perspective at least, it seems Kibana has finally closed that gap, applying the dark theme across the board and not just in dashboards.

This is a space-level setting (Spaces were introduced in Kibana 6.5) that can be turned on easily. Users, however, will no longer be able to select between light and dark per dashboard. I think we can live with that limitation, don’t you?
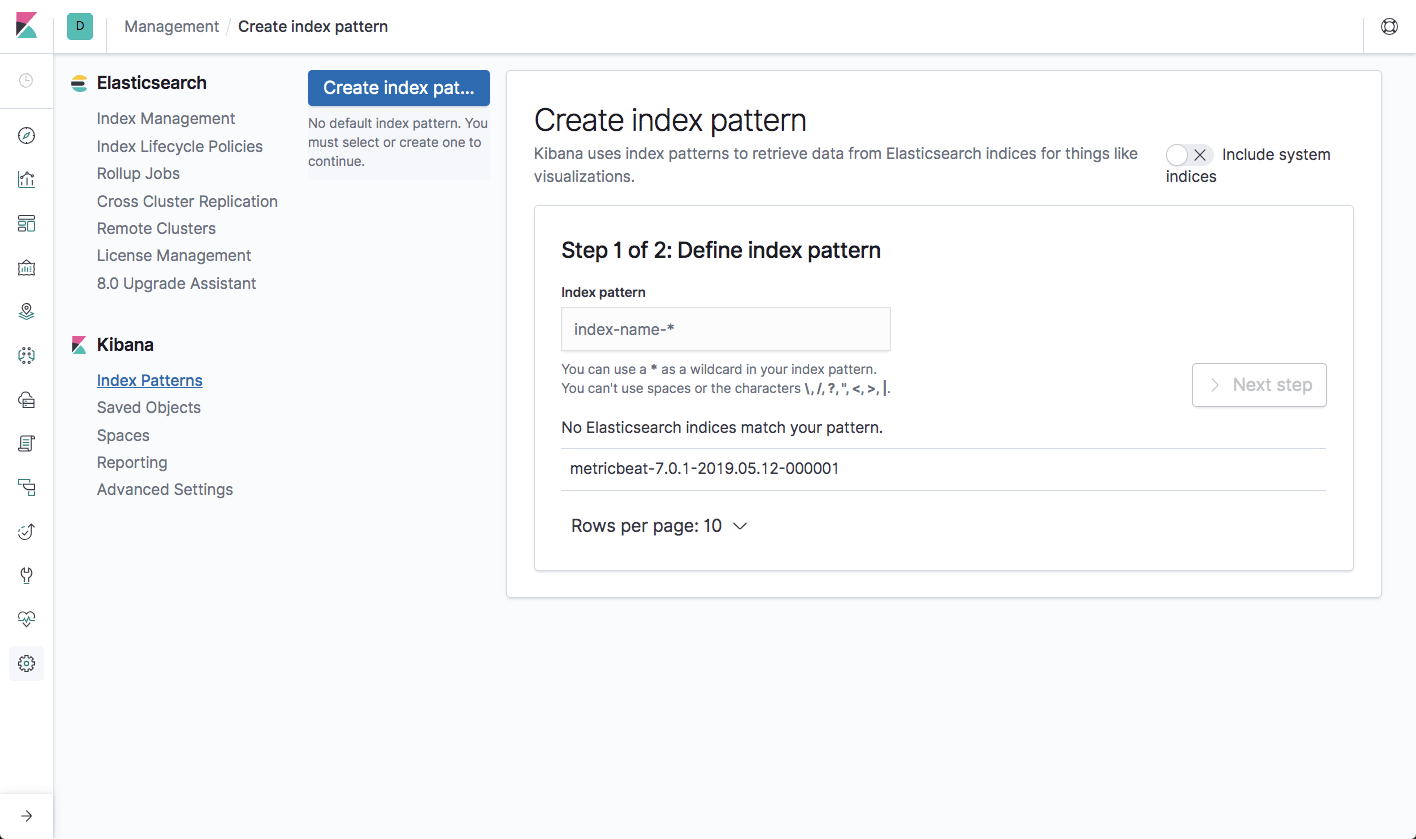
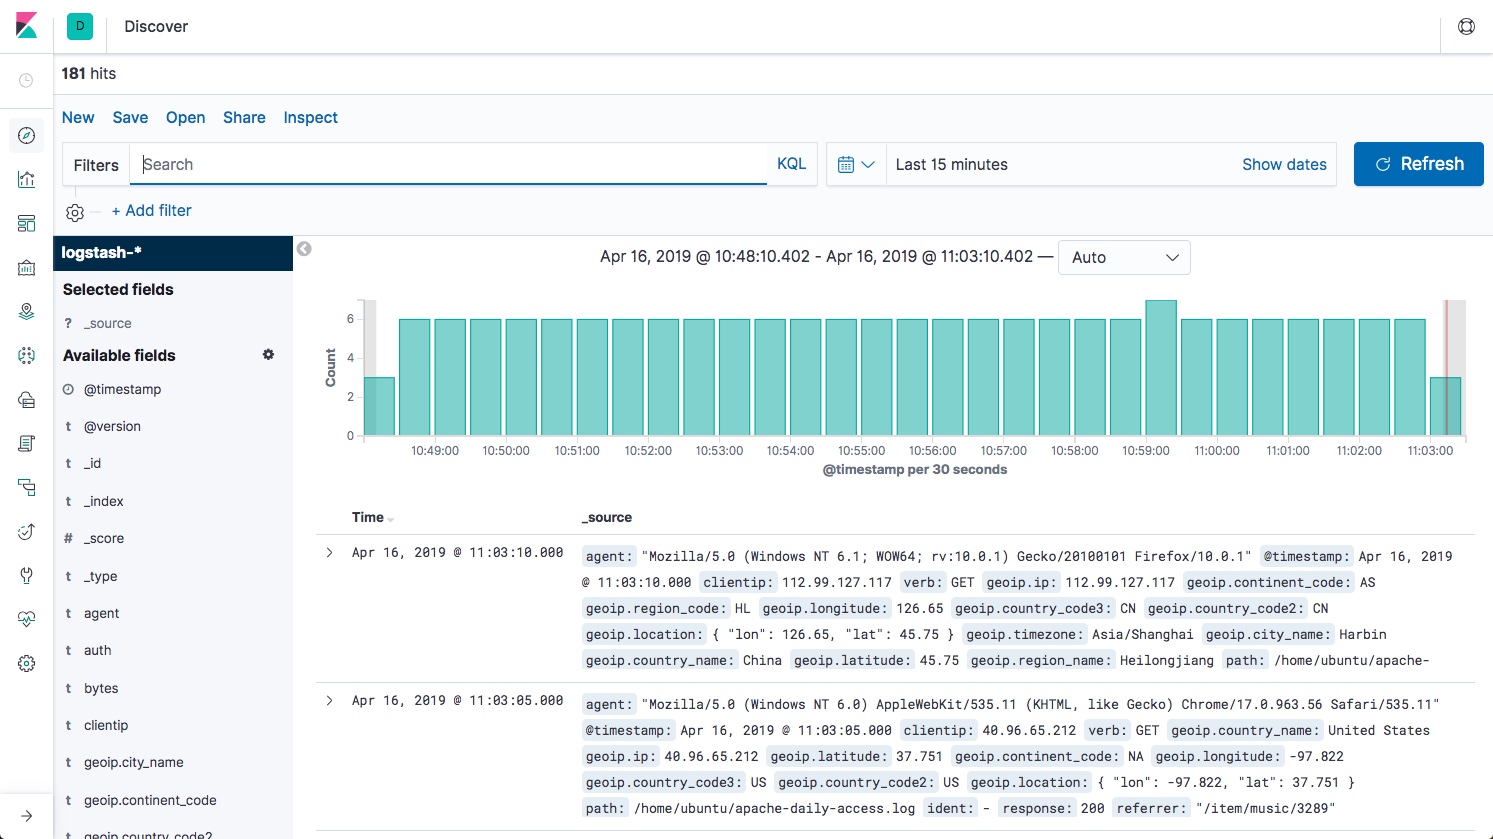
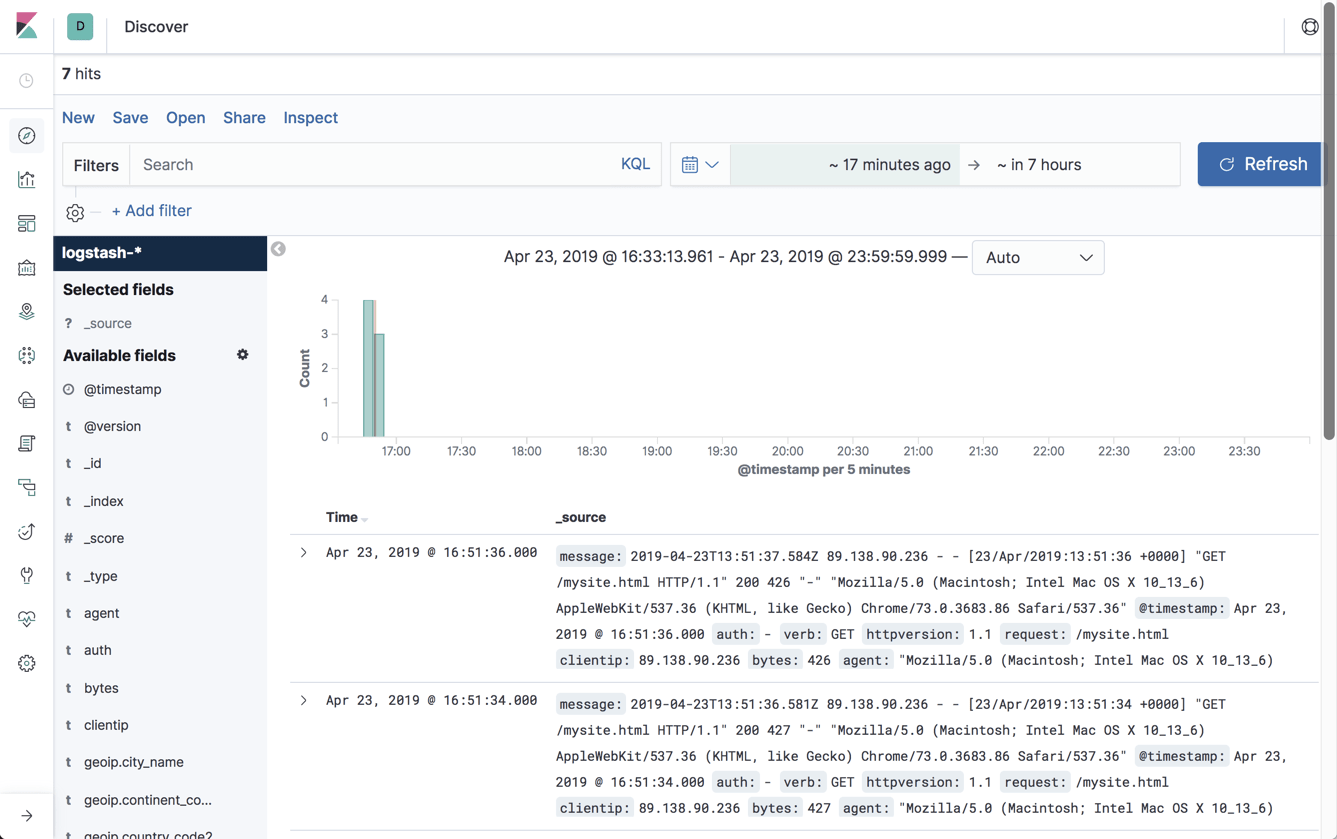
Improved querying and filtering
This might put off some Kibana power users out there but one of the main functions used in Kibana — querying, is totally different in version 7.
First and foremost, autocomplete and the new Kibana querying language (KQL), initially introduced in version 6.3, is now enabled by default (you can opt to use Lucene syntax if you like).
Kibana 7 also ships with a new filter bar that makes filtering logs a much easier experience. Your filters now have dropdown menus and the ability to be managed together in bulk.

Kibana also boasts a new date picker that is much easier to use since it doesn’t force a query reload or push the whole page down.

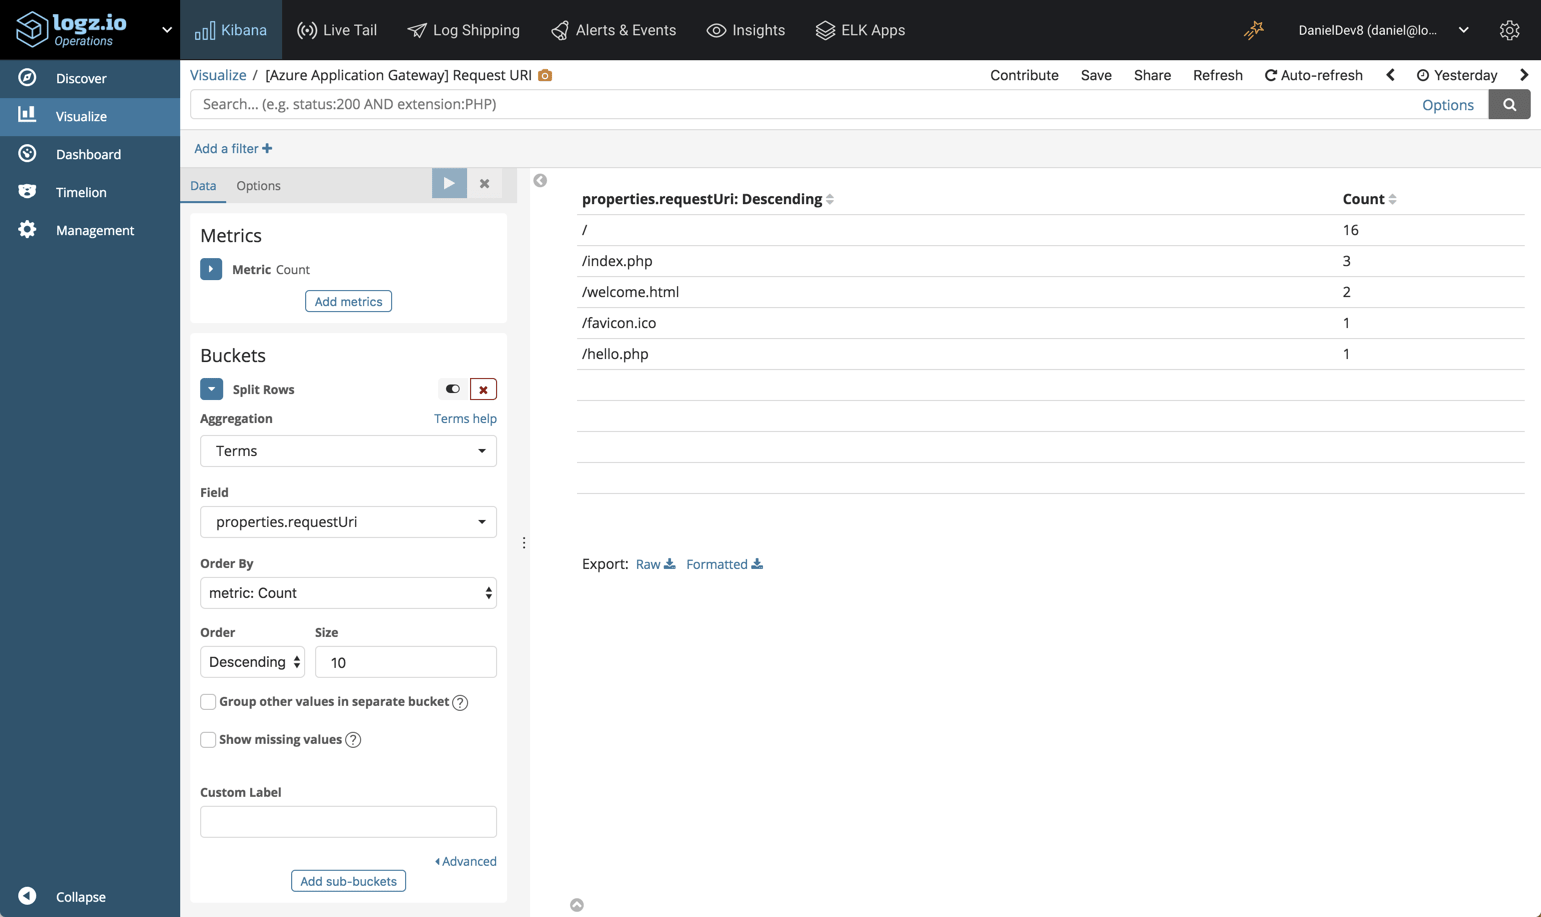
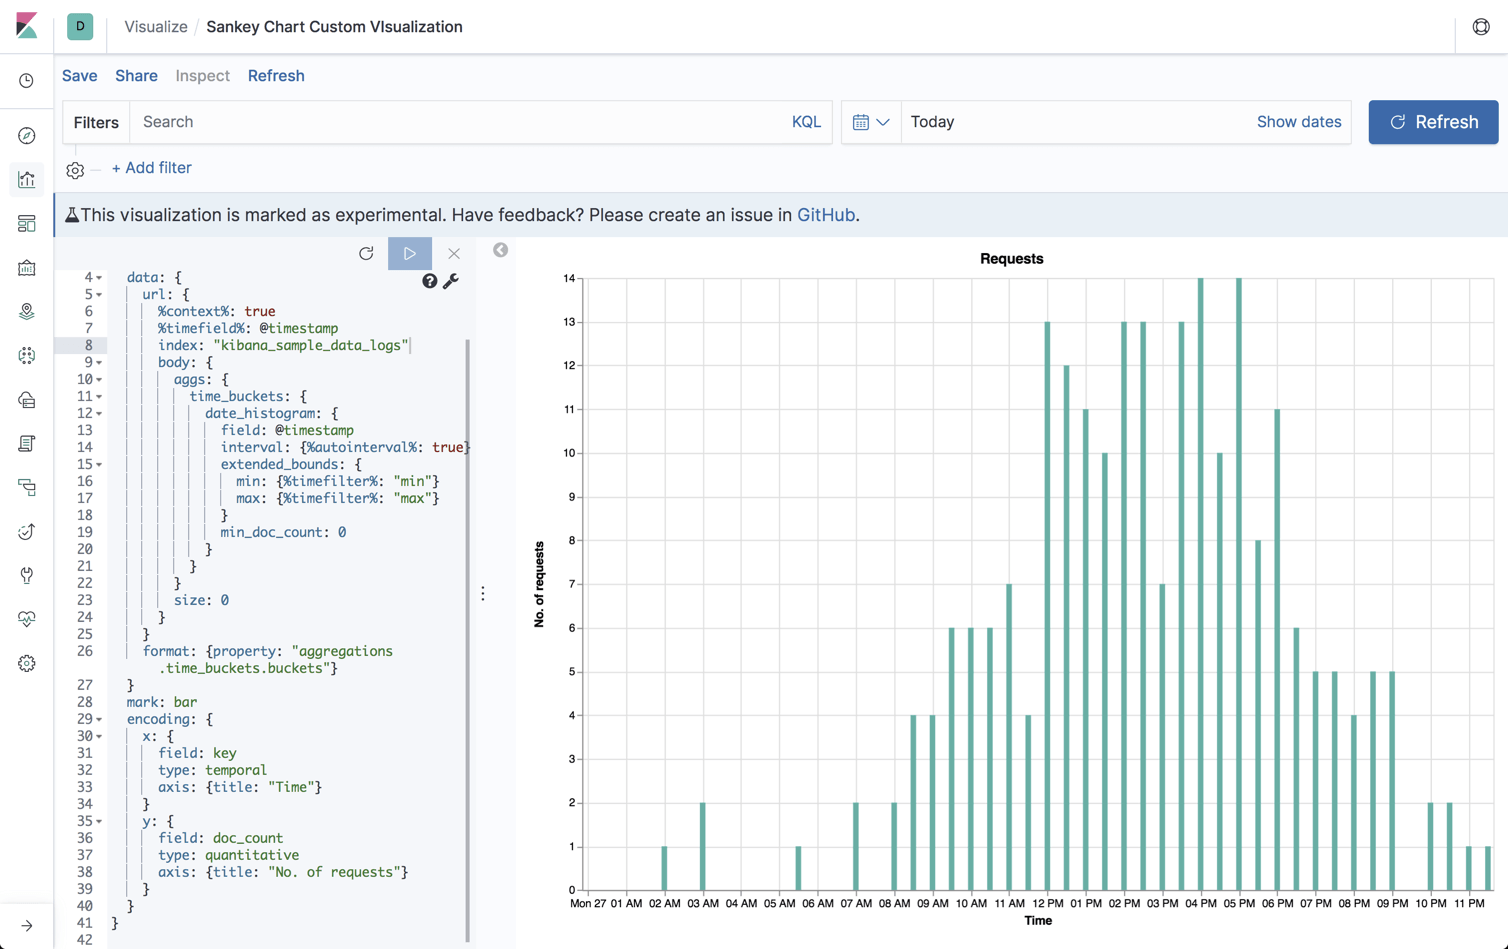
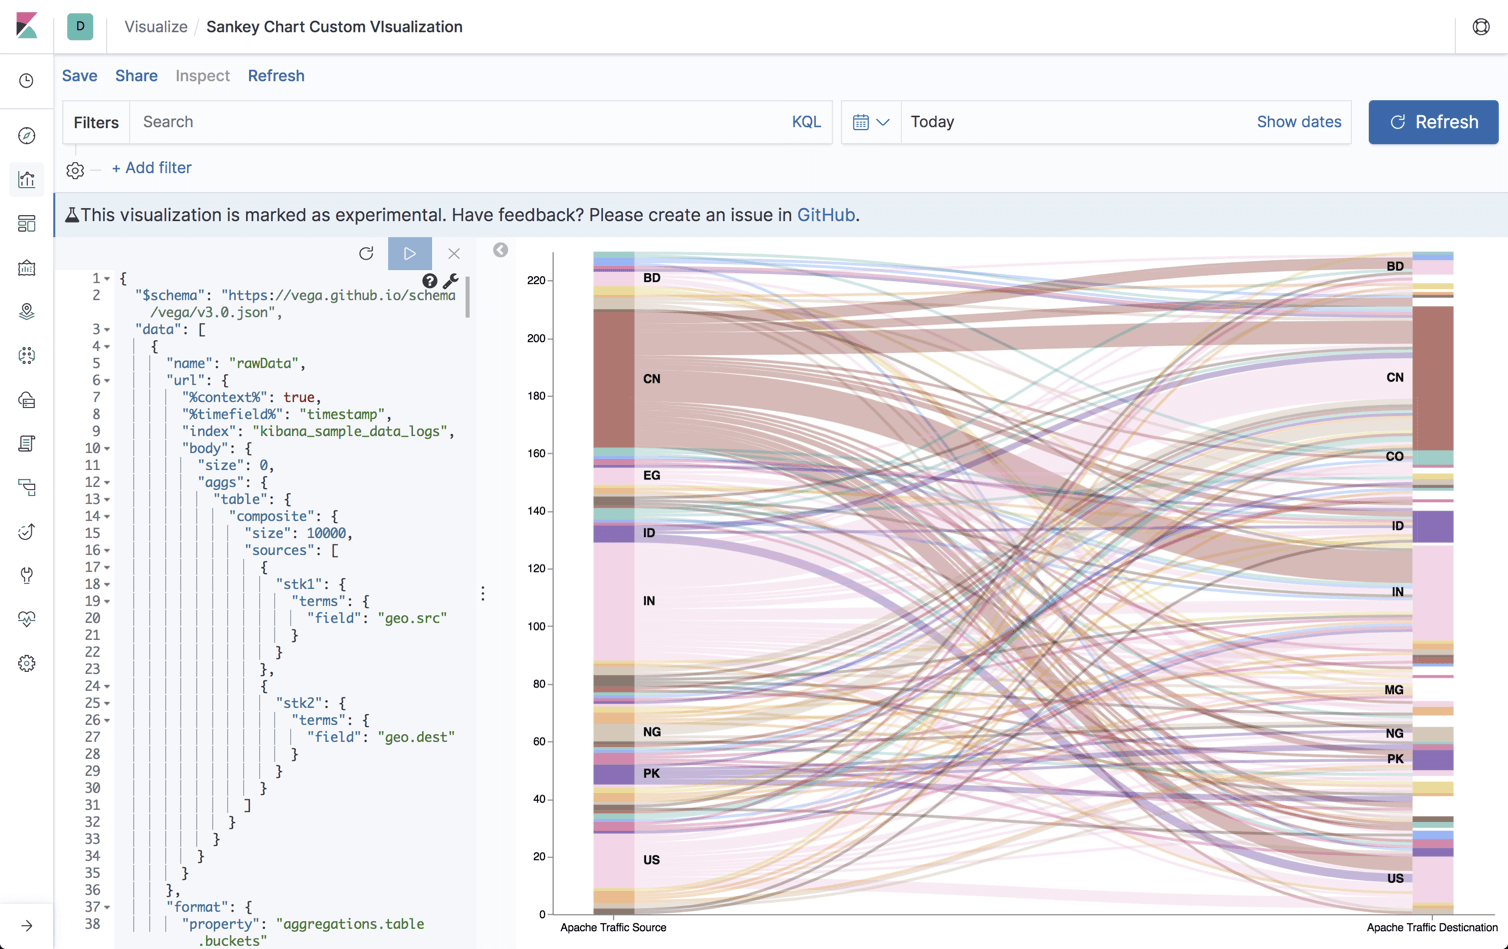
Canvas new features
For most Kibana users, the good old pie/line/bar charts in Kibana are rich enough to visualize their operational data. Others, perhaps using Kibana for different use cases, can use Canvas to build amazingly-rich dashboards. If you haven’t played around with Canvas before, I highly recommend you do so now.
In version 7, Canvas was upgraded with new keyboard shortcuts and an expandable expression editor.
Elasticsearch
This new version includes a long list of new features that promise to improve Elasticsearch performance and resiliency as well as it usability (JSON logging!). I won’t cover ALL these changes but will try and focus on the more important ones.
Typeless APIs
The removal of types has been a very gradual change, and in version 7.0 APIs that accept types have been deprecated to be replaced with new “typeless” APIs. Support for _default_ mapping has also been removed. Don’t worry about your existing 6.x indices, _default_ mapping will only be rejected on new indices.
Easier installation
Getting started with Elasticsearch is much faster in version 7 because Java is now built into the package. So you don’t have to set up one of the supported JDKs anymore, and if you do have your own JDK you will have to define its execution path in the JAVA_HOME environment variable before starting Elasticsearch.
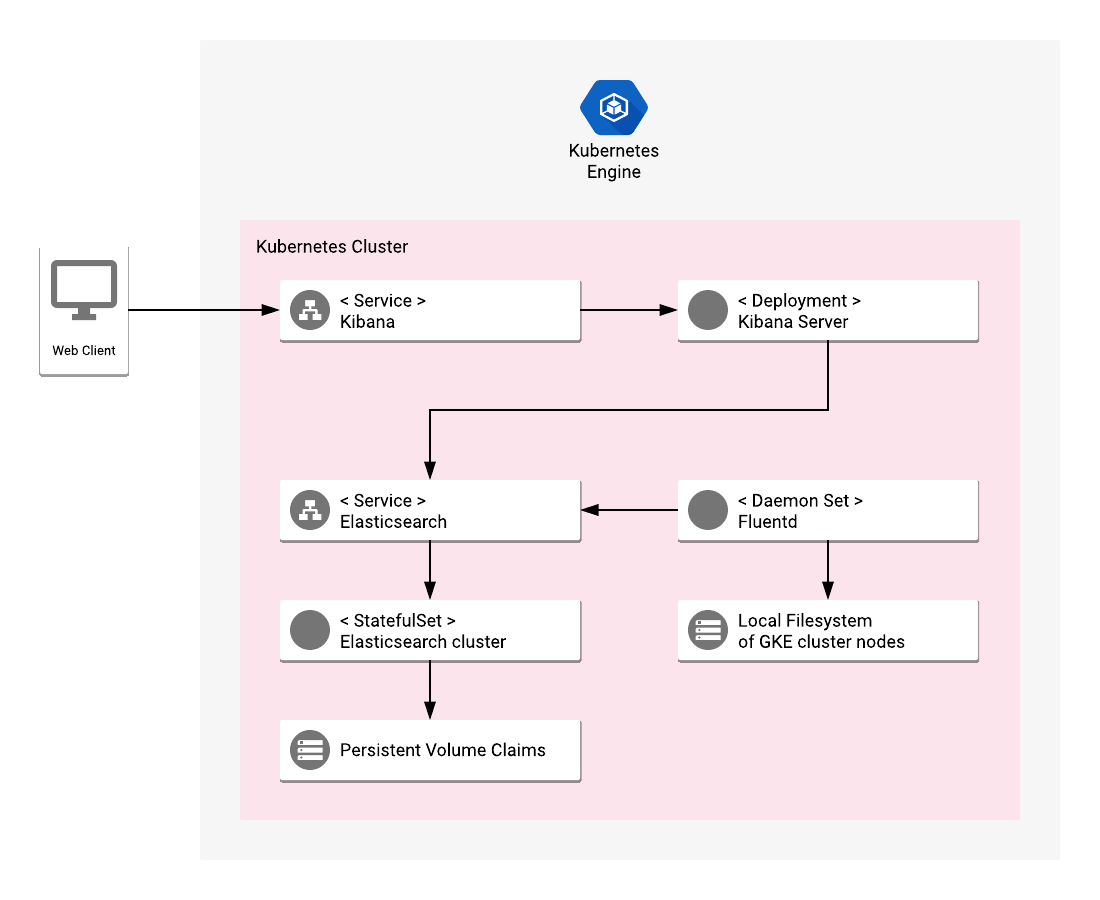
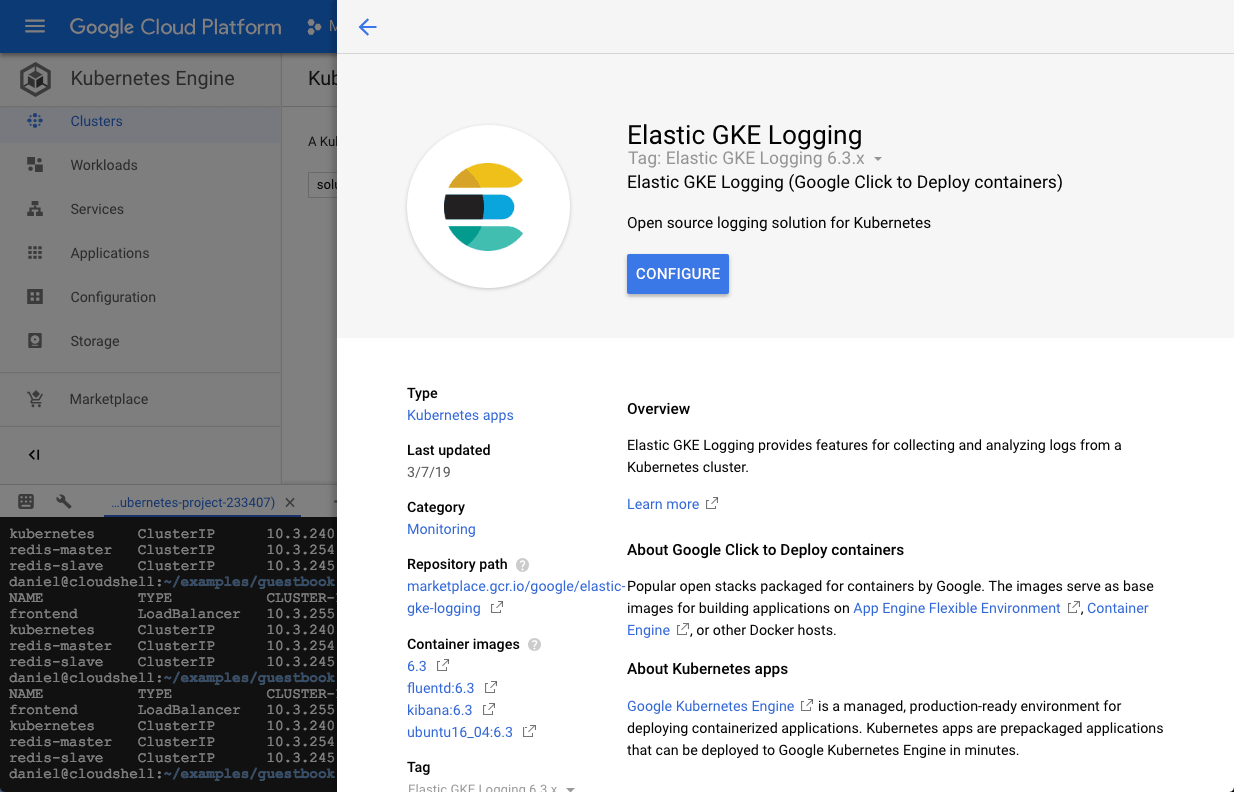
If you’re a Kubernetes user, there are some helm charts available for Elasticsearch and Kibana that will help you set up these two components of the stack in a Kubernetes-native manner. Keep in mind, though, that these charts are still in beta mode.
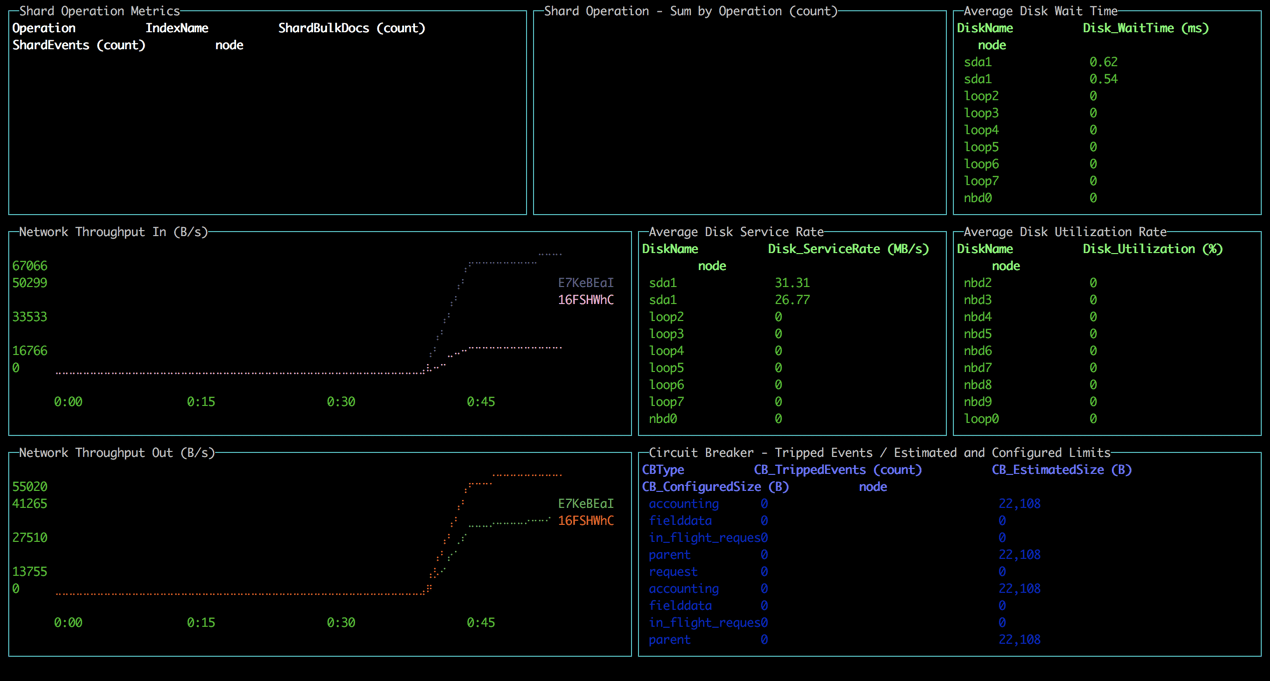
Real memory circuit breaker
Elasticsearch nodes faced with processing too many requests or “bad” requests can result in slow performance and in extreme scenarios, even bring down the node.
In previous versions of Elasticsearch, circuit breakers helped by calculating whether a given request can be served or not by the node. If the request could not be serviced, it was rejected or subsequently retried or executed on another node depending on the behavior users set up in their code.
Since it’s difficult, if not impossible, to accurately gauge exact memory usage, this mechanism proved to be insufficient. The new circuit breaker in Elasticsearch 7 remedies this by rejecting requests based on the actual memory being used by JVM and not estimations. Requests exceeding a configured memory usage threshold (default is 95% of the heap) are automatically rejected.
Improved search performance
Thanks to new algorithmic changes, Elasticsearch can now be configured to skip the ranking process for a configurable number of documents and display top results only. By skipping this process, Elasticsearch returns results much faster. The default setting is 10,000 but users can configure a different number that suits their search use case. As noted in Elastic’s release notes, this improvement does not apply for aggregation queries.
Other improvements for the search use case are a brand new Intervals query to mainly support legal and patents searches and a new script_score query for easier and simpler generation of ranking scores.
Cluster coordination
Elasticsearch 7 ships with a new cluster coordination layer, promising to make Elasticsearch more scalable and resilient and dramatically cutting the master election time from seconds to sub-seconds. Replacing the Zen Discovery system, the new coordination layer is easier to configure and makes scaling up and down safer.
In the fine print, you’ll find that when starting a new Elasticsearch cluster you will now need to define master-eligible nodes using the cluster.initial_master_nodes setting. Without this, Elasticsearch will fail to bootstrap (once the cluster has formed, this setting is no longer required and is ignored).
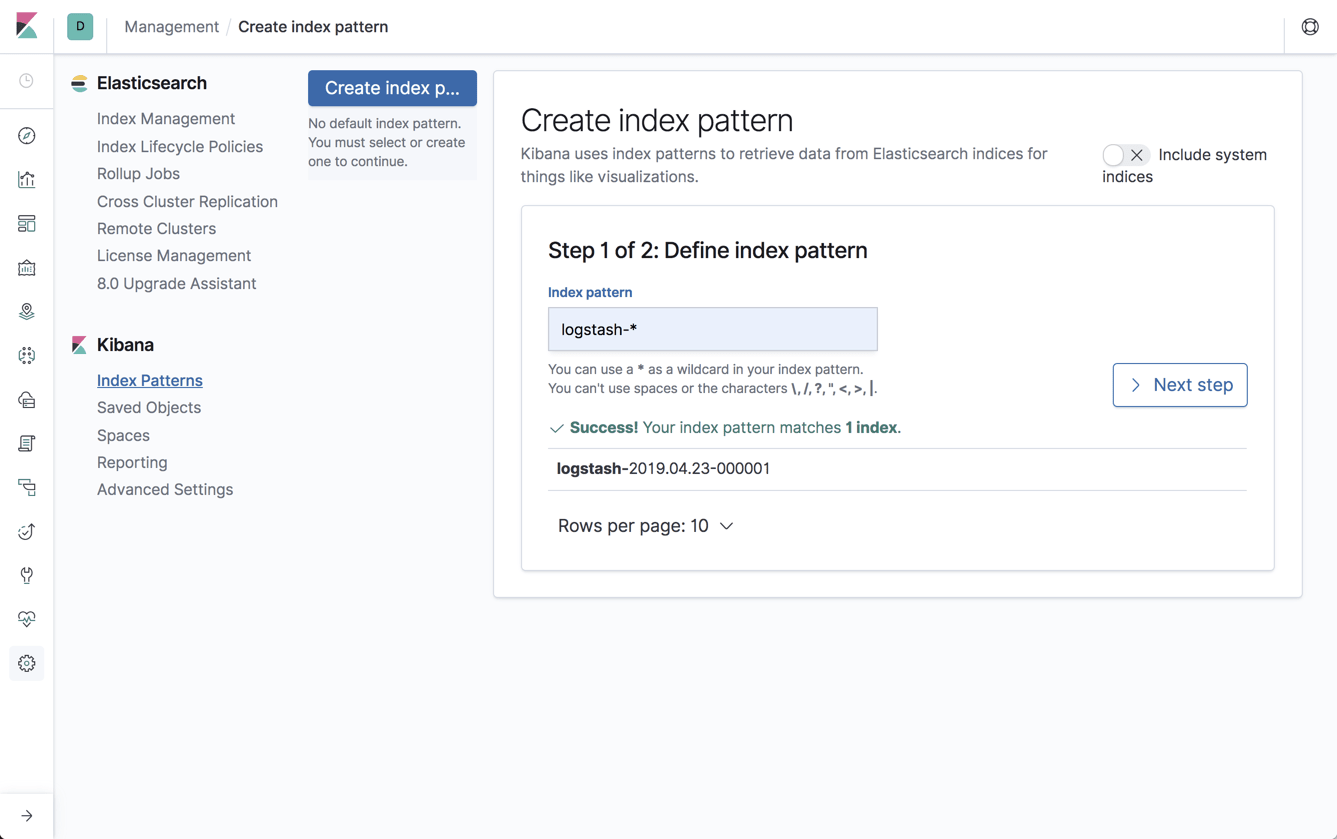
One shard policy
Elasticsearch default shard per index number is now 1 as opposed to the previous setting of 5. The idea behind this change is to help users avoid a situation in which they have too many shards per index, something that can affect Elasticsearch performance. Of course, you can set a different shard number if you like.
New Java REST client
One of the main reasons why Elasticsearch is so popular is its extensive API and the large number of clients that exist for different languages. Traditionally, Java developers used a TransportClient to connect to a cluster and execute APIs but this method suffered from security and dependency issues.
The Low Level REST Client released with version 5.x aimed to solve some of these issues but was just one step on the road to the newer High Level REST Client (HLRC) made available in version 7 which supports most of the Elasticsearch search, aggregation and administrative APIs.
Soft_delete enabled by default
Newly created Elasticsearch indices now have the soft_deletes setting enabled by default which makes them eligible for replication automatically.
To those new to Elasticsearch, version 6.5 introduced Cross Cluster Replication to enable easier replication of data across multiple Elasticsearch clusters. The soft_deletes setting helps maintain a history of document changes on the leader shards in an index to enable the replication of these changes to other clusters. The setting, required for Cross Cluster Replication, is now enabled by default for new indices.
Logstash
The big news for Logstash users in this release is the new and long-awaited Java execution engine, which is now enabled by default. Replacing the old Ruby execution engine, this puppy promises better performance, reduced memory usage, lower configuration startup and reload times, and overall — an entirely faster experience.
It will be interesting to see some proper benchmarking stats but this holds great promise for large Logstash-based ingestion pipelines. Quoting from Elastic’s release notes: “Some execution optimizations can be applied at this stage and the startup and reload times for some large configurations have been reduced by as much as 20x.” Run, Logstash, run!
There is quite a long list of breaking changes made to Logstash configuration options that users would do well to get acquainted with before upgrading. Take a look here.
Beats
Complying with ECS
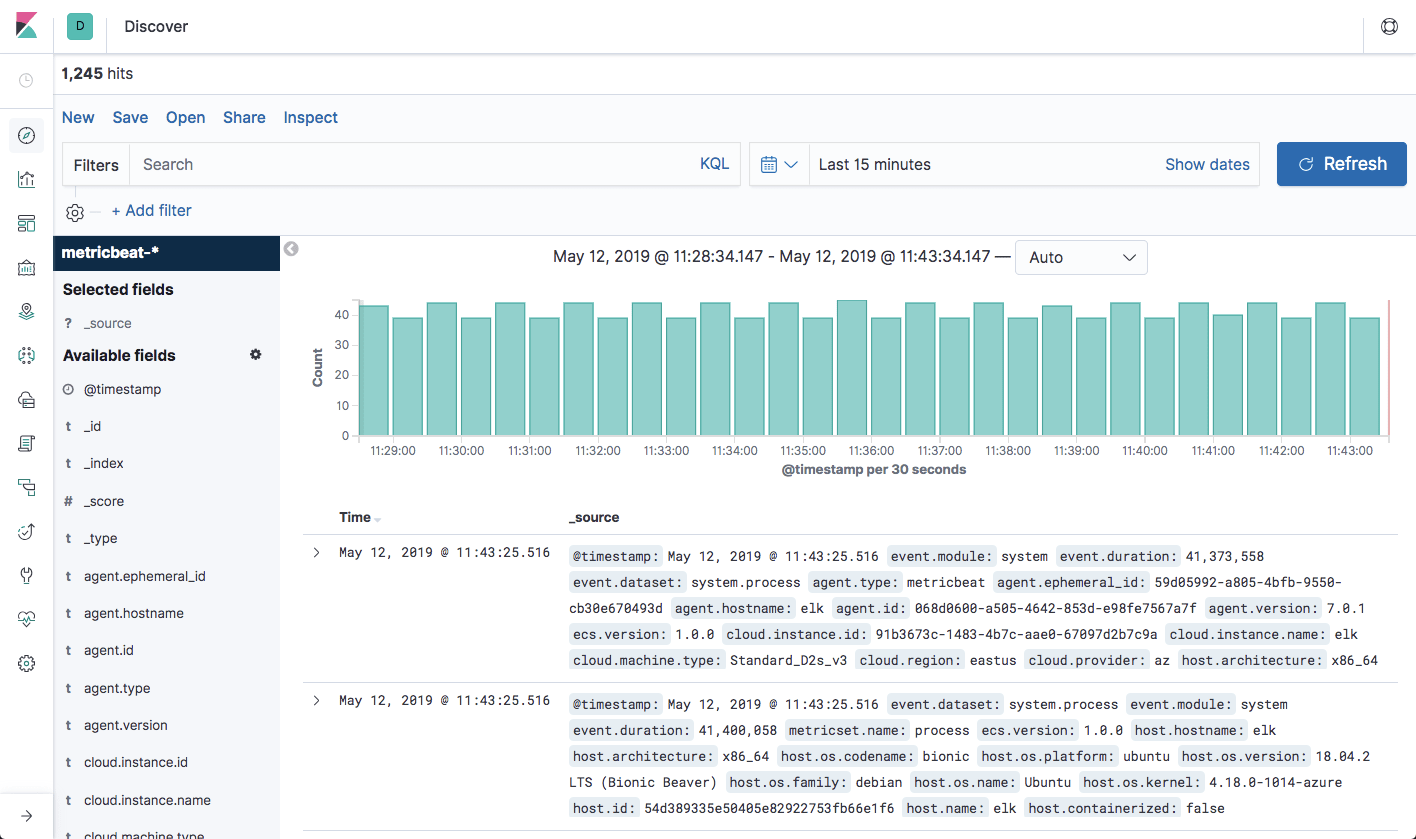
The Elastic Common Schema introduced a few months ago aims at making it easier for users to correlate between data sources by sticking to a uniform field format. Sure, you can parse you data but what if all the fields are formatted the same way from the start?
Starting from version 7, all the beats will now conform to one standard format. This is good news but it also means that for those of us upgrading to the new version we will have to adjust our Kibana objects since field names have changed.
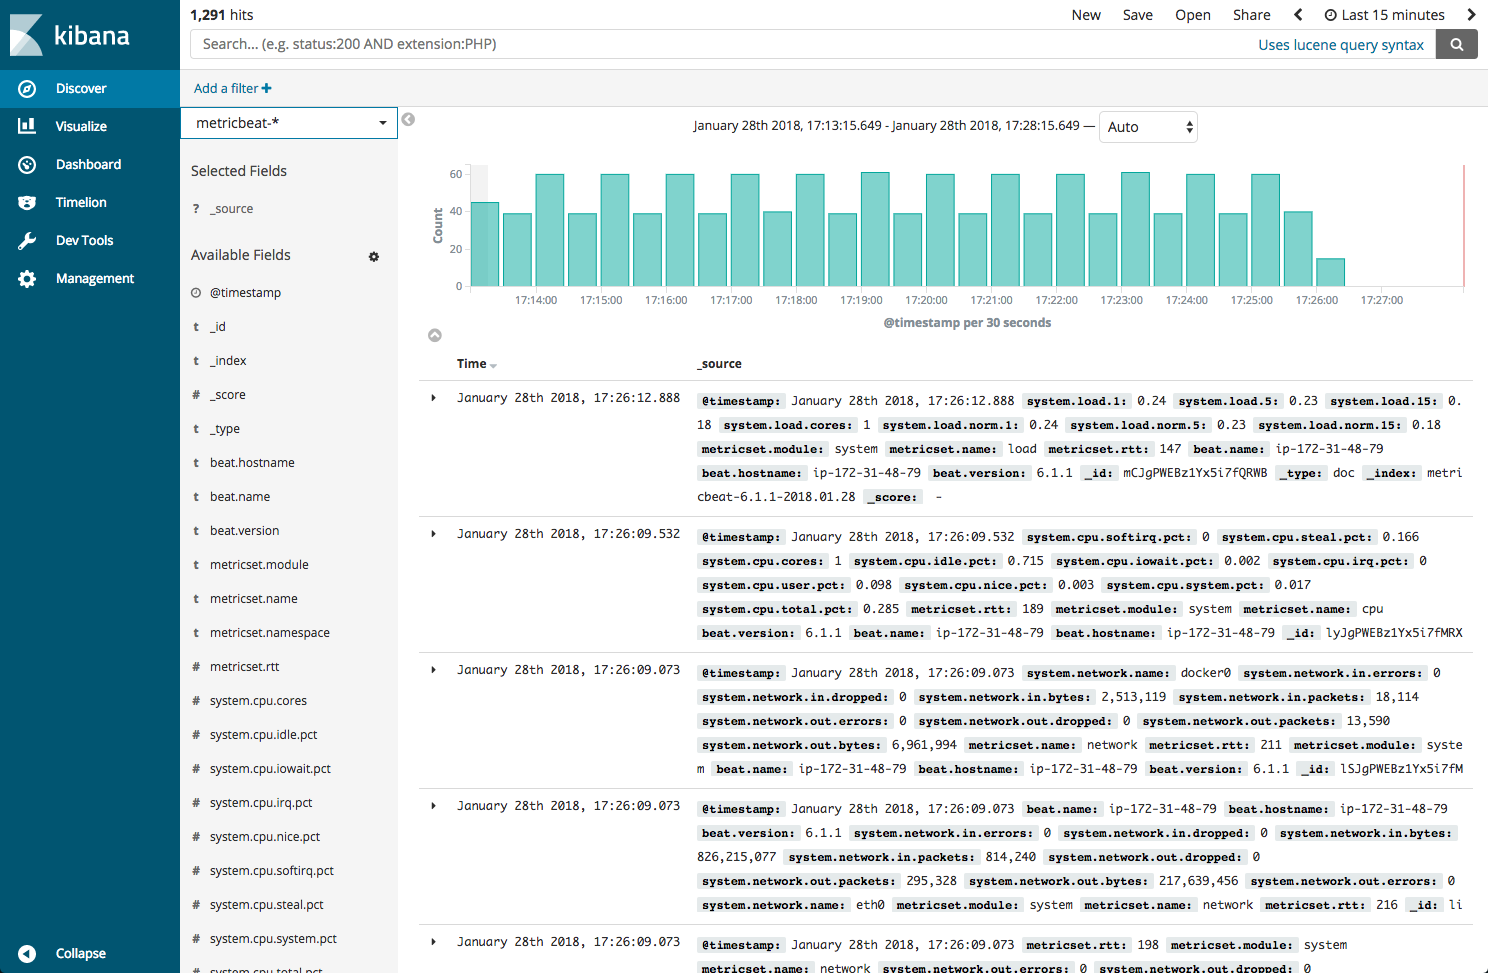
New AWS Module in Metricbeat
If you’re using Metricbeat to monitor your EC2 instances, you’ll be glad to learn that version 7 includes a new AWS module that negates the requirement of installing Metricbeat per host. Instead, you can configure one Metricbeat instance to pull metrics from CloudWatch into Elasticsearch. You will need to set IAM policies and include your AWS credentials in the new module configuration.
The only metricset supported right now is EC2 but I’m pretty sure we will see additional AWS metricsets soon. Anyone say Lambda?
New security modules in Filebeat
Filebeat supports new security use cases with new modules for Zeek (aka. Bro) – an open source network security monitoring tool, and Santa – a whitelisting/blacklisting system for macOS.
New system module in Auditbeat
Auditbeat collects and reports on user activity and processes in your system. The new system module added in version 7 collects host-specific data, such as information on running processes and the operating system.
Endnotes
The stack has received some major performance boosts on the backend as well as a facelift to the UI, so I would understand if our readers felt a sudden eagerness to upgrade. For me, believe it or not, the new Logstash execution is the main reason causing me to itch.
It will be interesting to see some real benchmarking stats coming out from the community testing these changes. We will be researching the new version to prepare for our eventual upgrade.
As usual, allow me to preach caution. Most ELK users will avoid upgrading to any version with an “0” in it simply because they’d rather wait to see if there are any issues with the new version that bring on fixes and it’s usually a best practice to wait a month or two before upgrading.