Quantcast
Channel: Daniel Berman is Product Evangelist at Logz.io
Viewing all 198 articles
Browse latest View live

SIEM vs. Security Analytics

$
0
0

SIEM has been with us for almost two decades now and is seen as a proven approach to dealing with potential threats as well as actual attacks on business critical systems. But today, it is becoming clear that changes in IT infrastructure and deployment practices are giving rise to new challenges that cannot be met by existing SIEM platforms.

In this article, we take a look at legacy SIEM systems and examine their limitations. Next, we talk about Security Analytics-based, next-generation SIEM products and what they offer. We conclude the article by examining the benefits of replacing older legacy systems with next-generation SIEM platforms.

Legacy SIEM and Its Limitations

Security information and event management (SIEM) systems collect log data generated by monitored devices (computers, network equipment, storage, firewalls, etc.) to both identify specific security-related events that occur on individual machines and aggregate this information to see what is happening across an entire system. The purpose of these activities is to identify any deviations from expected behavior and to be able to formulate and implement the appropriate response. To this end, SIEM products offer a range of functionalities that include log collection, event detection, system monitoring, behavior analysis, compliance management, threat hunting, and centralized reporting services.

Costs

In recent years, the limitations of the current generation of SIEM products have become increasingly apparent. For a start, current SIEM solutions may not seem very expensive on the surface. But when you take into account the costs of the related hardware, software, and personnel required, you can end up paying between $100,000 to $500,000 per annum, or even higher.

One hidden cost of deploying SIEM is time. After all, if you are going to the trouble of building a system that is designed to help protect your organization’s equipment and data, you want to get it right. Moreover, in order to fulfill its intended purpose, you must integrate your SIEM system with your current infrastructure, and this definitely takes time. Therefore, it is no surprise that even the simplest SIEM deployment can take a minimum of six months, and more complex systems will take much longer.

Why & When Were They Built?

Legacy SIEM systems were designed to combat a large range of potential threats. The systems were implemented using a one-size fits all approach that created tightly coupled, monolithic applications that are hard to update. These systems also used available data storage technologies to persist system logs and related information, such as relational databases or proprietary file formats. Unfortunately, such storage technologies favor a highly structured approach to data management that is highly inflexible and very difficult to update and/or change.

In addition, these products were designed well before the rise of large cloud providers and solid-state drive technologies. As a result, they utilized an organization’s on-premise infrastructure and relied on existing spinning (hard) disk technologies. This led to systems that were unable to store the vast quantities of collected log data, let alone provide the performance required to analyze it. Due to these design limitations, legacy SIEM systems are simply not built to handle modern CI/CD lifecycles—based on frequent build and deployment cycles—and cannot handle the vast amounts of data generated by these methods.

Deeper Issues of Legacy SIEM

From what we have described, you might be tempted to think that the problems of legacy SIEM can simply be fixed via buying new hardware. But there are a number of deeper issues with SIEM software. Many SIEM systems identify deviant behavior using a rules-based approach. Each time the system detects a threat, it tries to match it against a collection of defined behavior patterns based on previously detected incidents. But a major problem for this rules-based approach to SIEM is that it that can only handle problems that have been caught and cataloged. It is unable to provide answers to any new attacks and exploits. This approach also works better at dealing with local incidents rather than system-wide attacks.

Some SIEM systems overcome these issues by using a statistical approach that correlates logged events across an entire system and determines relationships between them that could indicate an attack. The downside of this approach is that it can generate a high number of false positive results. Unfortunately, at the end of the day, both approaches were designed to handle only external threats. This means that no matter which method you use, neither offers a solution for problems already behind the corporate firewall and thus cannot protect against them.

Security Analytics and Next-Generation SIEM

One of the key problems with current SIEM approaches is that it forces you to take a reactive and passive approach to security. In contrast, Security Analytics takes a long-term approach to system and data security. To understand the difference between these two, let’s take a look at what is meant by Security Analytics and how it differs from SIEM.

What Is Security Analytics

Security Analytics focuses on the analysis of data to produce proactive security measures. This results in a flexible approach that can be constantly improved to handle new threats and vectors. As its name suggests, Security Analytics emphasizes the analysis of security data instead of managing it. In order to provide effective analysis, Security Analytics tools collect data from numerous sources, including external and internal network traffic, access and identity management systems, connected devices, and business software. This data is then combined with external security threat intelligence and existing collections of reported security incidents.

The collected data is processed and analyzed using traditional statistical analysis and augmented with artificial intelligence and machine learning. As a result, you can gauge potential threats based on what is happening both inside your system and in the world outside your corporate network. Not only can this approach handle known and understood threats, it can also deal with “we don’t know what we don’t know” scenarios.

Cloud-Based Infrastructure

Unlike legacy SIEM, Security Analytics can take full advantage of cloud-based infrastructure. First of all, cloud storage providers can provide almost unlimited, indefinite data storage that can scale according to your needs. This enables you to keep potentially useful data without being limited by corporate data storage and retention policies.

Not only are next-generation systems better at collecting and storing data, they are better at handling modern DevOps practices and CI/CD systems. These systems build and deploy software at increasing speed and, in the process, generate more data than traditional, on-premise SIEM solutions can handle. Another key advantage of cloud-based systems is that they drastically reduce the time required to deploy and implement. Using a cloud-based SIEM platform, you can deploy an SIEM solution in hours, instead of months or even years.

But Do You Get Better Security?

While lower costs and deployment times makes Security Analytics tools an attractive proposition, what really matters is whether they overcome the limitations of their predecessors and offer better system security.

As we previously noted, legacy SIEM systems were monolithic applications designed to handle external threats to on-premises IT infrastructures. Modern security systems are built around highly distributed systems that include cloud, hybrid cloud, and local elements. Unlike the older platforms, they use an analytical approach that is not limited to a finite range of potential security scenarios and well-known threats. Instead, they use existing security data and pre-packaged threat analysis that can identify new problems as soon as they appear.

In addition, this new approach augments existing statistical-based models with the latest advances in machine intelligence and deep learning. Because of this, the new SIEM systems based on Security Analytics can not only identify known threats, they can learn to identify undocumented problems by analyzing massive amounts of data to uncover hidden relationships, anomalies, trends, and fraudulent behavioral patterns.

Conclusion: The Only Way Is Up

Legacy SIEM systems have been around for a long time. And until recently, they’ve been doing a great job of protecting our IT infrastructure. Still, no matter how well legacy SIEM products have performed in the past, they are beginning to show their age.

Security Analytics is designed to proactively protect your organization’s vital data and infrastructure. These systems are not only less costly and resource hungry than the older systems they replace. They are also a better fit for modern cloud and hybrid cloud-based infrastructures and work with newer DevOps practices. Ultimately, Security Analytics products offer better protection, greater scalability, and reduced costs. In this light, you should be asking yourself if it’s time to migrate to a next-generation solution. Given the evidence, the answer to this question is a resounding “Yes.” And you should do so as soon as possible.
Looking for a secure and scalable ELK Solution? Check out Logz.io Security Analytics!

Monitoring Microsoft Azure with Logz.io

$
0
0

Microsoft Azure has long proven it’s a force to consider in the world of cloud computing. Over the past year, Azure has made some significant steps in bridging the gap with AWS by offering new services and capabilities as well as competitive pricing. 

A growing number of our users are Azure fans and so we’re happy to introduce a new Logz.io integration for Azure as well as premade dashboards for monitoring different Azure resources!

The integration is based on a ready-made Azure deployment template that sets up all the necessary building blocks of the pipeline — an Events Hub namespace, two Events Hubs, an Azure Function app, two Azure Functions, two Azure Storage Blobs, and all the correct permissions and connections required.  

How does it work?

The Azure functions are triggered by data streamed to an Event Hub from your Azure resources. The functions process the data, whether logs or metrics, and forward it to a Logz.io account for aggregation and analysis. For backups and archiving, you can use the Azure Storage Blob created as part of the deployment.

Azure resources

In this article, I’ll take you through the steps for deploying this template and using it to integrate your Azure environment with Logz.io.

Deploying the template

Our first step is to deploy the Logz.io Azure integration template.

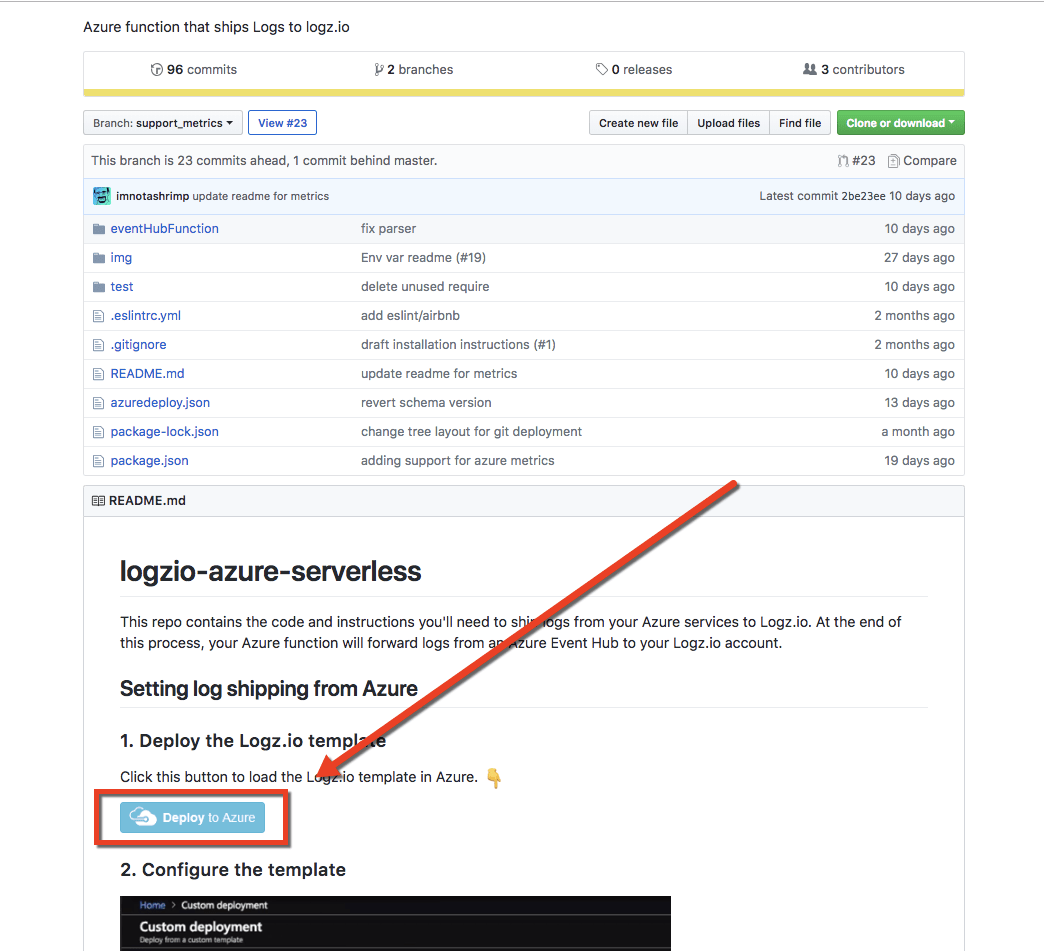
You could upload the template manually by copying the template code and uploading it to the Azure portal but the easiest way is to use the Deploy to Azure button displayed in the first step of the repo’s readme:

deploy template

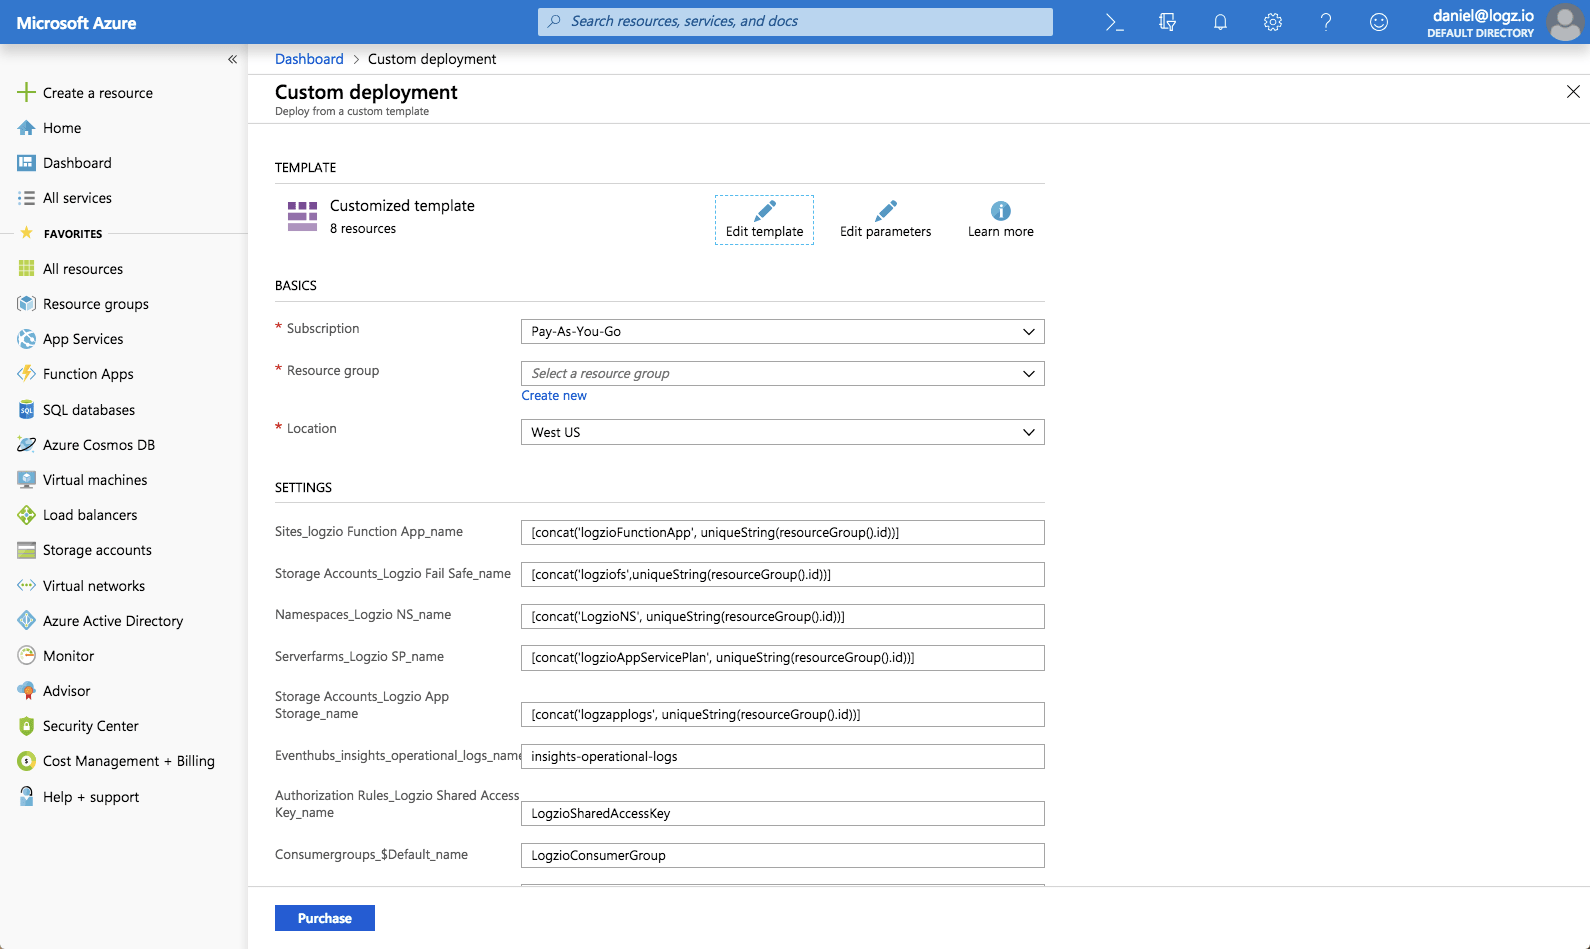
Once clicked, the Custom Deployment page in the Azure portal will be displayed with a list of pre-filled fields.

custom deployment

You can leave most of the fields as-is but be sure to enter the following settings:

  • Resource group: Either select an existing group or create a new one.
  • Logzio Logs Host: Enter the URL of the Logz.io listener. If you’re not sure what this URL is, check your login URL – if it’s app.logz.io, use listener.logz.io (this is the default setting). If it’s app-eu.logz.io, use listener-eu.logz.io.
  • Logzio Metrics Host: Enter the URL of the Logz.io listener. If you’re not sure what this URL is, check your login URL – if it’s app.logz.io, use listener.logz.io (this is the default setting). If it’s app-eu.logz.io, use listener-eu.logz.io.
  • Logzio Logs Token: Enter the token of the Logz.io account you want to ship Azure logs to. You can find this token on the account page in the Logz.io UI.
  • Logzio Metrics Token: Enter a token for the Logz.io account you want to use for shipping Azure metrics to. You can use the same account used for Azure logs.

Agree to the terms at the bottom of the page, and click Purchase.

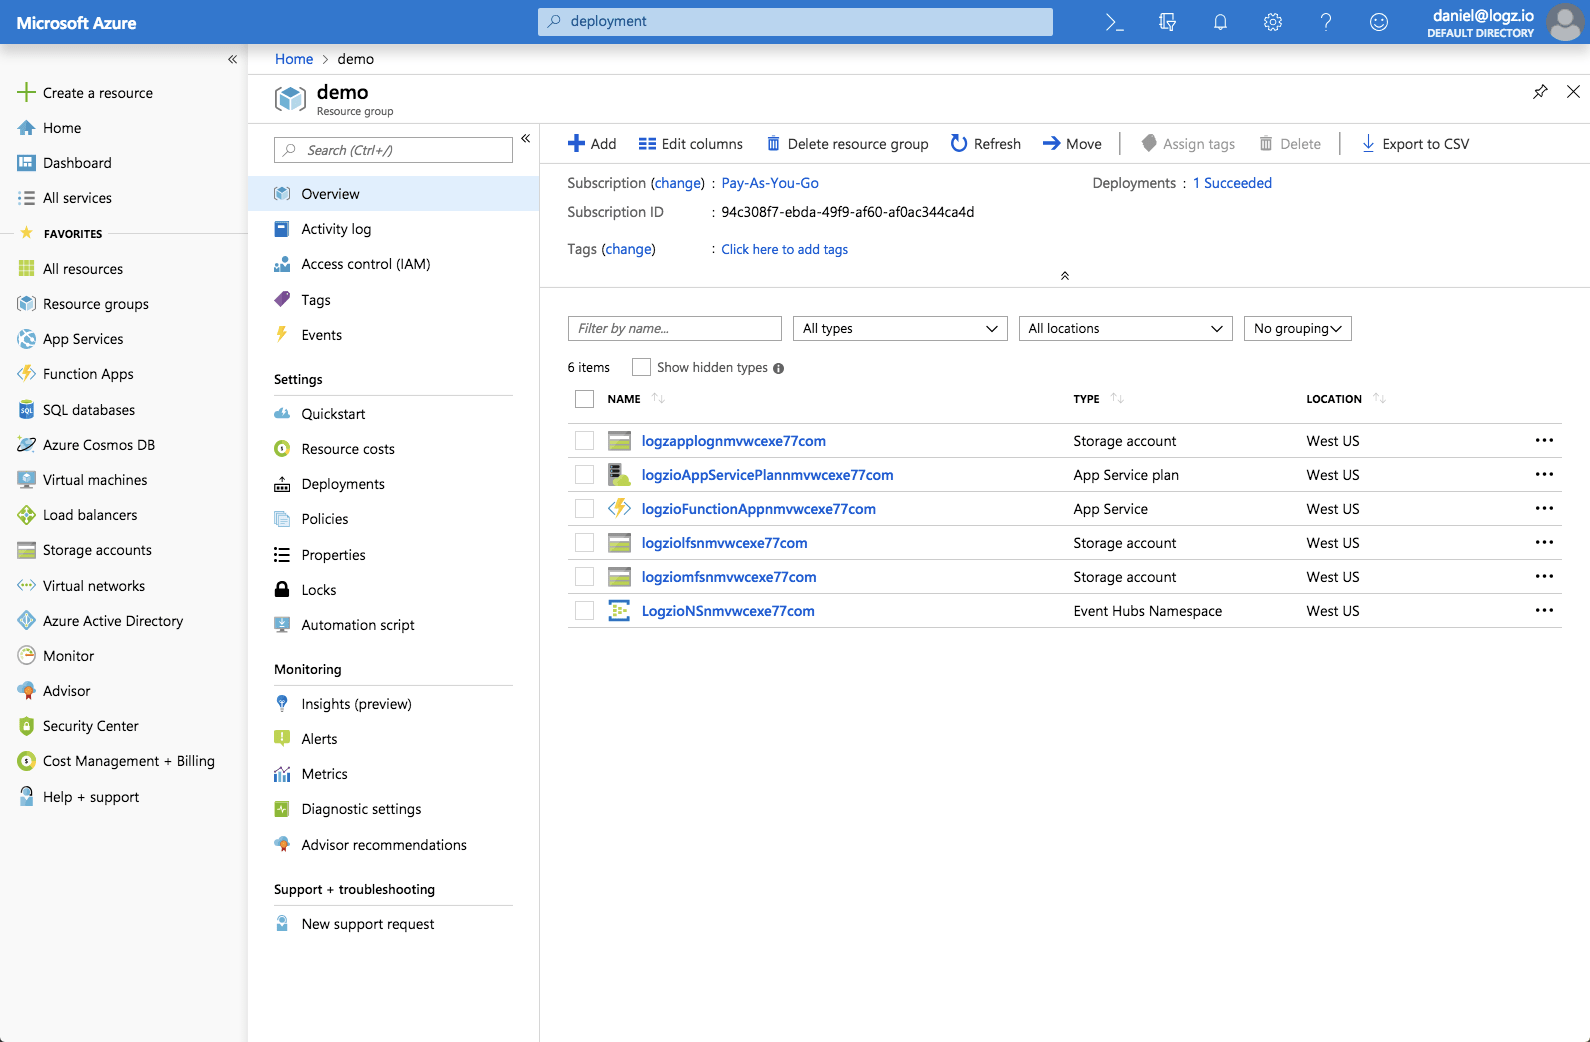
Azure will then deploy the template. This may take a while as there is a long list of resources to be deployed, but after a minute or two, you will see the Deployment succeeded message at the top of the portal.

You can visit the defined resource group to review the deployed resources:

demo

Streaming Azure Monitoring Data to Logz.io

Azure Monitor collects a large amount of operational data from various Azure resources to provide users with insight into how these resources are running. This data can be either metrics or logs, and can be sent to an Azure storage account or Event Hubs for archiving and streaming into 3rd party applications. We will be using the latter option for streaming data into Logz.io.

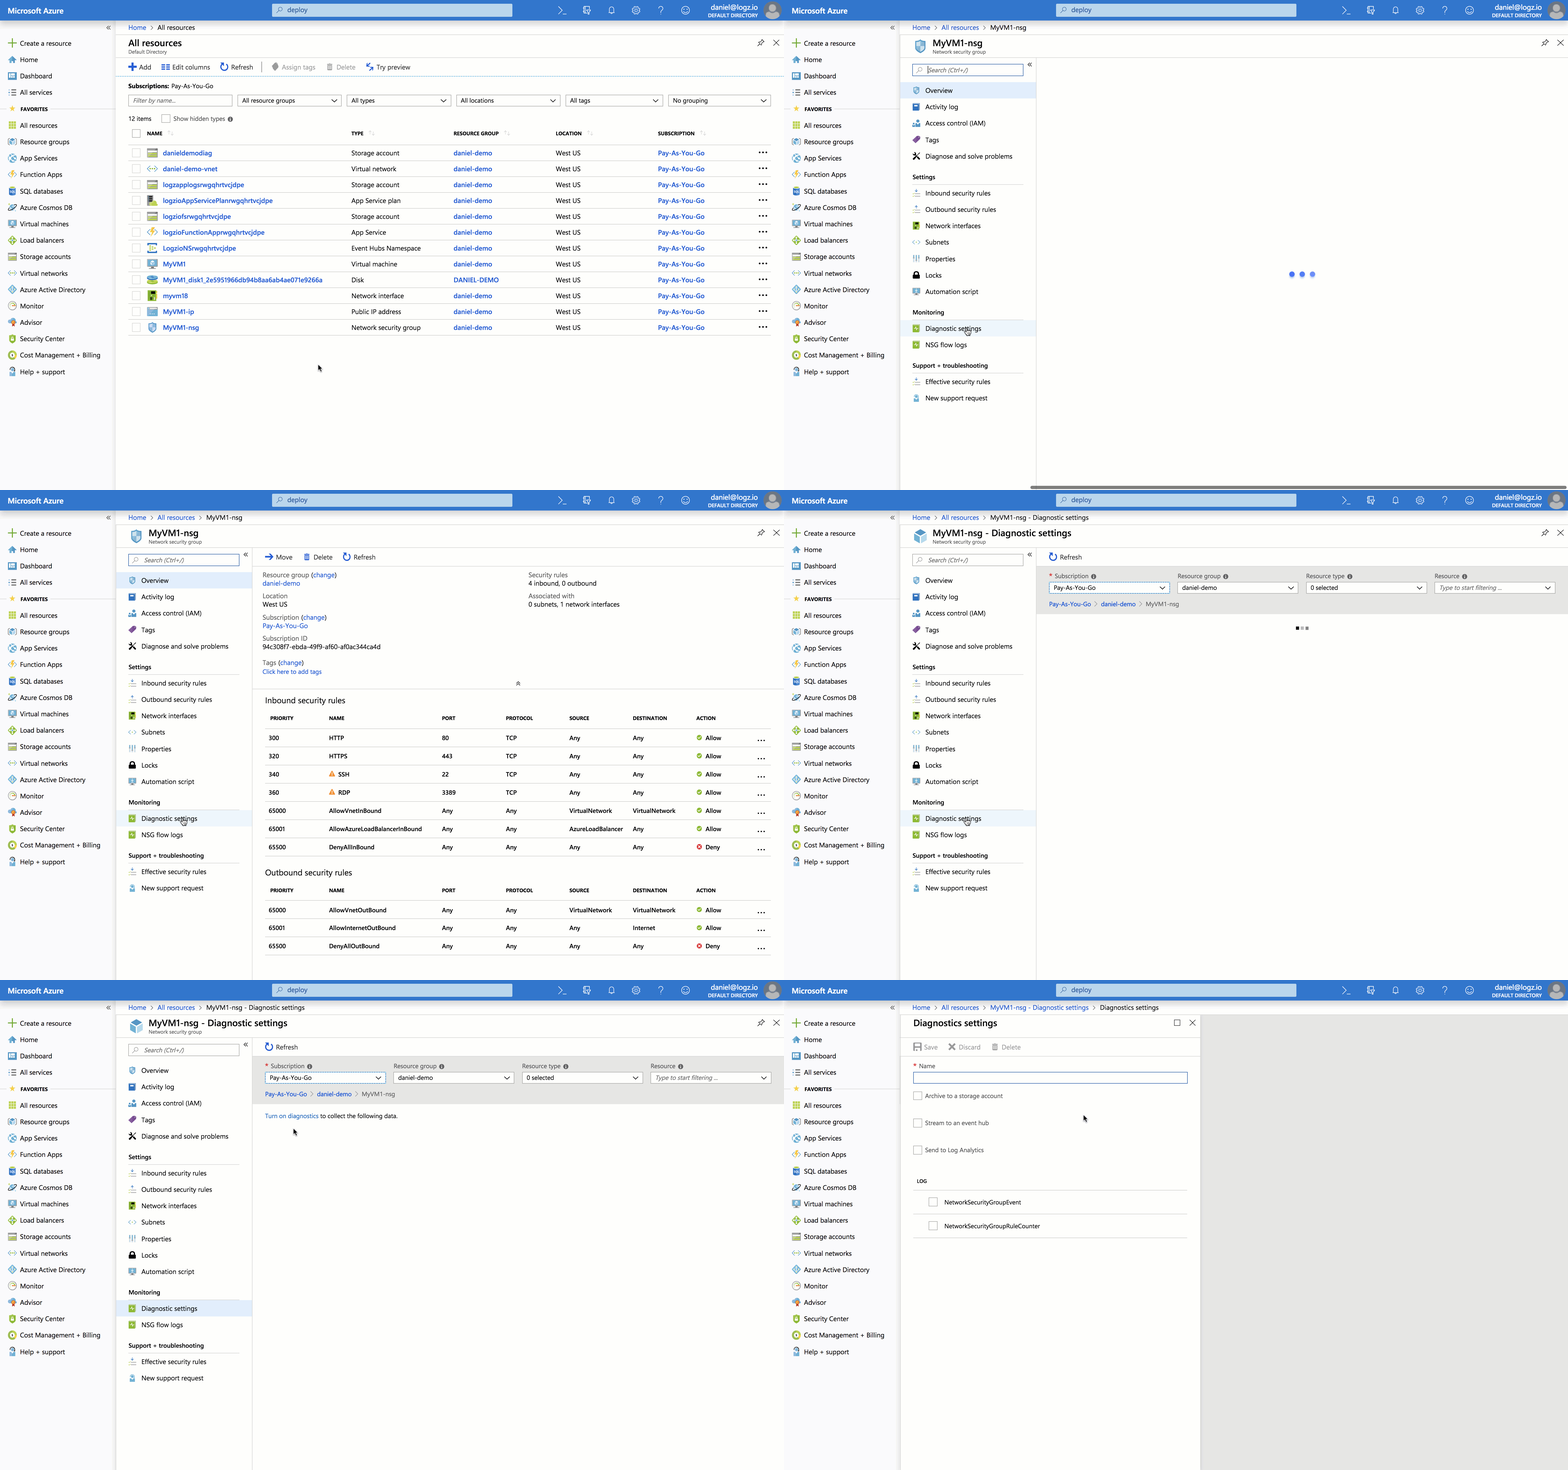
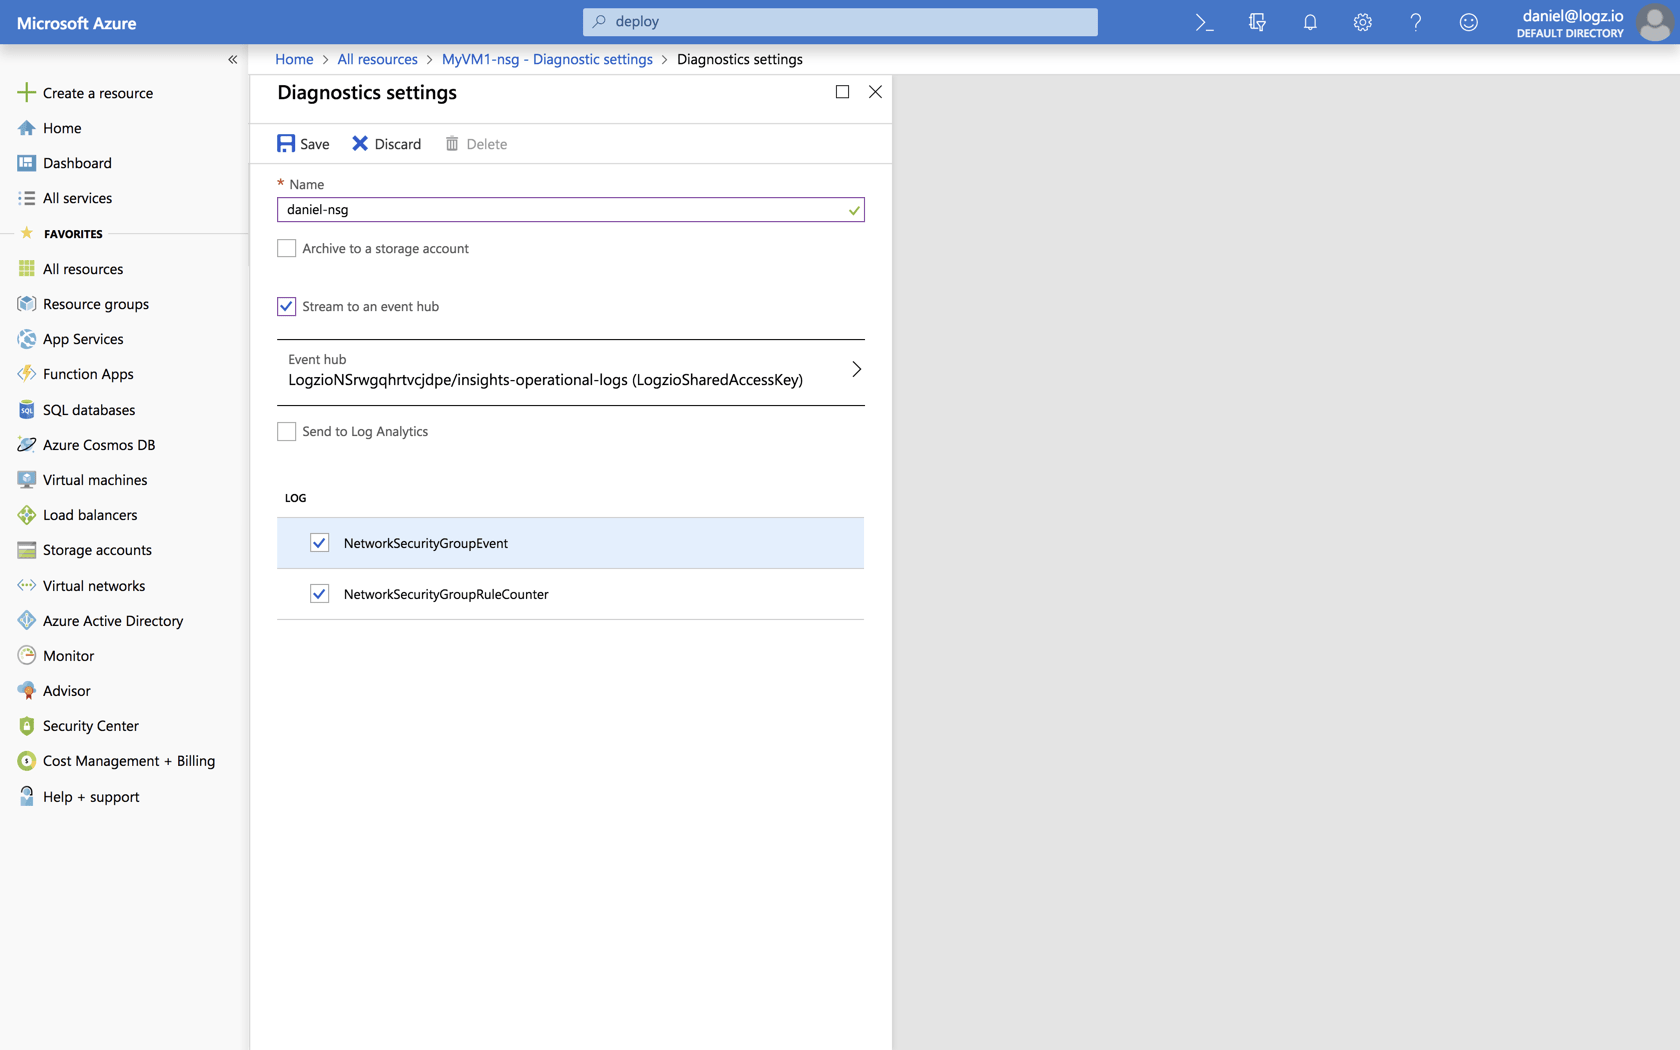
In this case, I’m going to send diagnostic logs from a Network security group.

To do this, select the Network security group you wish to ship diagnostic logs from, and click Diagnostic settings.

nsg-diagnostics

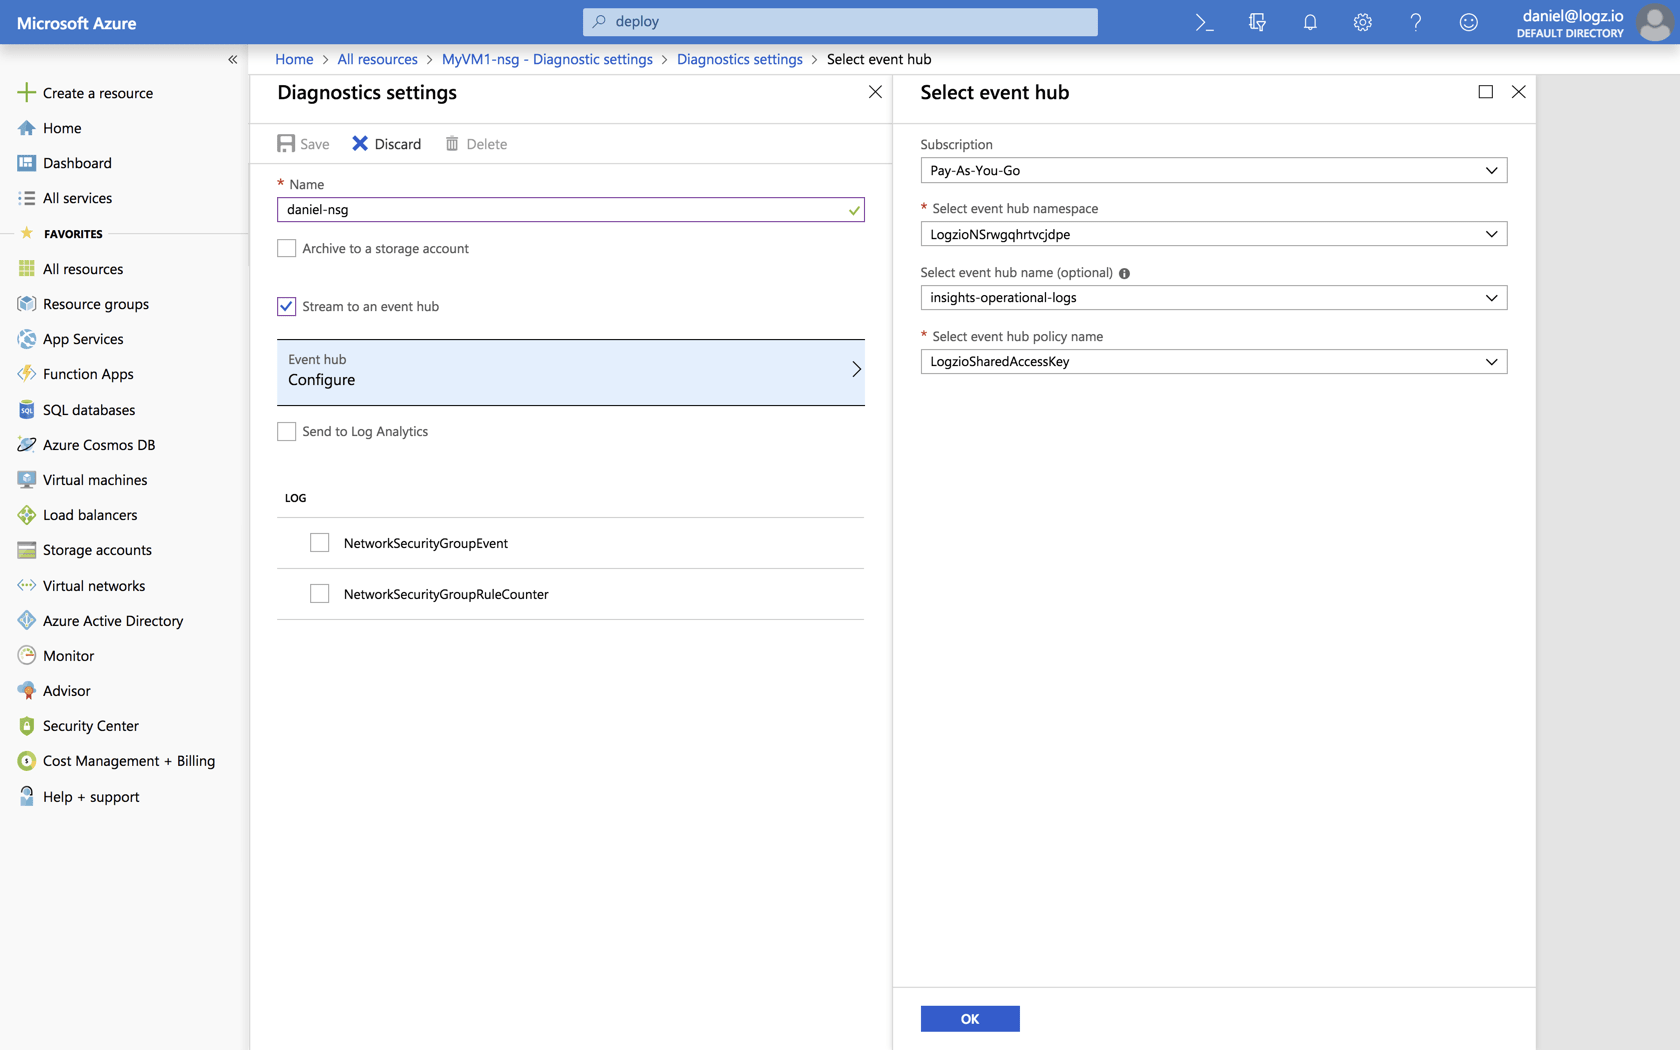
Enter a name for the settings, select Stream to an event hub and then click Configure to configure the event hub settings.

Select the event hub namespace, event hub (insights-operational-logs) and the event hub policy name that the deployment template created.

diagnostic settings

Click OK, and under the log section, select the log data you want to ship.

click ok

Save the settings.

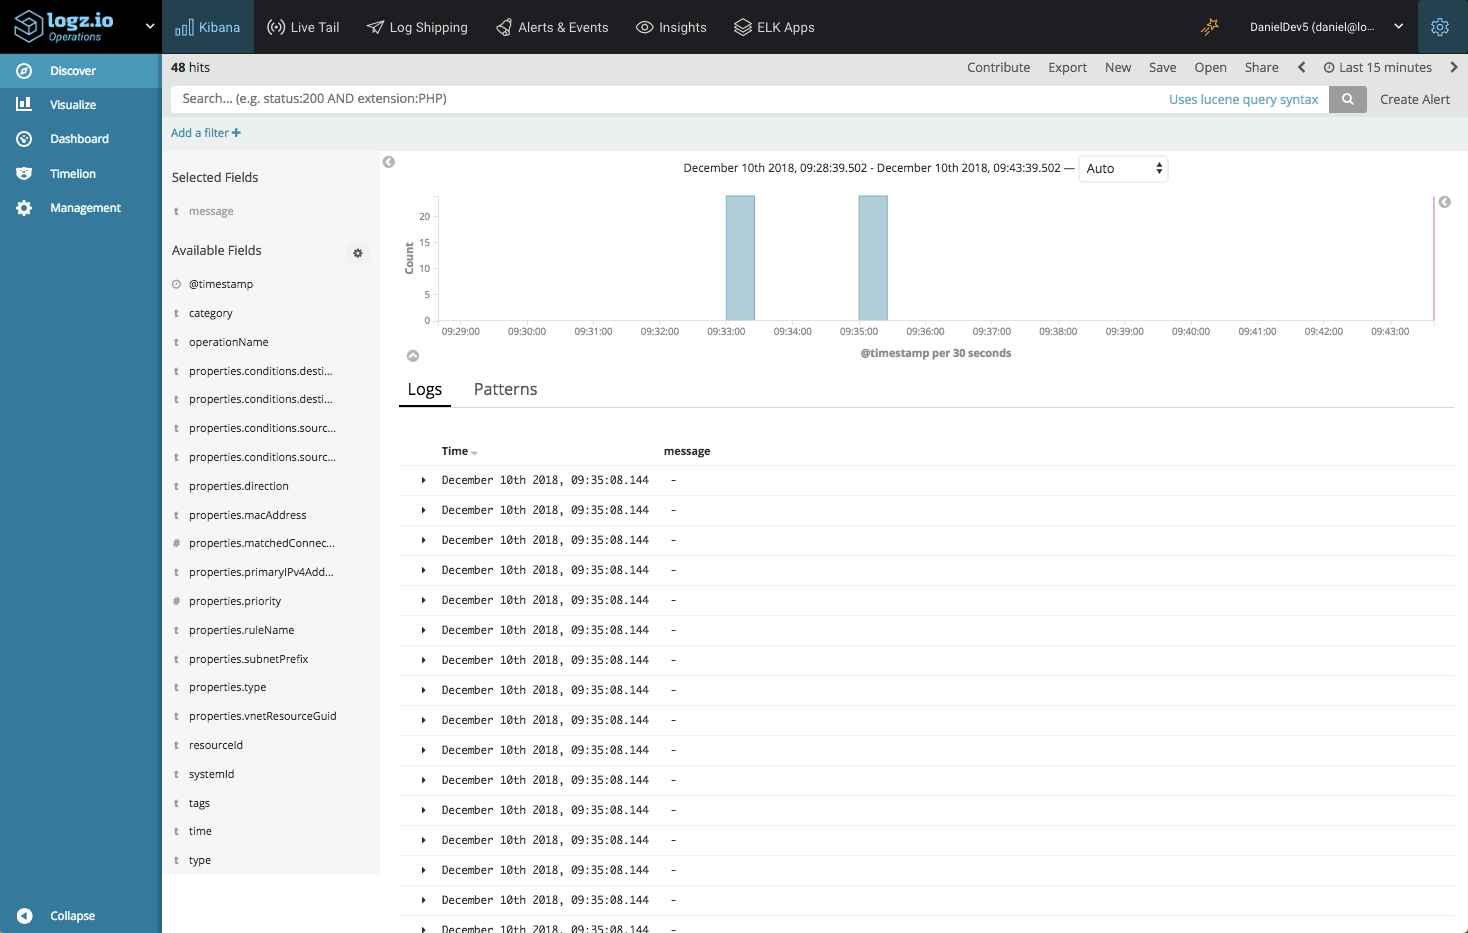
That’s it! Azure will apply the diagnostics settings and within a minute or two you will be able to see logs from your network security group in Logz.io.

kibana

Here’s an example of a Network security group log that was sent via Event Hub to Logz.io:

{
  "_index": "logzioCustomerIndex181209_v2",
  "_type": "eventHub",
  "_id": "AWeTclps0WPxxRnwRzbW.account-12986",
  "_version": 1,
  "_score": null,
  "_source": {
    "systemId": "ce08c286-34c2-4cf0-bc58-15dba8050d8b",
    "resourceId": "/SUBSCRIPTIONS/94C308F7-EBDA-49F9-AF60-AF0AC344CA4D/RESOURCEGROUPS/DANIEL-DEMO/PROVIDERS/MICROSOFT.NETWORK/NETWORKSECURITYGROUPS/DANIEL-DEMO-VM-NSG",
    "operationName": "NetworkSecurityGroupCounters",
    "type": "eventHub",
    "tags": [
      "_logz_http_bulk_json_8070"
    ],
    "@timestamp": "2018-12-09T14:50:03.987Z",
    "time": "2018-12-09T14:35:45.74Z",
    "category": "NetworkSecurityGroupRuleCounter",
    "properties": {
      "vnetResourceGuid": "{085251DC-33E5-4814-A806-2C29FBF09B0A}",
      "subnetPrefix": "10.0.0.0/24",
      "macAddress": "00-0D-3A-3B-B4-D4",
      "primaryIPv4Address": "10.0.0.4",
      "ruleName": "DefaultRule_DenyAllOutBound",
      "direction": "Out",
      "type": "block",
      "matchedConnections": 0
    }
  },
  "fields": {
    "@timestamp": [
      1544367003987
    ]
  },
  "sort": [
    1544367003987
  ]
}

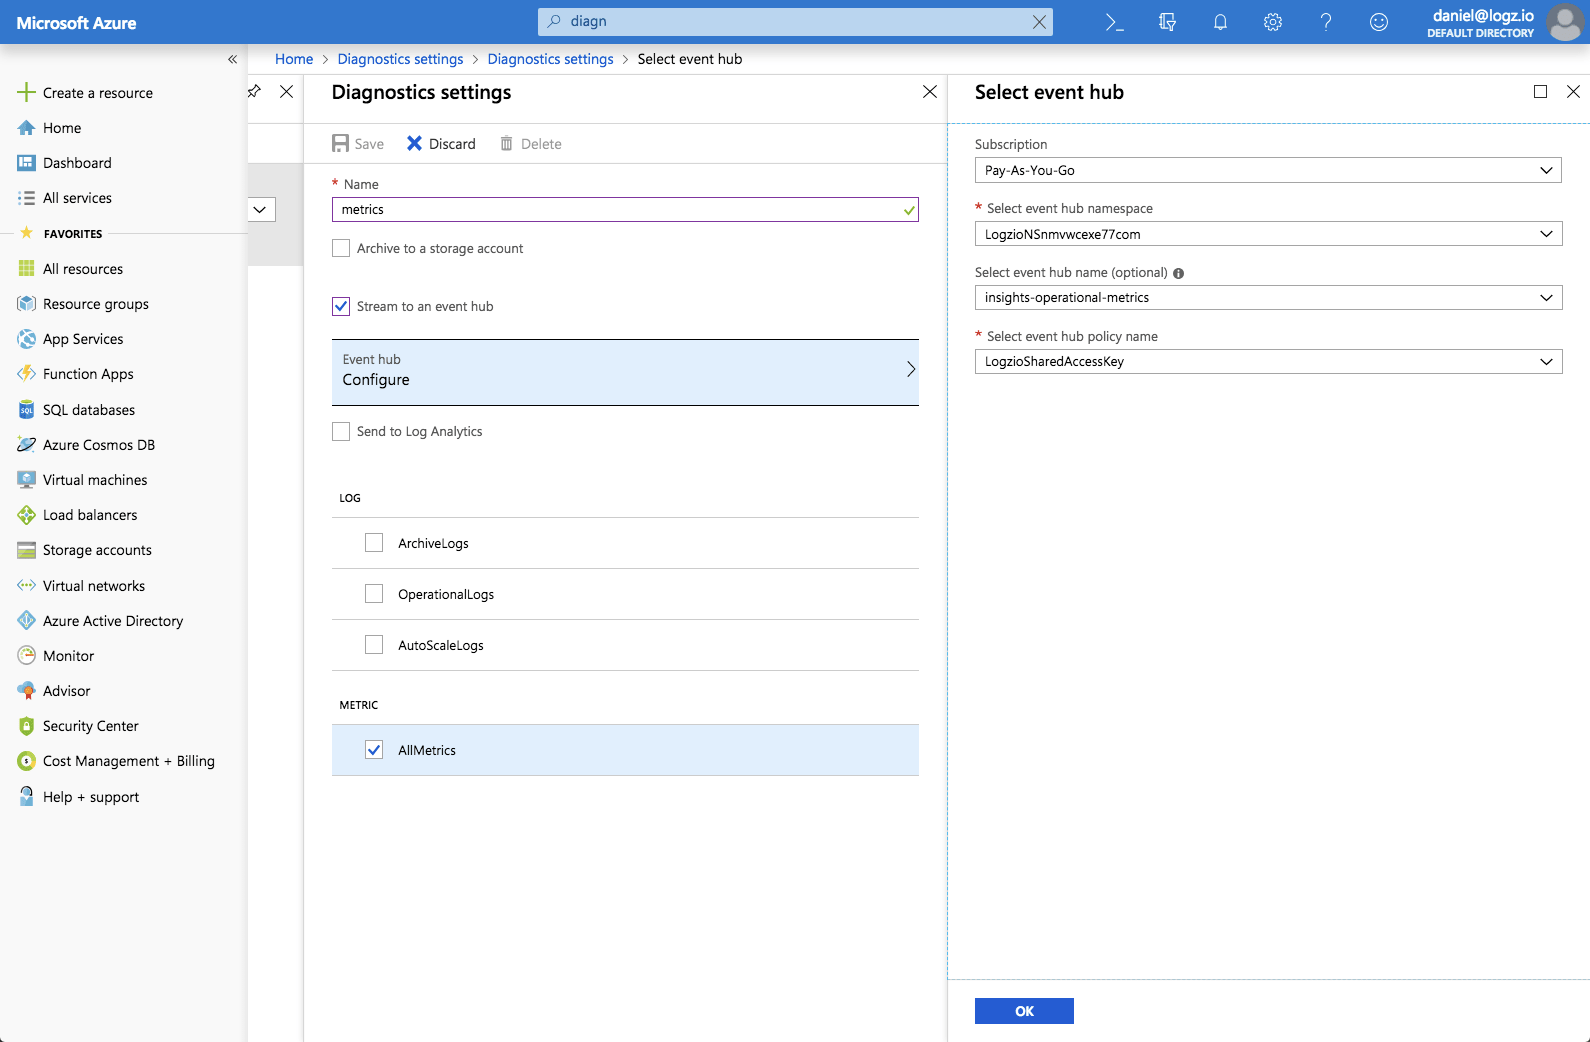
To ship Azure metrics to Logz.io, simply repeat the same process. This time, however, be sure to select the metrics Events Hub created as part of the deployment template (insights-operational-metrics).

metrics

This ensures the metrics are parsed correctly by the correct Azure function and streamed to the Logz.io account you defined for storing metrics when you deployed the template.

Analyzing and visualizing the data

Logz.io provides various tools for using the collected data for monitoring and troubleshooting.

To search for specific events, you can use the search box at the top of the Discover page to enter different types of queries.

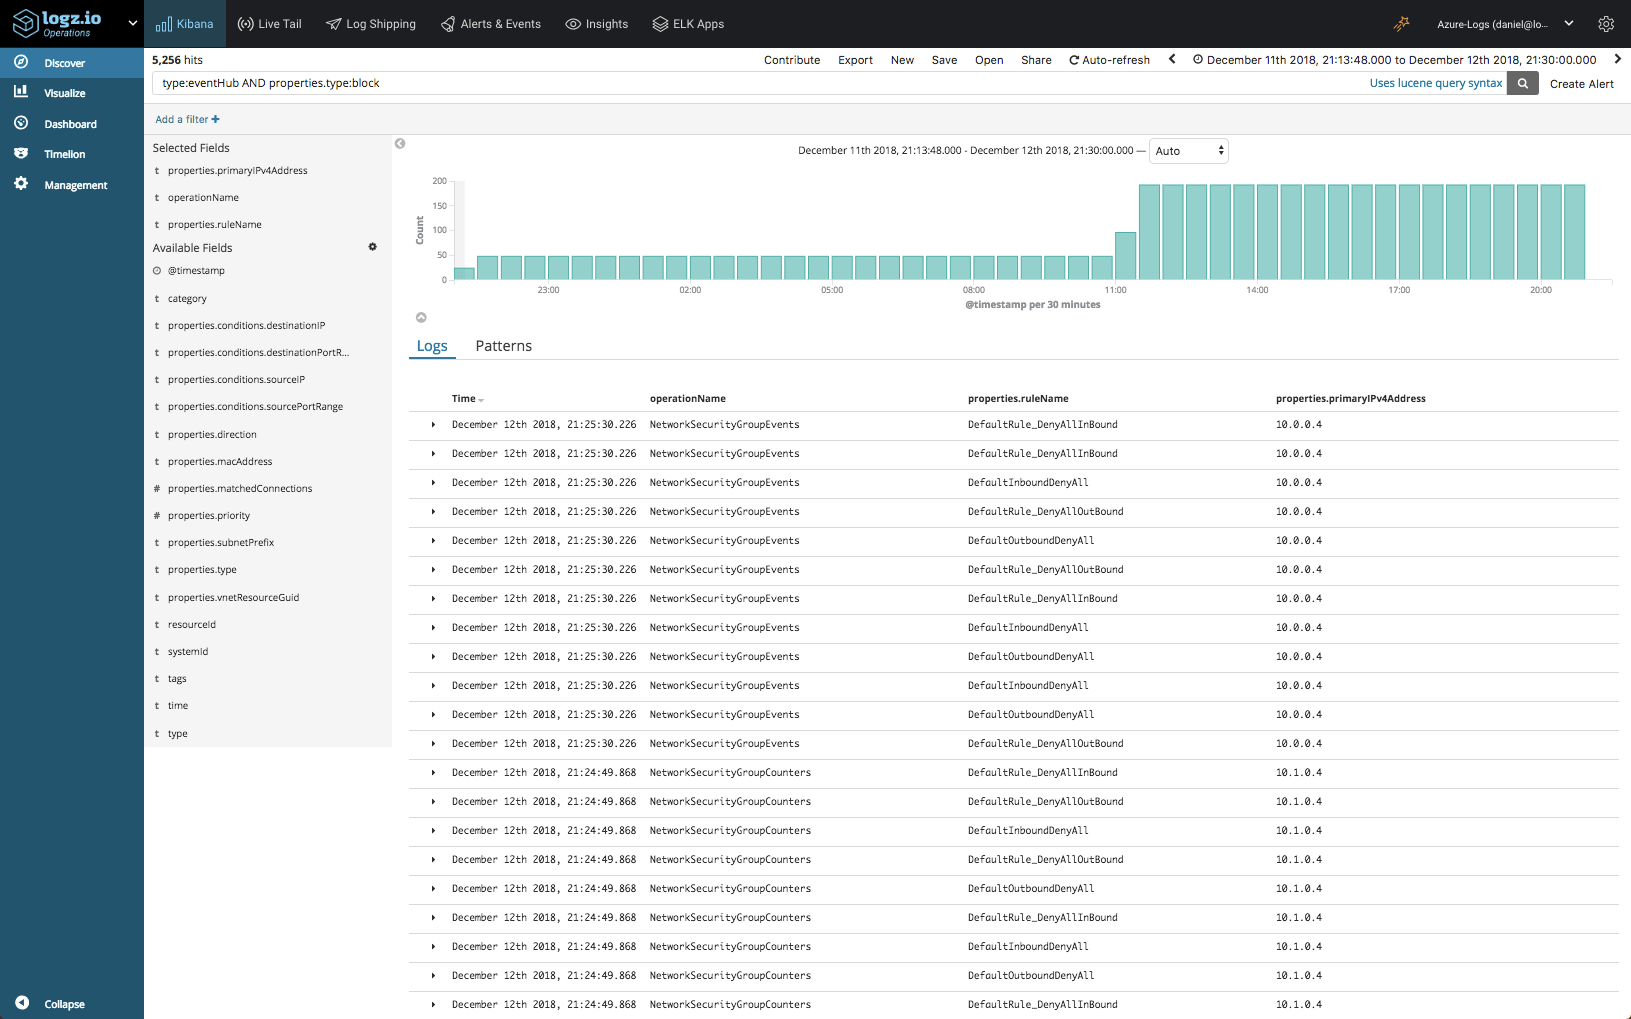
For our Network Security Group example, we can use the following query to search for blocked traffic:

type:eventHub AND properties.type:block

block

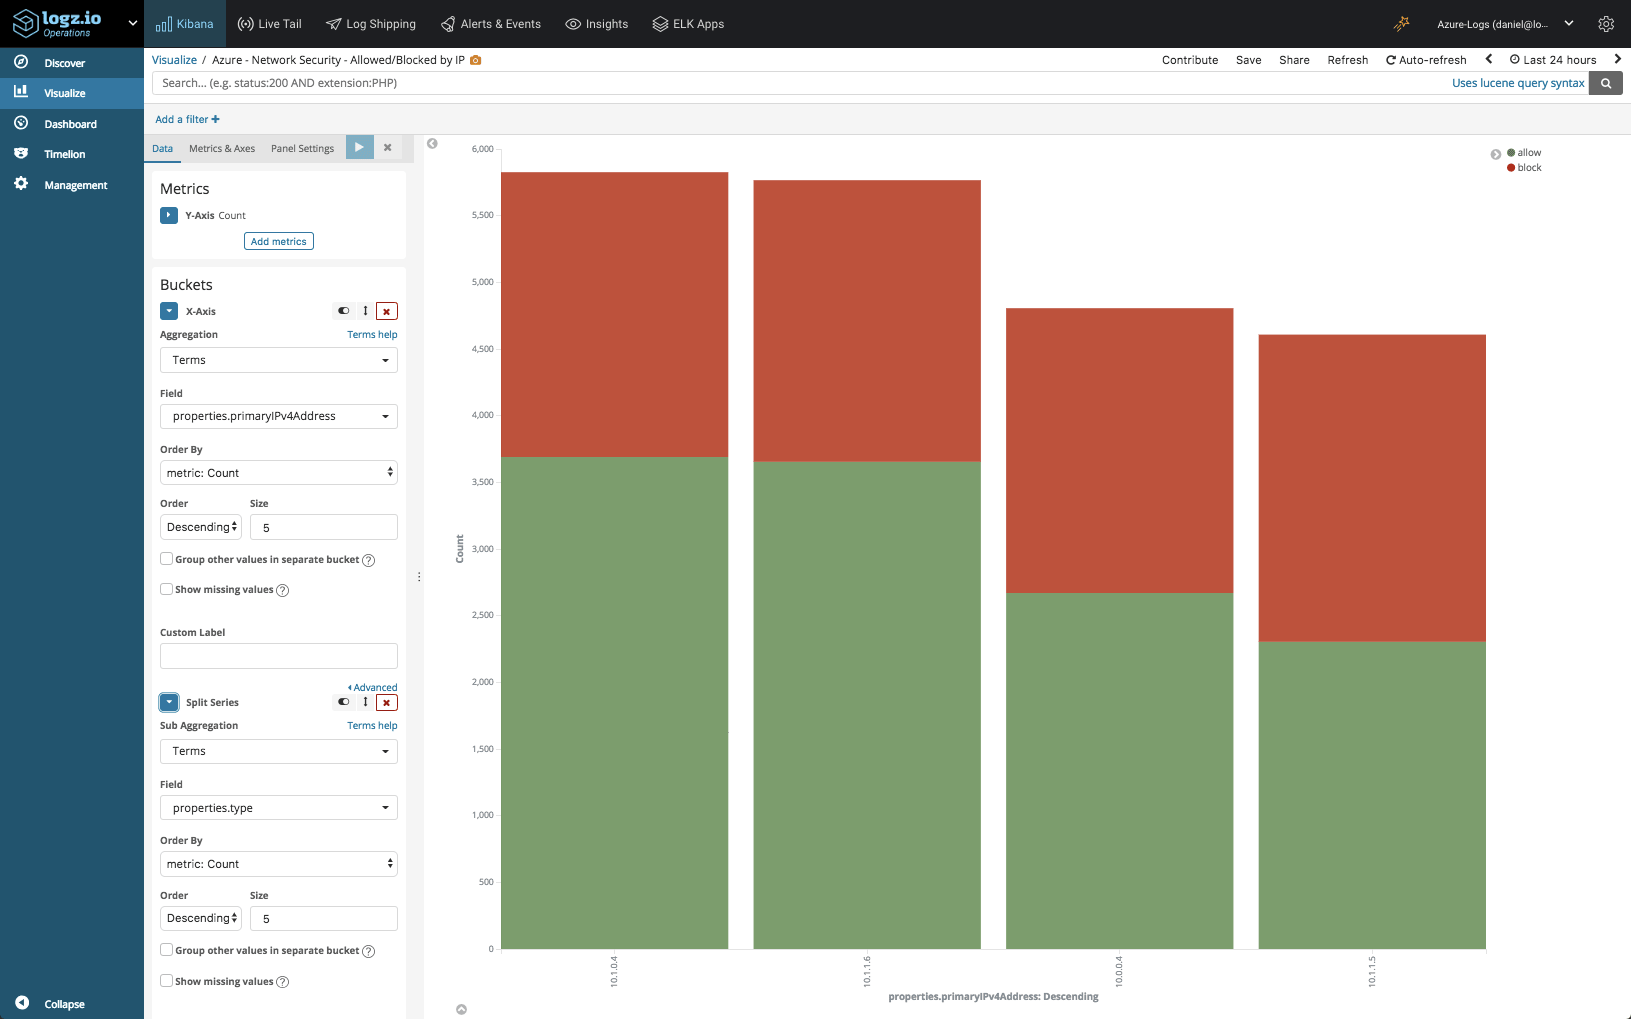
Or, you can build Kibana visualizations for monitoring different data points. In the case of Network Security Groups, we could, for example, build a visualization that provides a breakdown of allowed vs. blocked traffic, per IP:

graph

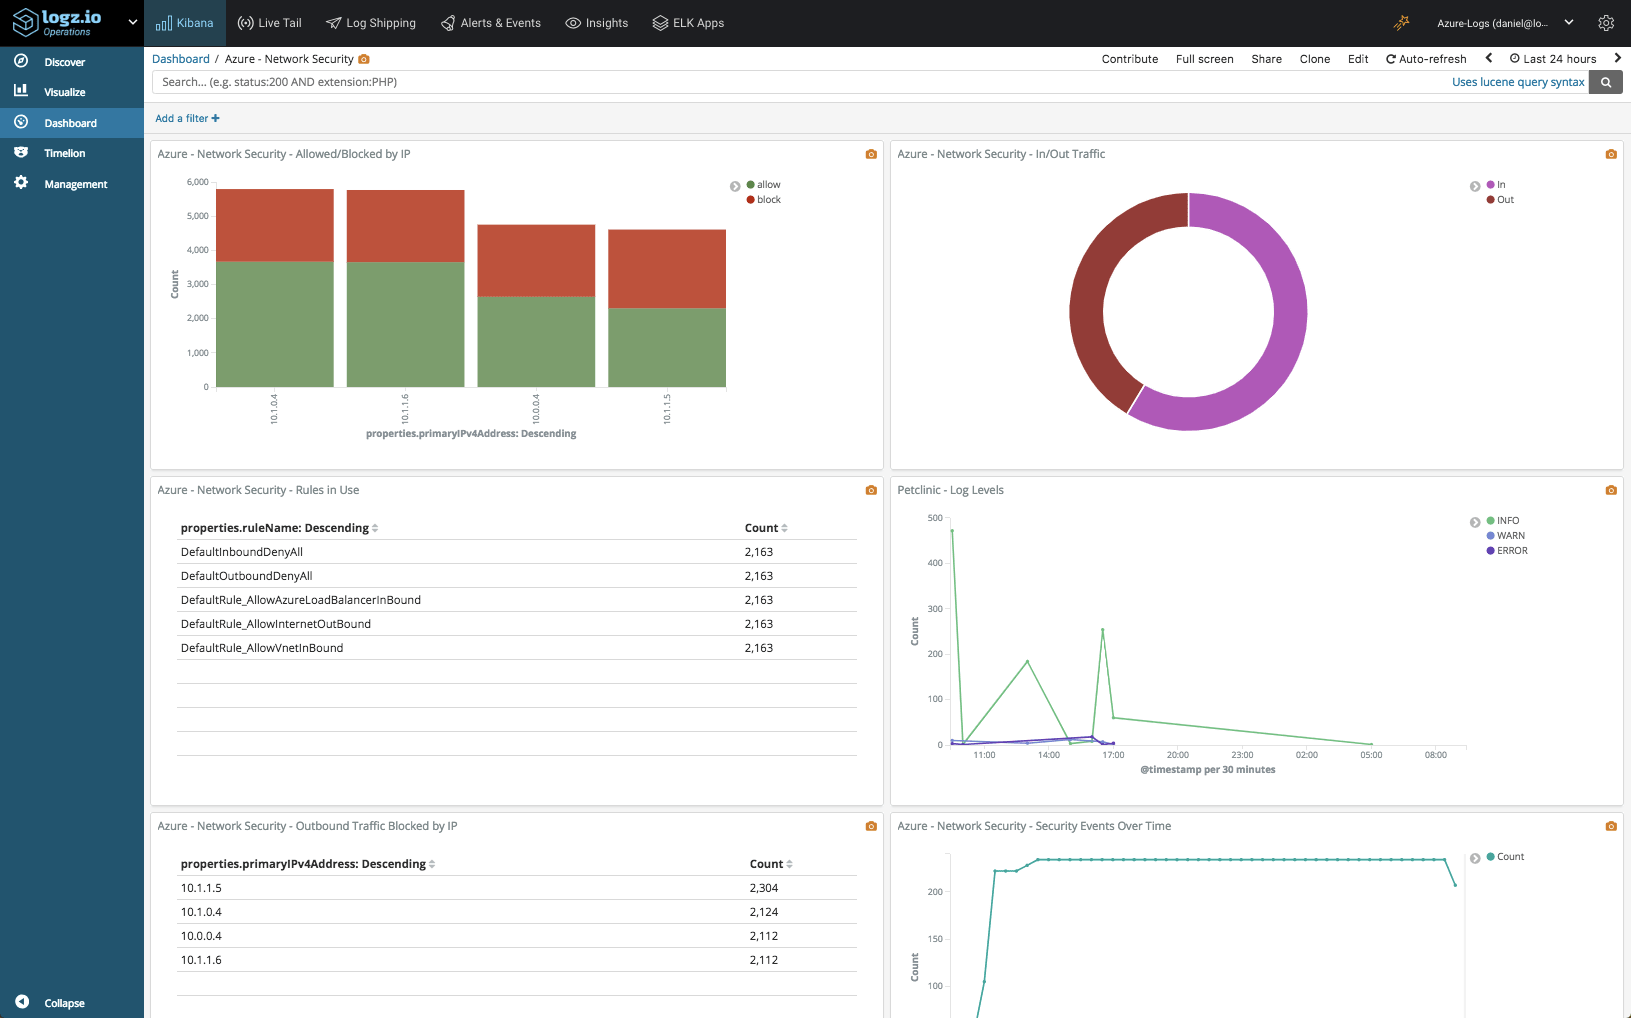
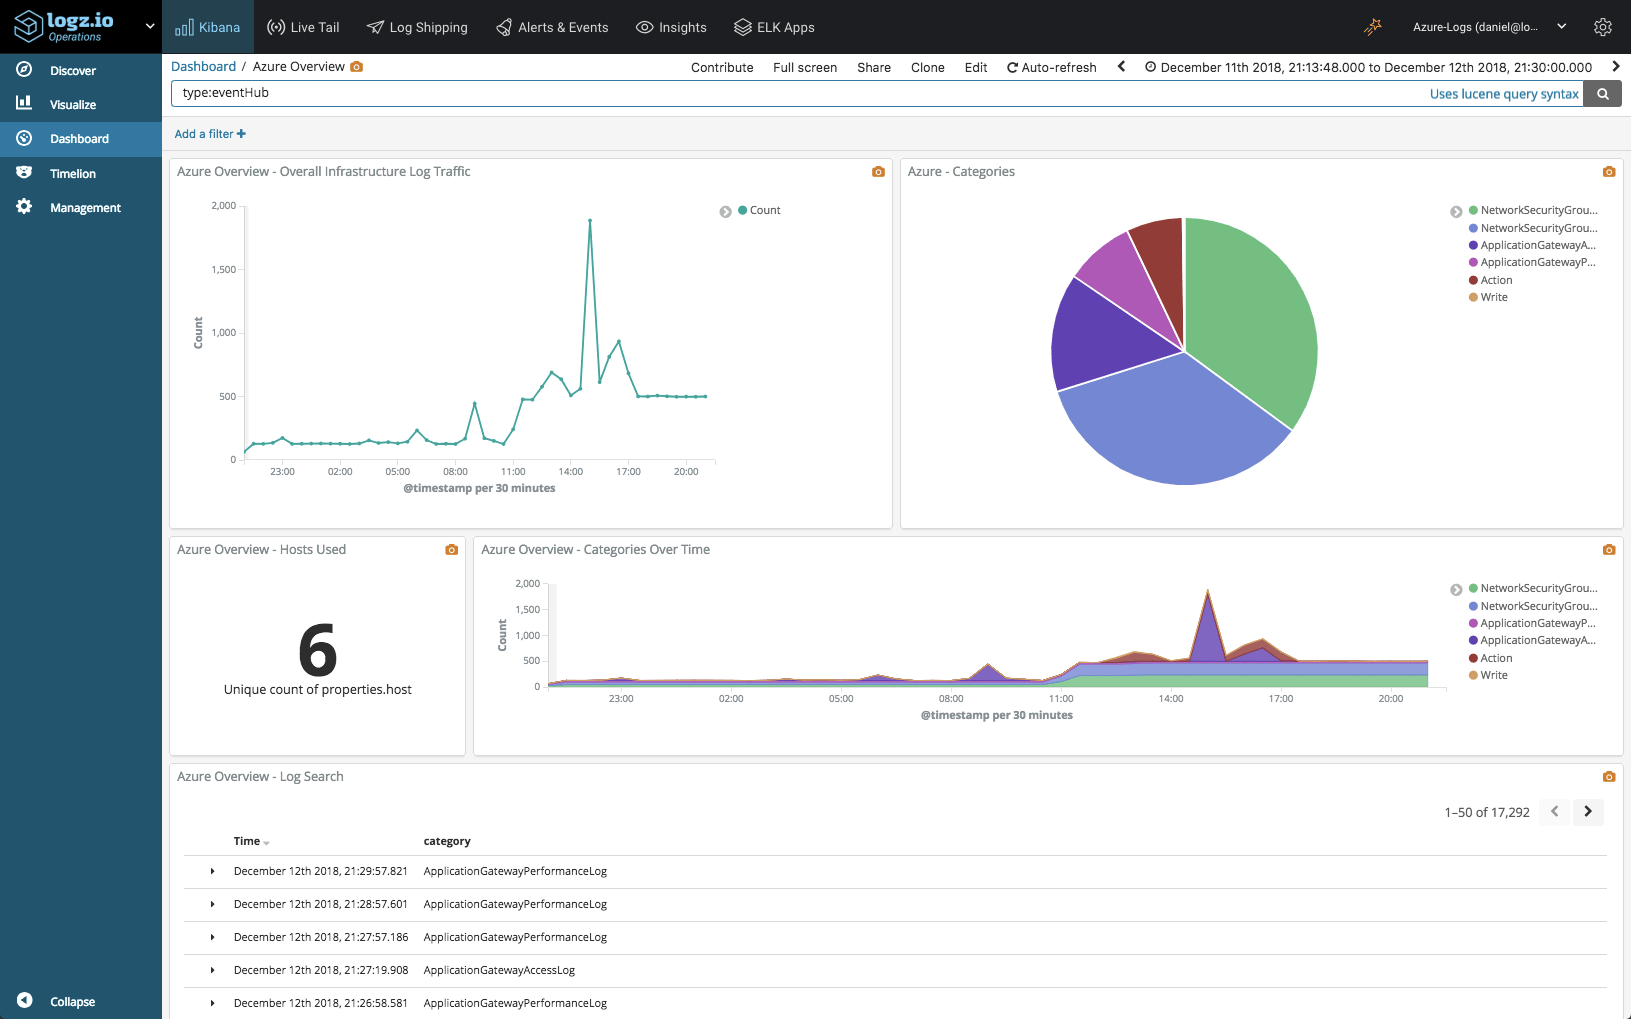
Kibana allows you to slice and dice your data in any way you want, and once you’ve lined up all your visualizations you can build a dashboard to gain a more comprehensive view:

dashboard

Proactive monitoring with alerts

Logz.io provides a powerful alerting mechanism that allows users to be more proactive when monitoring their Azure environment. Based on a query, you can define what event to be alerted on and how.

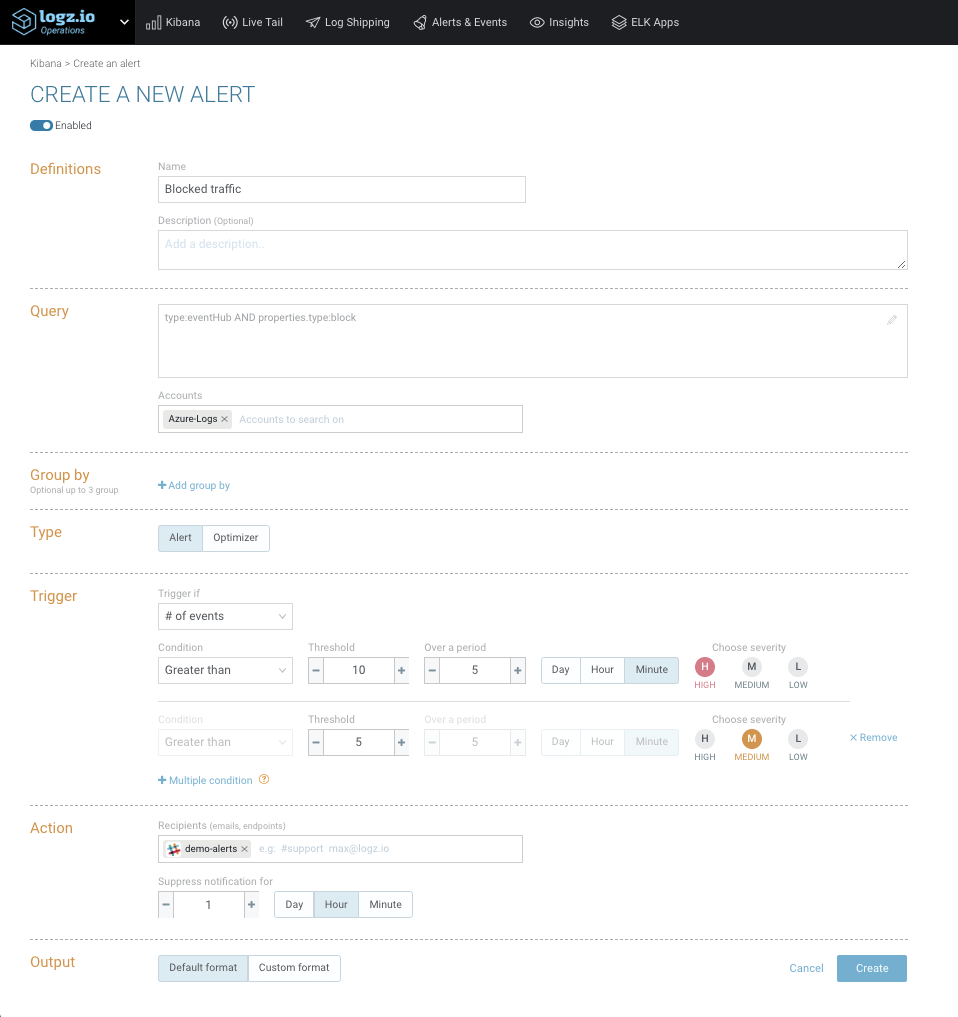
Based on the query provided above for blocked traffic, clicking the Create alert button on the top-right corner of the Discover page opens up the Create a New Alert page:

create alert

Here I can define the alert conditions – the exact threshold for triggering the alert, severity levels, who to notify and in what format. You can notify teammates via email, Slack, PagerDuty, and more.

Gaining a comprehensive view of Azure

Azure generates diagnostic logs and metrics for a variety of resources, providing users with extremely useful data for monitoring and troubleshooting an Azure environment.

We described collecting and analyzing Network Security Group diagnostic logs. For other Azure resources, simply repeat the process above for each resource you have deployed, whether it’s an SQL server, an application gateway, a network security group, and so forth (a list of the resources diagnostics data is available for can be found here). You can use the same Azure function and Event Hub for streaming the data into Logz.io.

Azure also generates what are called Activity Logs — for monitoring who did what and when for any resources in a specific Azure subscription. Using the integration described here, this data can also be shipped into Logz.io for analysis (we’ll cover this use case in the next article on Azure monitoring).

Grabbing both these types of Azure logs, you’ll be able to gain a complete view of your Azure deployment.

Azure deployment

Endnotes

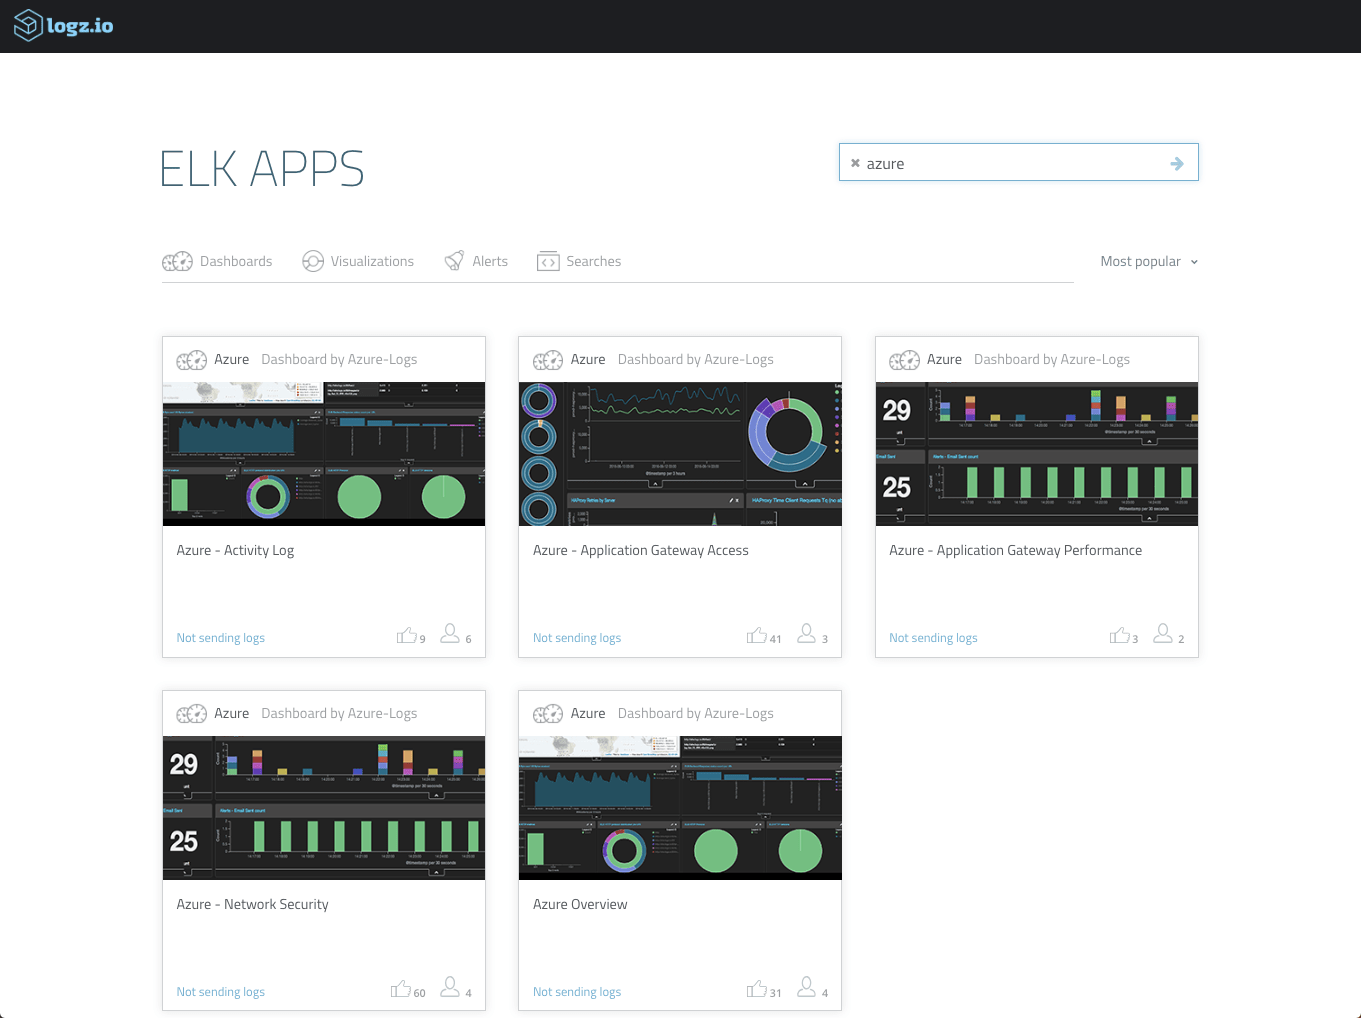
The dashboards shown above are available in ELK Apps — our library of premade dashboards and visualizations for various platforms and environments, including now Azure as well. These dashboards can be easily deployed with one click to save you the bother of starting from scratch.

ELK Apps

We’re working on some new integrations with Azure that will make it even easier to collect, stream and analyze data in Logz.io, so stay tuned.

The combination of Azure and Logz.io gives users the opportunity to enjoy the best of both worlds — scalable and reliable cloud computing resources together with advanced machine data analytics to be able to monitor them.  

Easily monitor your Azure environment with our built-in Azure dashboards


How we were able to Identify and Troubleshoot a Netty Memory Leak

$
0
0

Let’s start with the happy ending — after a long search, we managed to identify a Netty memory leak in one of our log listeners and were able to troubleshoot and fix the issue on time before the service crashed. 

Listening to Netty

Backing up a bit, let’s provide some context.

Logz.io’s log listeners act as the entry point for data collected from our users and are subsequently pushed to our Kafka instances. They are Dockerized Java services, based on Netty and are designed to handle extremely high throughput.

Netty memory leaks are not an uncommon occurrence. In the past, we’ve shared some lessons learned from a ByteBuf memory leak and there are other types of memory issues that can arise, especially when handling high volumes of data. Manual tweaking of the cleanup process for unused objects is extremely tricky and blown up memory usage is a scenario experienced by many scarred engineering teams (don’t believe me? just Google it).    

In a production environment handling millions of logs messages a day though, these events run the risk of going unnoticed–until disaster strikes and memory runs out, that is. Then they are extremely noticed.

Identifying the leak

So how was the Netty memory leak identified in this case?

The answer is Logz.io’s Cognitive Insights — a technology that combines machine learning with crowdsourcing to help reveal exactly this type of event. It works by identifying correlations between logs and discussions in technical forums and flagging them as events within Kibana. Then, it displays them together with actionable information which can be used to debug and prevent the same event from occurring in the future..

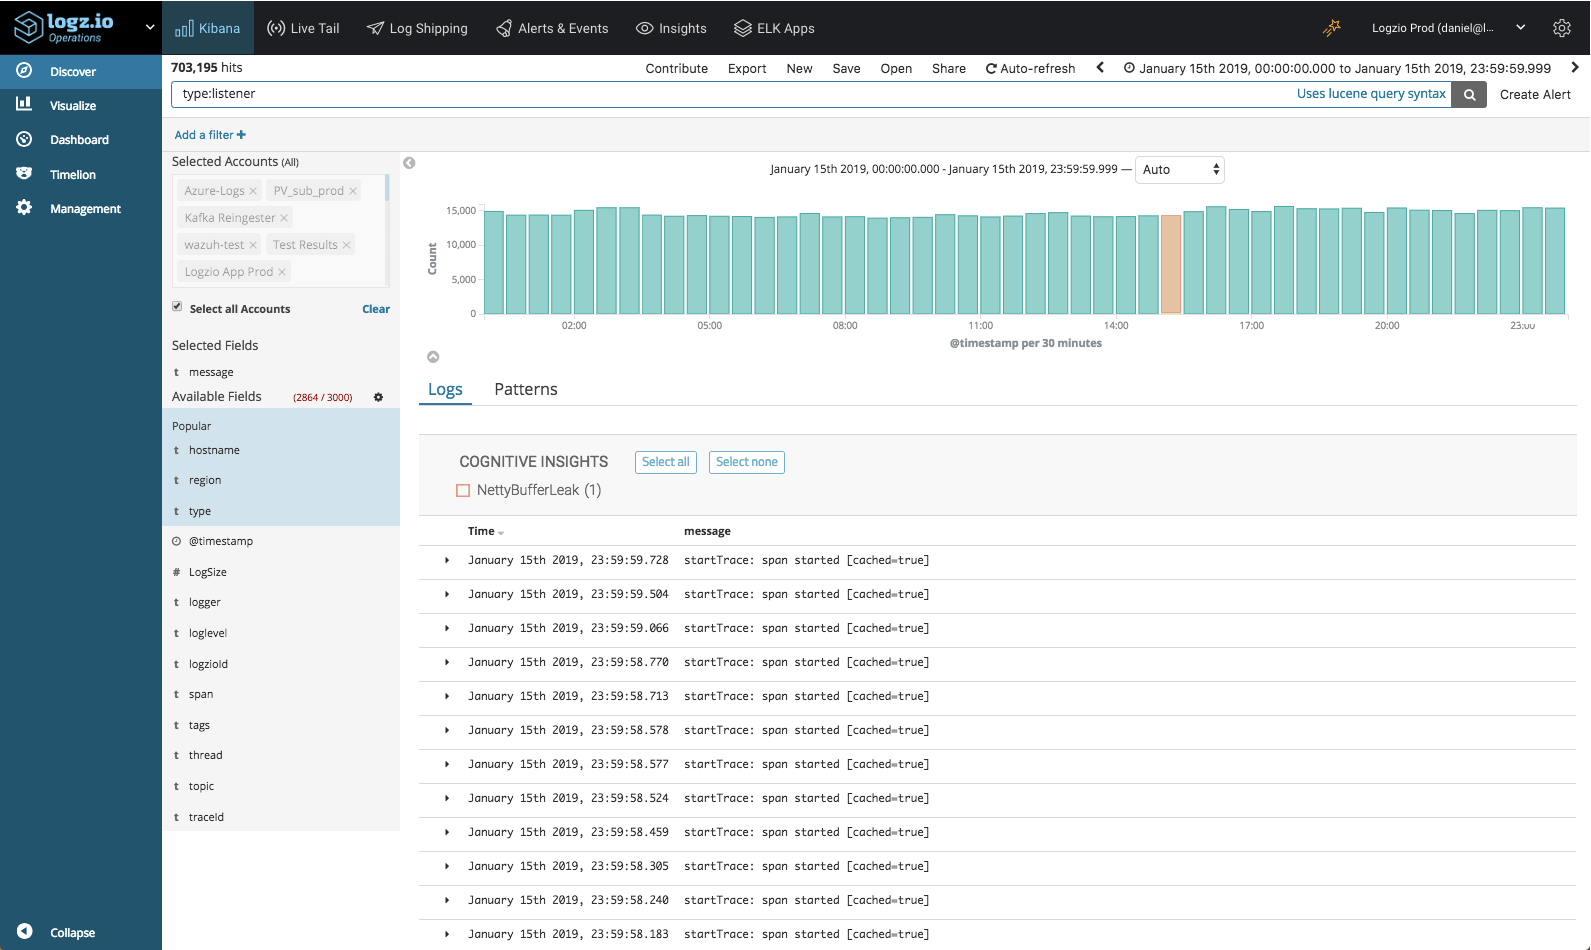
On the day in question, January 15, our system recorded over 400 million log messages. Out of these messages, Cognitive Insights identified one log message generated by the listener service — NettyBufferLeak.

netty leak

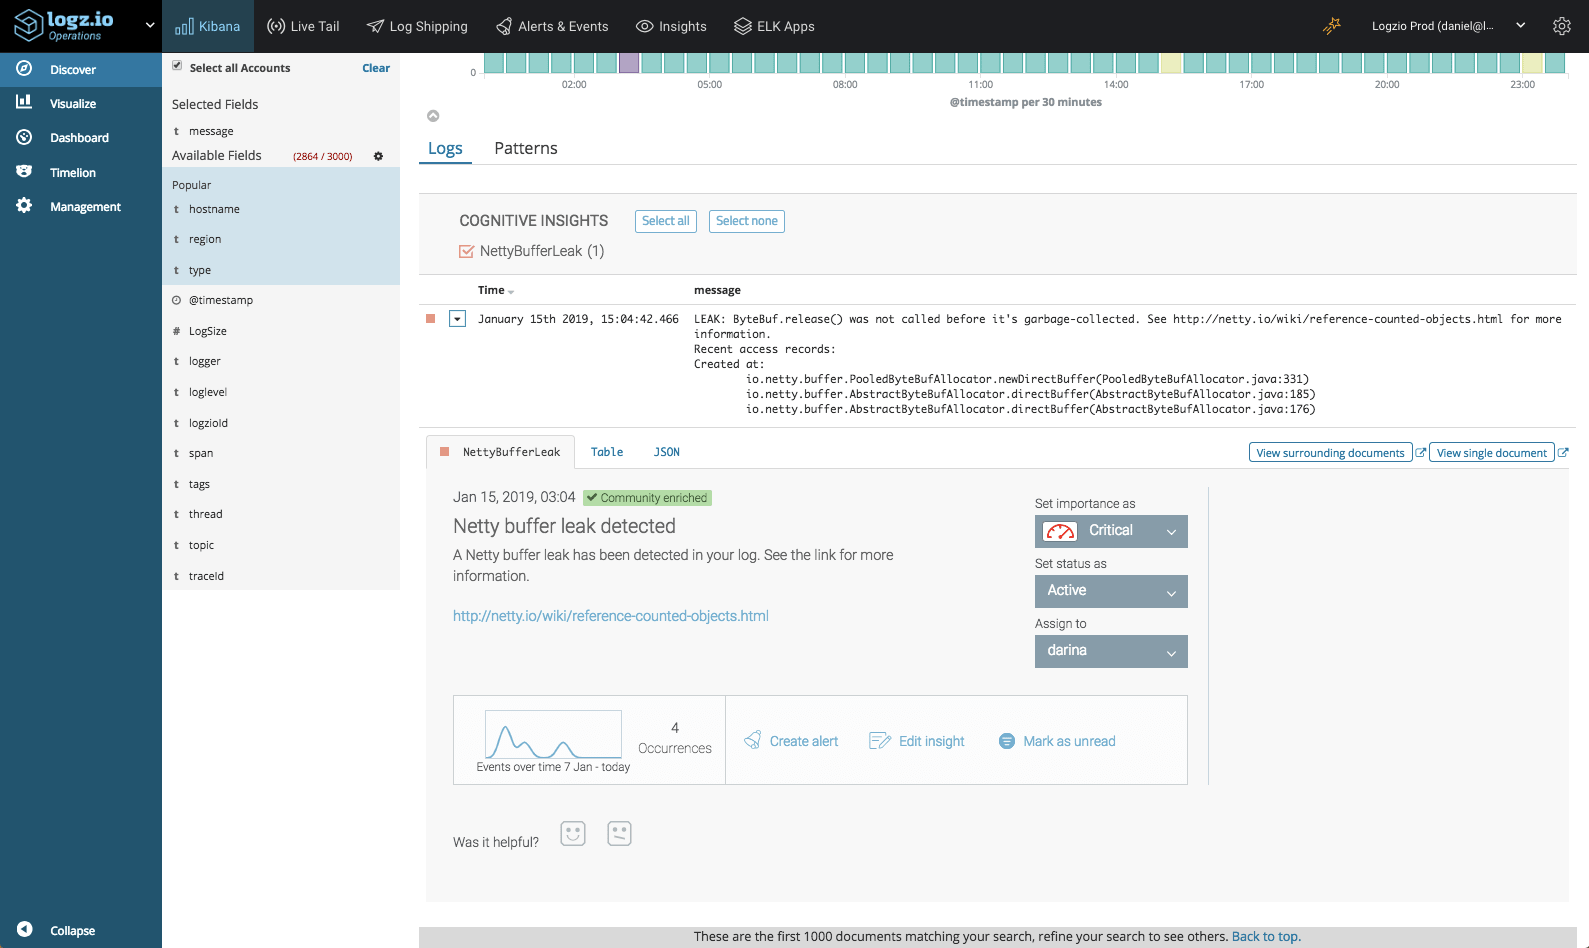
Opening the insight, more details were revealed. Turns out that this event had transpired 4 times during the recent week and that this specific event was discussed in Netty’s technical documentation, the link to which is included in the insight.  

insight

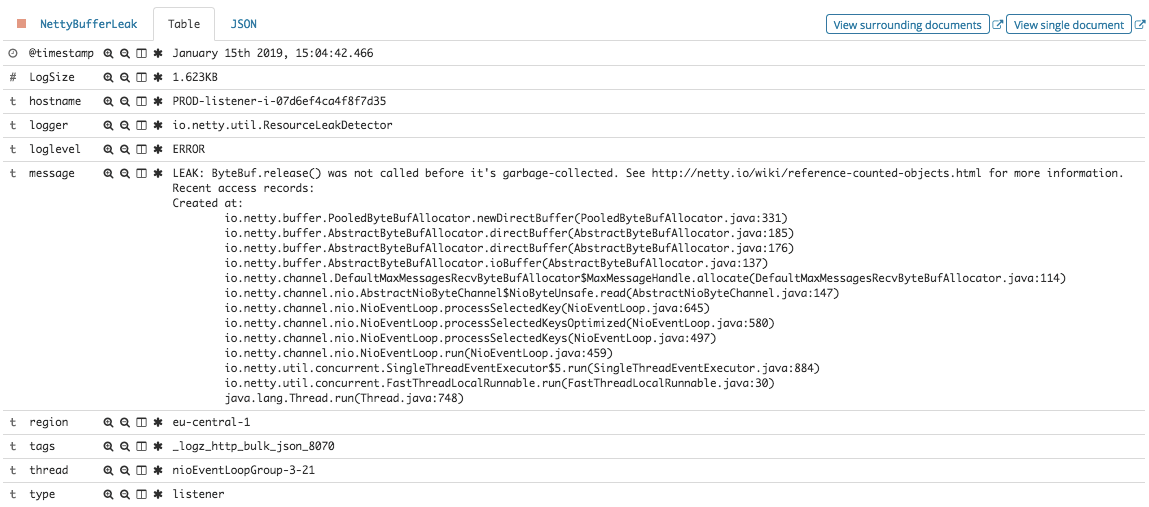
Taking a look at the actual stacktrace included in the message, our team was able to understand the cause of the leak and fix it.

fix

Going proactive

While there are fail-safe mechanisms in place for failed listeners, this scenario is not one Logz.io can afford and we’d rather avoid waking up an on-call engineer if possible.

To prevent similar memory leaks from happening in the future, we executed a number of measures based on the information provided to us in the insight. First, we created tests based on the specific log message the insight surfaced and then used them to verify that our fix to the leak did not generate the log. Second, we created an alert to notify us should this exact event take place in the future.  

Endnotes

In the field of log analysis, one of the biggest challenges facing engineers is being able to find the needle in the haystack and identify that single log message which indicates that something in the environment is broken and is about to crash our service. Often enough, events will simply go unnoticed in the stream of big data being ingested into the system.

There are different methods used to overcome this challenge, a popular one being anomaly detection. A baseline for normal behavior is identified and deviations from this baseline trigger alerts. While sufficient in some cases, a traditional anomaly detection system would most likely not have identified the Netty memory leak — an event that is extremely slow and gradual, with leakages occurring intermittently over time.

Using correlations between specific log messages and the vast wealth of technical knowledge on the web, helps reveal critical events that would otherwise have gone unnoticed. A large number of our users are already leveraging Cognitive Insights for this purpose, and I’ll follow up with a piece on some examples of events we’ve helped uncover.

Easily identify, contextualize, and remediate issues with powerful machine learning.

Kafka Logging with the ELK Stack

$
0
0

Kafka and the ELK Stack — usually these two are part of the same architectural solution, Kafka acting as a buffer in front of Logstash to ensure resiliency. This article explores a different combination — using the ELK Stack to collect and analyze Kafka logs. 

As explained in a previous post, Kafka plays a key role in our architecture. As such, we’ve constructed a monitoring system to ensure data is flowing through the pipelines as expected. Key performance metrics, such as latency and lag, are closely monitored using a variety of processes and tools.

Another element in this monitoring system is Kafka logs.

Kafka generated multiple types of log files, but we’ve found the server logs to be of particular use. We collect these logs using Filebeat, add metadata fields, and apply parsing configurations to parse out the log level and Java class.

In this article, I’ll provide the instructions required to hook up your Kafka servers to the ELK Stack or Logz.io so you can set up your own logging system for Kafka. The first few steps explain how to install Kafka and test it to generate some sample server logs, but if you already have Kafka up and running simply skip to the next steps that involve installing the ELK Stack and setting up the pipeline.

Installing Kafka

Java is required for running both Kafka and the ELK Stack, so let’s start with installing Java:

sudo apt-get update
sudo apt-get install default-jre

Next, Apache Kafka uses ZooKeeper for maintaining configuration information and synchronization so we’ll need to install ZooKeeper before setting up Kafka:

sudo apt-get install zookeeperd

By default, ZooKeeper listens on port 2181. You can check by running the following command:

netstat -nlpt | grep ':2181'

Next, let’s download and extract Kafka:

wget http://apache.mivzakim.net/kafka/2.1.0/kafka_2.11-2.1.0.tgz
tar -xvzf kafka_2.12-2.1.0.tgz
sudo cp -r kafka_2.11-2.1.0 /opt/kafka

We are now ready to run kafka, which we will do with this script:

sudo /opt/kafka/bin/kafka-server-start.sh 
/opt/kafka/config/server.properties

You should see a long list of INFO messages displayed, at the end of which a message informing you that Kafka was successfully started:

[2018-12-30 08:57:45,714] INFO Kafka version : 2.1.0 (org.apache.kafka.common.utils.AppInfoParser)
[2018-12-30 08:57:45,714] INFO Kafka commitId : 809be928f1ae004e (org.apache.kafka.common.utils.AppInfoParser)
[2018-12-30 08:57:45,716] INFO [KafkaServer id=0] started (kafka.server.KafkaServer)

Congrats, you have Kafka up and running, and listening on port 9092.

Testing your Kafka server

Let’s take Kafka for a simple test run.

First, create your first topic with a single partition and one replica (we only have one Kafka server) using the following command:

/opt/kafka/bin/kafka-topics.sh --create --zookeeper localhost:2181 
--replication-factor 1  --partitions 1 --topic danielTest

You should see the following output:

Created topic "danielTest"

Using the console producer, we will now post some sample messages to our newly created Kafka topic:

/opt/kafka/bin/kafka-console-producer.sh --broker-list 
localhost:9092 --topic danielTest

In the prompt, enter some messages for the topic:

>This is just a test
>Typing a message
>OK

In a separate tab, we will now run the Kafka consumer command to read data from Kafka and display the messages we submitted to the topic to stdout

/opt/kafka/bin/kafka-console-consumer.sh --bootstrap-server 
localhost:9092 --topic danielTest --from-beginning

You should see the very same messages you submitted to the topic displayed:

This is just a test
Typing a message
OK

Installing the ELK Stack

Now that we have made sure are publish/subscribe mechanism is up, let’s install the components for logging it — Elasticsearch, Kibana and Filebeat.

Start by downloading and installing the Elastic public signing key:

wget -qO - https://artifacts.elastic.co/GPG-KEY-elasticsearch | sudo 
apt-key add -

Add the repository definition:

echo "deb https://artifacts.elastic.co/packages/6.x/apt stable main" | 
sudo tee -a /etc/apt/sources.list.d/elastic-6.x.list

Update the system, and install Elasticsearch:

sudo apt-get update && sudo apt-get install elasticsearch

Run Elasticsearch using:

sudo service elasticsearch start

You can make sure Elasticsearch is running using the following cURL:

curl "http://localhost:9200"

You should be seeing an output similar to this:

{
  "name" : "6YVkfM0",
  "cluster_name" : "elasticsearch",
  "cluster_uuid" : "8d8-GCYiQoOQMJdDrzugdg",
  "version" : {
    "number" : "6.5.4",
    "build_flavor" : "default",
    "build_type" : "deb",
    "build_hash" : "d2ef93d",
    "build_date" : "2018-12-17T21:17:40.758843Z",
    "build_snapshot" : false,
    "lucene_version" : "7.5.0",
    "minimum_wire_compatibility_version" : "5.6.0",
    "minimum_index_compatibility_version" : "5.0.0"
  },
  "tagline" : "You Know, for Search"
}

Next up, we’re going to install Kibana with:

sudo apt-get install kibana

Open up the Kibana configuration file at: /etc/kibana/kibana.yml, and make sure you have the following configuration defined:

server.port: 5601
elasticsearch.url: "http://localhost:9200"

And, start Kibana with:

sudo service kibana start

To install Filebeat, use:

sudo apt install filebeat

Configuring the pipeline

I will describe two methods for shipping the Kafka logs into the ELK Stack — one if you’re using Logz.io, the other for shipping them into your own ELK deployment.

Shipping into Logz.io

To ship the data into Logz.io, some tweaks are required in the Filebeat configuration file. Since our listeners handle parsing, there’s no need for using Logstash in this case.

First, you will need to download an SSL certificate to use encryption:

wget https://raw.githubusercontent.com/logzio/public-certificates/master/
COMODORSADomainValidationSecureServerCA.crt

sudo mkdir -p /etc/pki/tls/certs

sudo cp COMODORSADomainValidationSecureServerCA.crt 
/etc/pki/tls/certs/

The configuration file should look as follows:

filebeat.inputs:

- type: log
  paths:
    - /opt/kafka/logs/server.log
  fields:
    logzio_codec: plain
    token: <yourAccountToken>
    type: kafka_server
    env: dev
  fields_under_root: true
  encoding: utf-8
  ignore_older: 3h
  multiline:
    pattern: '\[[0-9]{4}-[0-9]{2}-[0-9]{2} [0-9]{2}:[0-9]{2}:[0-9]{2},[0-9]{3}\] ([A-a]lert|ALERT|[T|t]race|TRACE|[D|d]ebug|DEBUG|[N|n]otice|NOTICE|[I|i]nfo|INFO|[W|w]arn?(?:ing)?|WARN?(?:ING)?|[E|e]rr?(?:or)?|ERR?(?:OR)?|[C|c]rit?(?:ical)?|CRIT?(?:ICAL)?|[F|f]atal|FATAL|[S|s]evere|SEVERE|EMERG(?:ENCY)?|[Ee]merg(?:ency)?)'
    negate: true
    match: after

registry_file: /var/lib/filebeat/registry

output:
  logstash:
    hosts: ["listener.logz.io:5015"]  
    ssl:
      certificate_authorities: ['/etc/pki/tls/certs/COMODORSADomainValidationSecureServerCA.crt']

processors:
  - add_host_metadata: ~
  - add_cloud_metadata: ~

A few notes about the configuration:

  • Your Logz.io account token can be retrieved from the General settings page in Logz.io (click the cogwheel at the top-right corner).
  • Be sure to use kafka_server as the log type to apply automatic parsing.
  • I recommend verifying the YAML before starting Filebeat. You can use this online tool. Or, you can use the Filebeat wizard to generate the YAML file automatically (available in the Filebeat section, under Log Shipping in the UI).

Save the file and start Filebeat with:

sudo service filebeat start

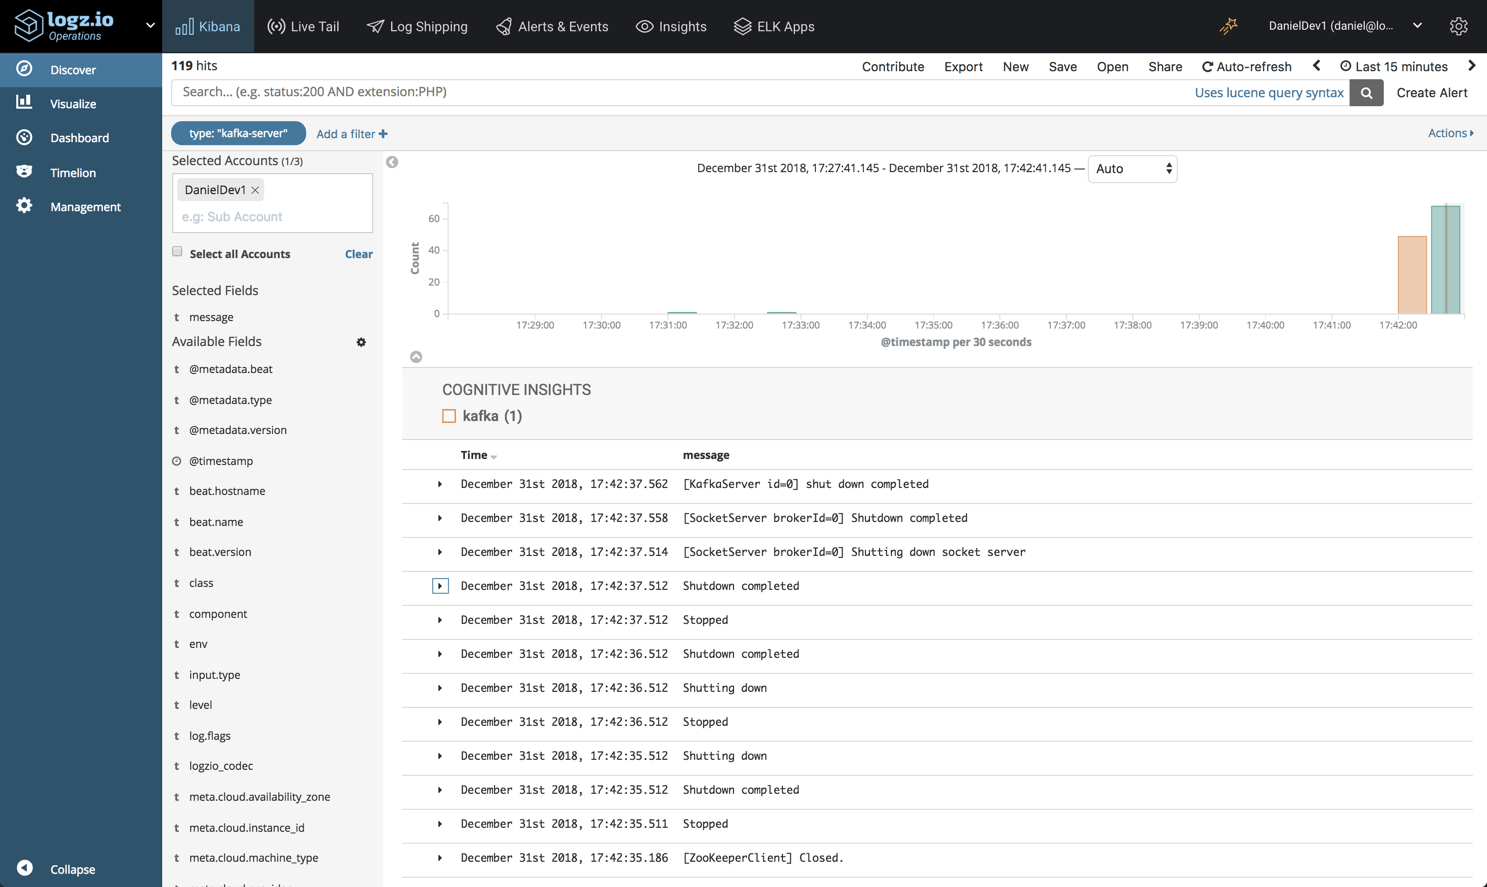
You should begin to see your Kafka server logs appearing in Logz.io after a minute or two:

Kafka server

Shipping Into ELK

To ship Kafka server logs into your own ELK, you can use the Kafka Filebeat module. The module collects the data, parses it and defines the Elasticsearch index pattern in Kibana.

To use the module, first define the path to the log files:

sudo vim /etc/filebeat/modules.d/kafka.yml.disabled

- module: kafka
   log:
    enabled: true
    #var.kafka_home:
    var.paths:
      - "/opt/kafka/logs/server.log"

Enable the module and set up the environment with:

sudo filebeat modules enable kafka
sudo filebeat setup -e

Last but not least, restart Filebeat with:

sudo service filebeat restart

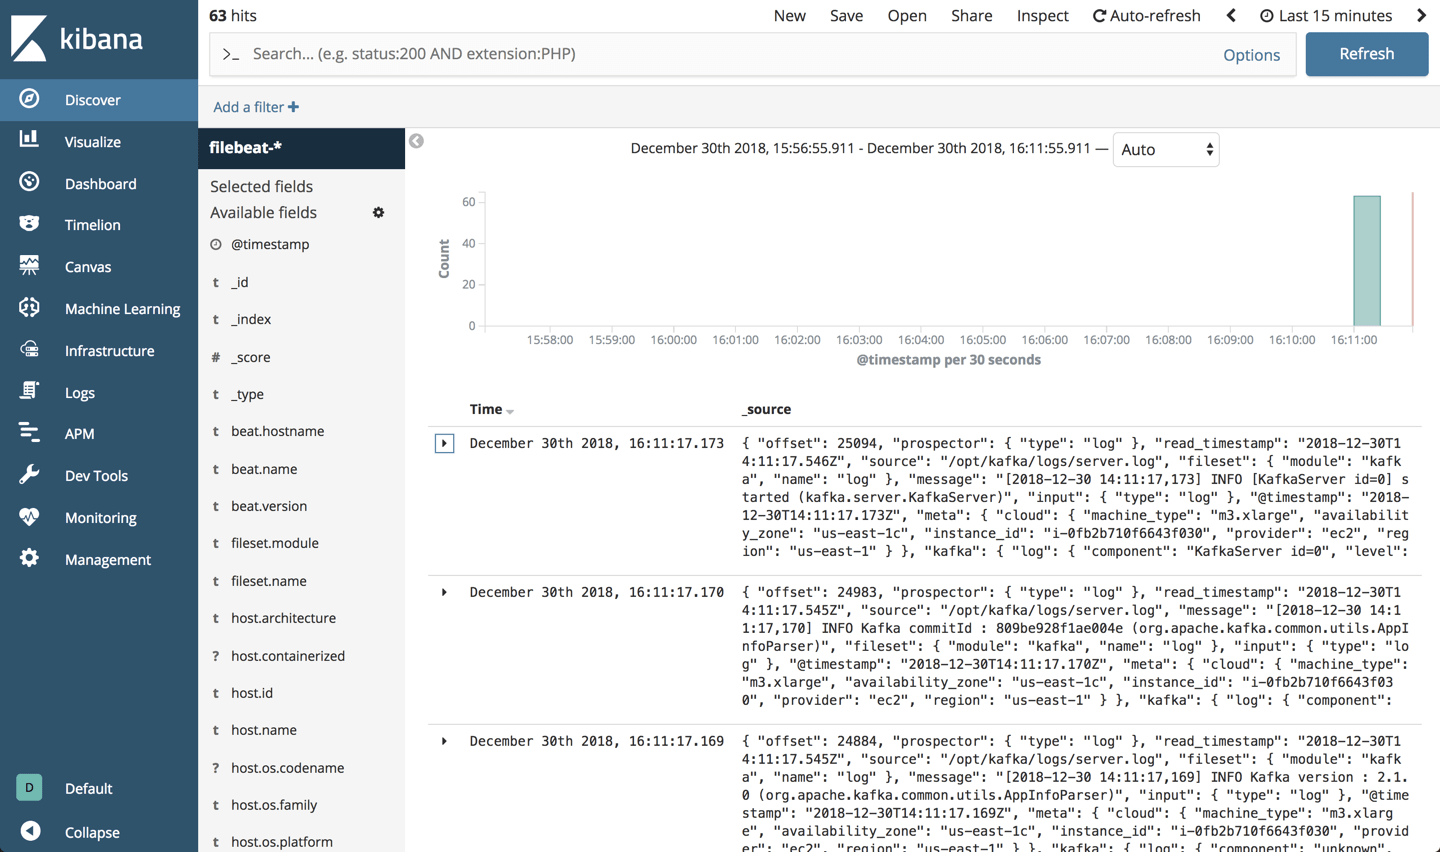
After a minute or two, opening Kibana you will find that a “filebeat-*” index is defined and Kafka server logs are displayed on the Discover page:

discover

Analyzing the data

So – what are we looking for? What can be done with the Kafka server logs?

The parsing applied to the logs parses out some important fields — specifically, the log level and the Kafka class and log component generating the log. We can use these fields to monitor and troubleshoot Kafka in a variety of ways.

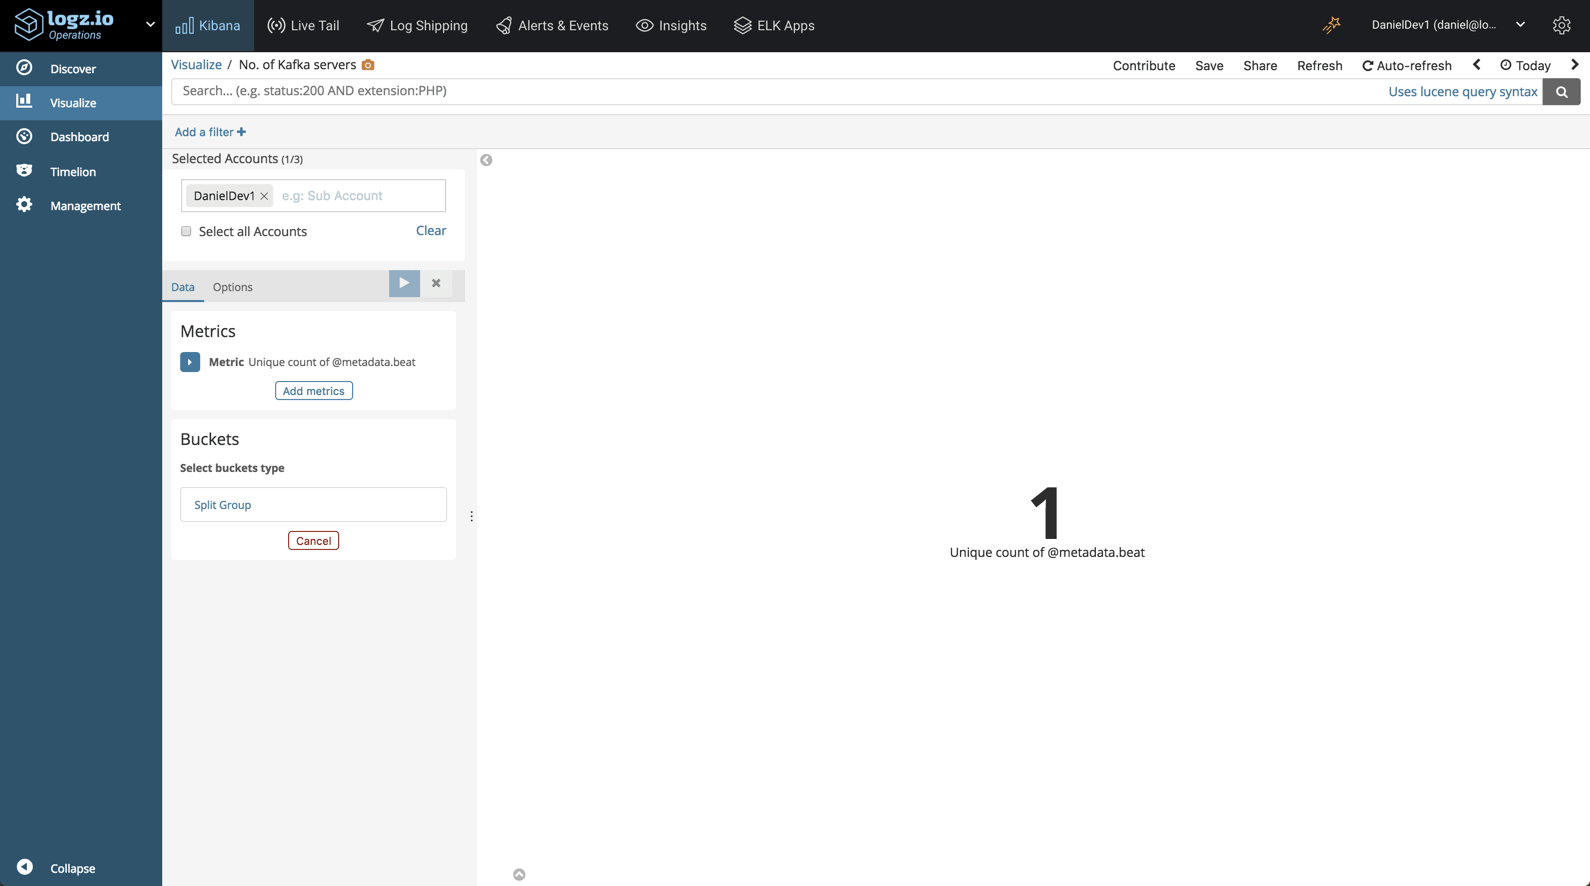
For example, we could create a simple visualization to display how many Kafka servers we’re running:

1

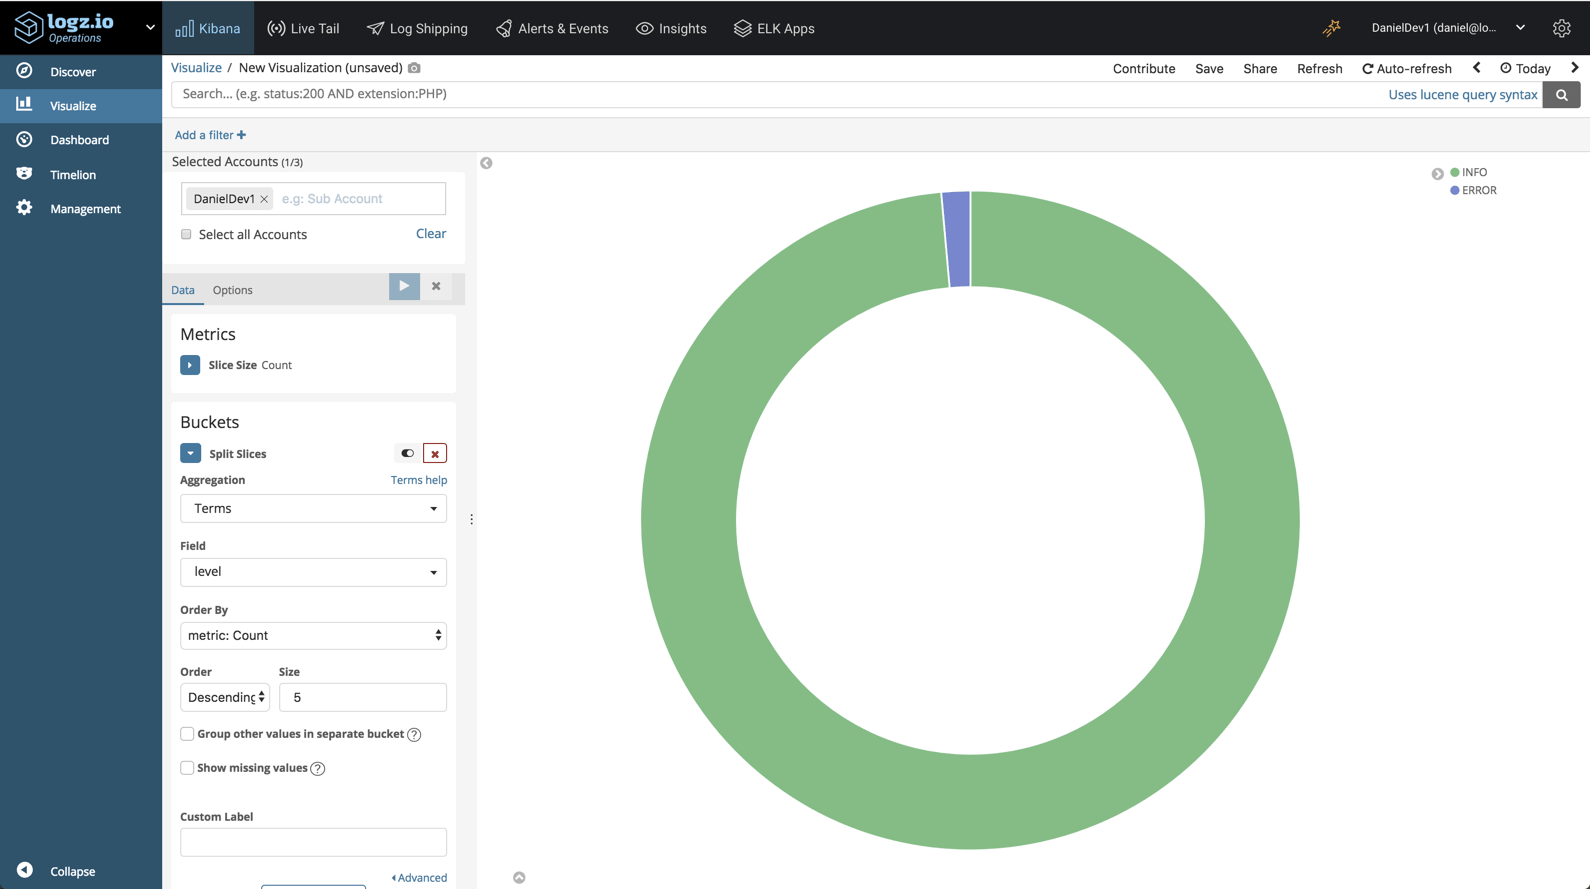
Or we could create a visualization giving us a breakdown of the different logs, by level:

circle

Likewise, we could create a visualization showing a breakdown of the more verbose Kafka components:

bar

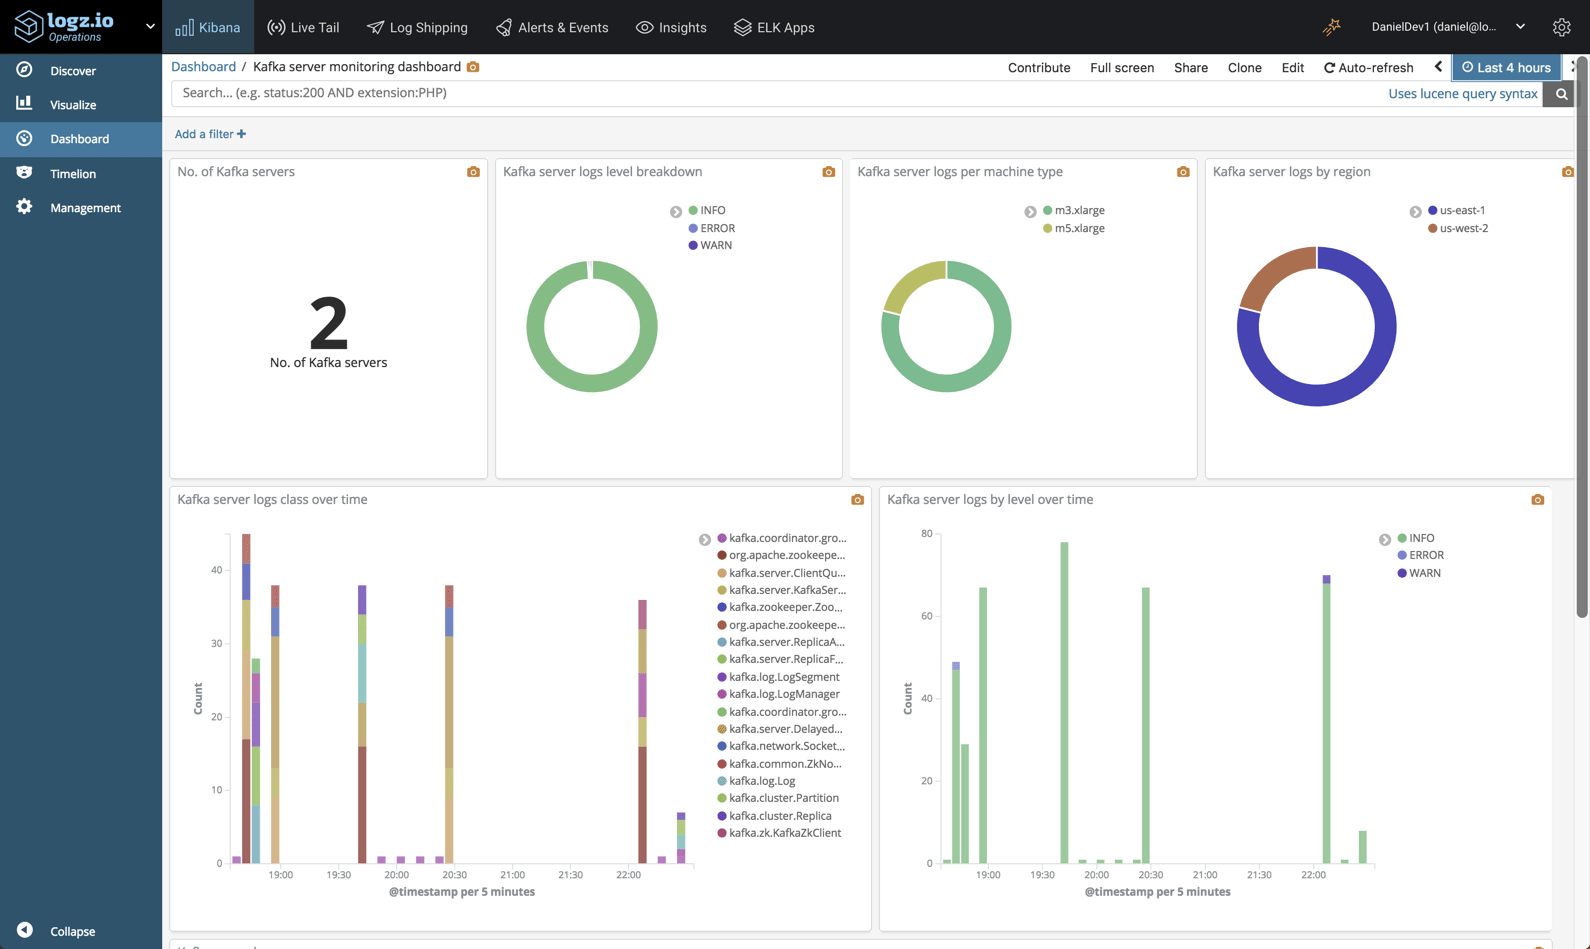
Eventually, you’d put these visualizations, and others, into one dashboard for monitoring your Kafka instances:

dashboard

Getting some help from AI

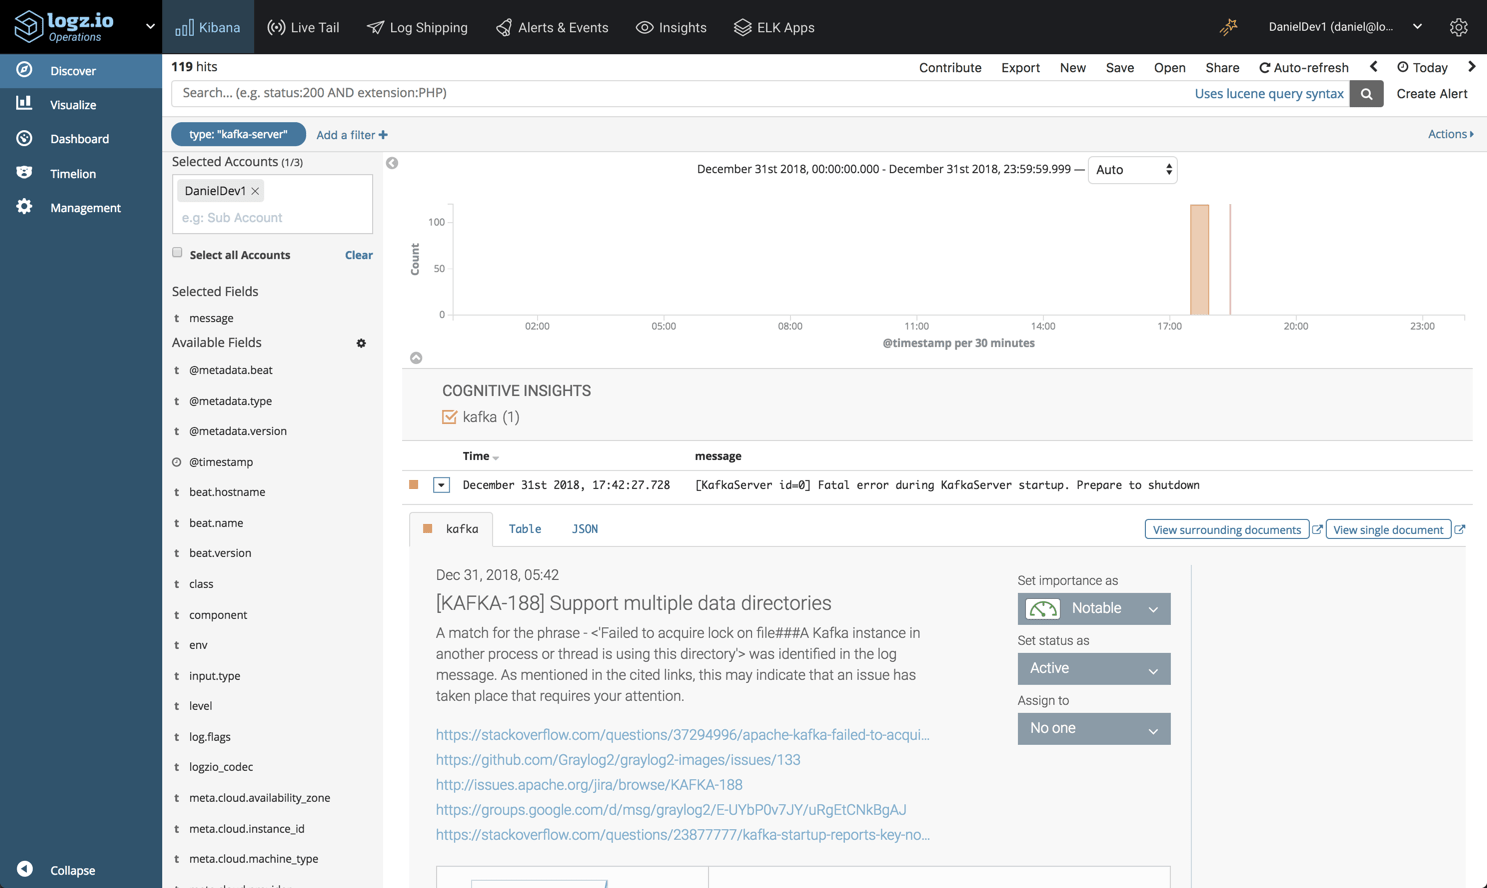
For the sake of demonstration I’ve only set up one Kafla server, but we can see the logs are already starting to pile up. Finding the needle in the haystack is one of the biggest challenges Kafka operators face, and for that reason, Logz.io’s Cognitive Insights can come in handy.

Cognitive Insights combines machine learning and crowdsourcing to correlate between log data and discussions in technical forums on the web. As a result of this correlation, critical events that may have gone unnoticed are flagged and marked for us in Kibana.

As seen in the example below, an error log was identified by Cognitive Insights, and opening it reveals some additional information on how to troubleshoot it, including links to the technical forums where it was discussed.

cognitive insights

Endnotes

Just like any other component in your stack, Kafka should be logged and monitored. At Logz.io, we use a multi-tiered monitoring system that includes metrics and logs for making sure our data pipelines are functioning as expected.

As mentioned already, Kafka server logs are only one type of logs that Kafka generates, so you might want to explore shipping the other types into ELK for analysis. Either way, ELK is a powerful analysis tool to have on your side in times of trouble.

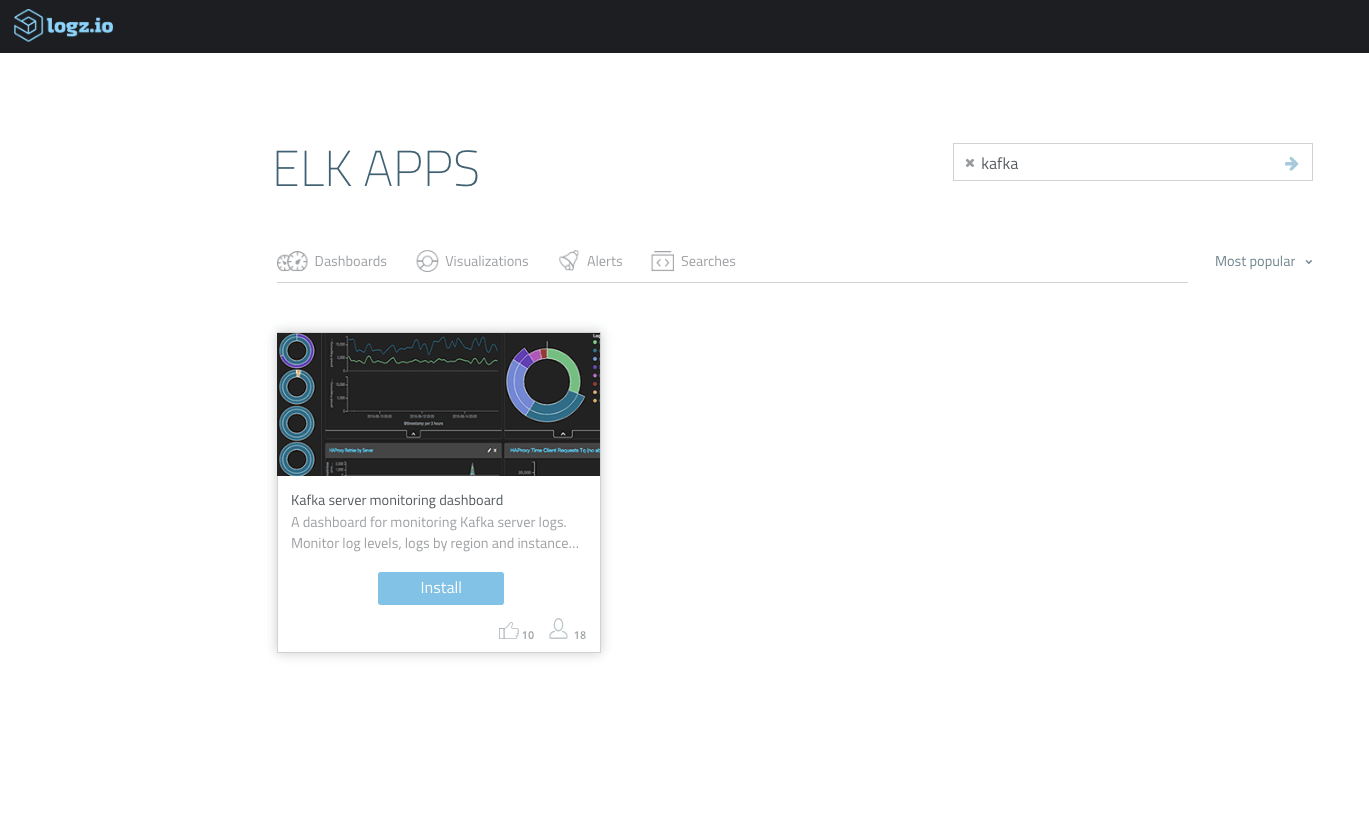
The dashboard above is available for use in ELK Apps — Logz.io’s library of dashboards and visualizations. To deploy it, simply open ELK Apps and search for “Kafka”.

ELK Apps

Easily monitor your Kafka instances with Logz.io's ELK Apps.

Server Monitoring with Logz.io and the ELK Stack

$
0
0

In a previous article, we explained the importance of monitoring the performance of your servers. Keeping tabs on metrics such as CPU, memory, disk usage, uptime, network traffic and swap usage will help you gauge the general health of your environment as well as provide the context you need to troubleshoot and solve production issues.

In the past, command line tools such as top, htop or nstat might have been enough but in today’s modern IT environments, a more centralized approach for monitoring must be implemented.

There are a variety of open source daemons that can be used for monitoring servers, such as StatsD and collectd, but these only handle the process of collection. These need to be complemented by solutions that can store the metrics and provide the tools to analyze them. That’s where the ELK stack comes into the picture — providing a complete platform for collecting, storing and analyzing server metrics.

In this article, we’ll explain how to use both Logz.io and vanilla ELK to ship server metrics using Metricbeat. We’ll look into how to set up the pipeline and build a monitoring dashboard in Kibana (to follow the steps described below, you’ll need either a Logz.io account or your own ELK Stack setup).  

What is Metricbeat?

As its name implies, Metricbeat collects a variety of metrics from your server (i.e. operating system and services) and ships them to an output destination of your choice. These destinations can be ELK components such as Elasticsearch or Logstash, or other data processing platforms such as Redis or Kafka.  

Metricbeat is installed on the different servers in your environment and used for monitoring their performance, as well as that of different external services running on them. For example, you can use Metricbeat to monitor and analyze system CPU, memory and load. In Dockerized environments, Metricbeat can be installed on a host for monitoring container performance metrics.

Installing Metricbeat

There are various ways of installing Metricbeat, but for the sake of this article we’ll be installing it from Elastic’s repositories.

First, we’ll download and install Elastic’s public signing key:

wget -qO - https://artifacts.elastic.co/GPG-KEY-elasticsearch | sudo apt-key
add -

Next, we’ll save the repository definition to ‘/etc/apt/sources.list.d/elastic-6.x.list’:

echo "deb https://artifacts.elastic.co/packages/6.x/apt stable main" | sudo 
tee -a /etc/apt/sources.list.d/elastic-6.x.list

We’ll update the system and install Metricbeat with:

sudo apt-get update && sudo apt-get install metricbeat

Configuring Metricbeat

As mentioned above, Metricbeat can track metrics for different applications installed on our servers as well as the host machine itself.

These configurations are applied using modules. You can see a list of the enabled and disabled modules in /etc/metricbeat/modules.d:

ls /etc/metricbeat/modules.d/

12                          haproxy.yml.disabled     nginx.yml.disabled
aerospike.yml.disabled      http.yml.disabled        php_fpm.yml.disabled
apache.yml.disabled         jolokia.yml.disabled     postgresql.yml.disabled
ceph.yml.disabled           kafka.yml.disabled       prometheus.yml.disabled
couchbase.yml.disabled      kibana.yml.disabled      rabbitmq.yml.disabled
docker.yml.disabled         kubernetes.yml.disabled  redis.yml.disabled
dropwizard.yml.disabled     kvm.yml.disabled         system.yml
elasticsearch.yml.disabled  logstash.yml.disabled    traefik.yml.disabled
envoyproxy.yml.disabled     memcached.yml.disabled   uwsgi.yml.disabled
etcd.yml.disabled           mongodb.yml.disabled     vsphere.yml.disabled
golang.yml.disabled         munin.yml.disabled       windows.yml.disabled
graphite.yml.disabled       mysql.yml.disabled       zookeeper.yml.disabled

Within each module, different metricsets can be used to ship different sets of metrics. In the case of the system module, the default metricsets are cpu, load, memory, network, process and process_summary.

To ship additional metricsets, such as socket or uptime, simply edit the system module and specify the desired metricsets you want to ship:

sudo vim /etc/metricbeat/modules.d/system.yml

- module: system
  period: 10s
  metricsets:
    - cpu
    - load
    - memory
    - network
    - process
    - process_summary
    - core
    - diskio
    - socket

enabled: true
  period: 10s
  processes: ['.*']

Save the file.

The only other configuration that you need to worry about at this stage is where to ship the metrics to. This is done in the Metricbeat configuration file at

/etc/metricbeat/metricbeat.yml.

Shipping to ELK

Since I’m using a locally installed Elasticsearch, the default configurations will do me just fine. If you’re using a remotely installed Elasticsearch, make sure you update the IP address and port.

output.elasticsearch:
  hosts: ["localhost:9200"]

If you’d like to output to another destination, that’s fine. You can ship to multiple destinations or comment out the Elasticsearch output configuration to add an alternative output. One such option is Logstash, which can be used to execute additional manipulations on the data and as a buffering layer in front of Elasticsearch.

When done, simply start Metricbeat with:

sudo service metricbeat start

To verify all is running as expected, query Elasticsearch for created indices:

sudo curl http://localhost:9200/_cat/indices?v
health status index                 uuid                   pri rep docs.count docs.deleted store.size pri.store.size
yellow open   metricbeat-2019.02.04 gdQIYsr9QRaAw3oJQGgVTA   5   1        924            0    843.7kb        843.7kb

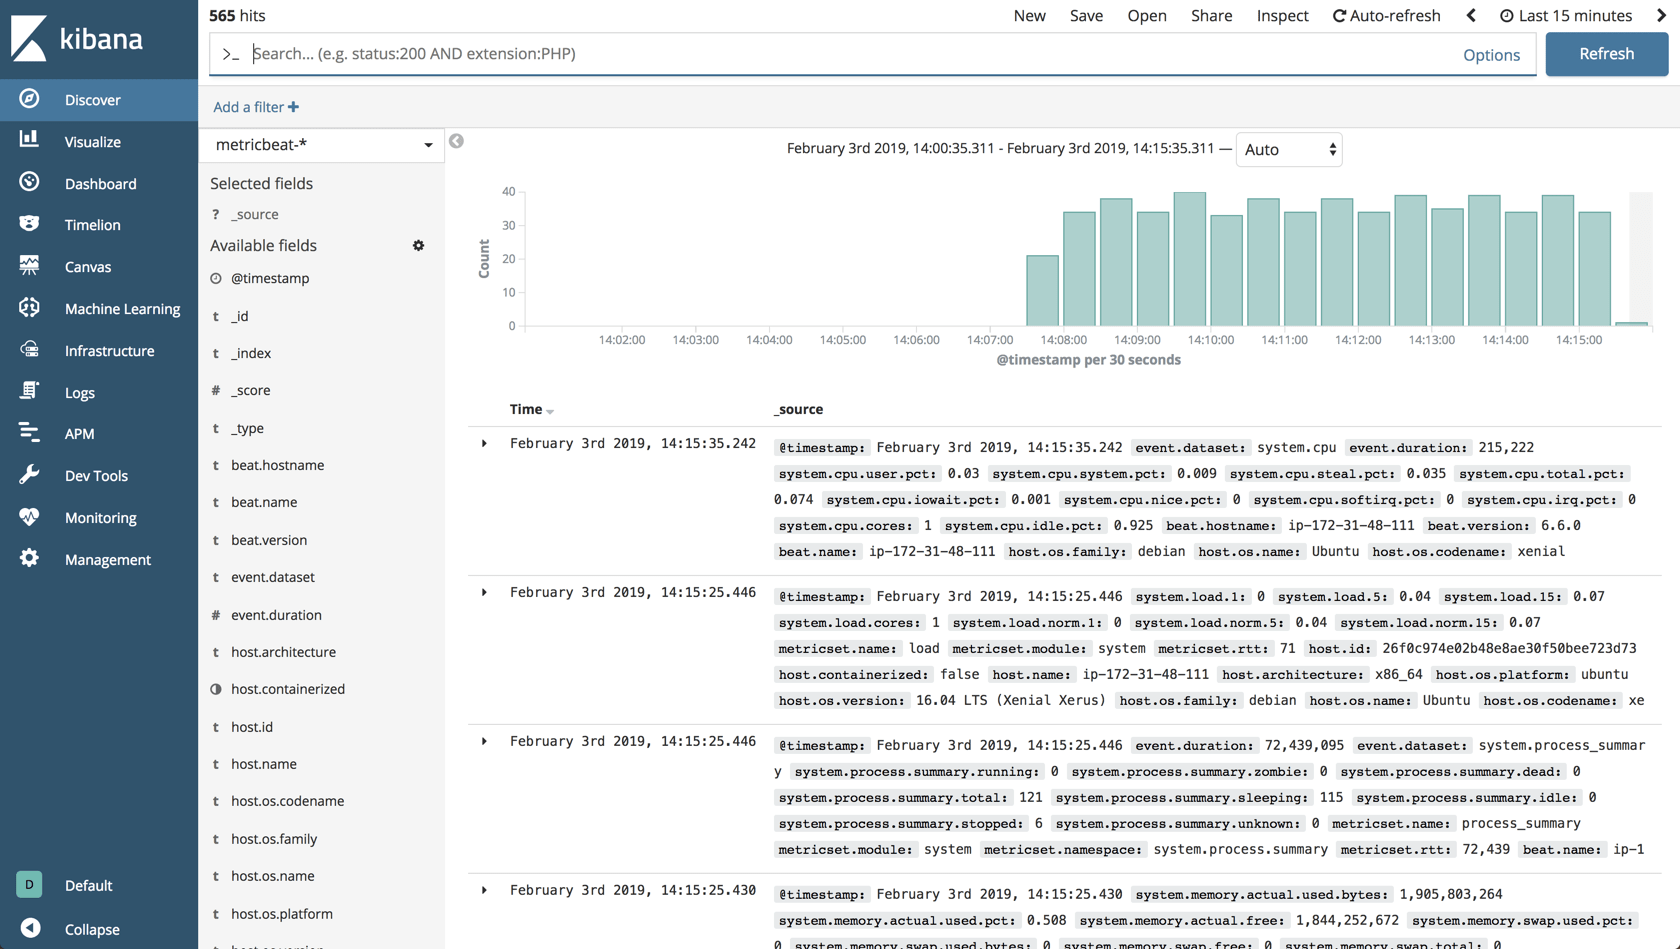
Define the index pattern in Kibana: Management → Index Patterns → Create Index Pattern, and you’ll begin to see the data on the Discover page:

discover

Shipping to Logz.io

To ship metrics to Logz.io, there are a few tweaks that need to be made to the Metricbeat configuration file.

First, download an SSL certificate for encryption:

wget https://raw.githubusercontent.com/logzio/public-certificates/master/COMODORSADomainValidationSecureServerCA.crt

sudo mkdir -p /etc/pki/tls/certs

sudo cp COMODORSADomainValidationSecureServerCA.crt /etc/pki/tls/certs/

Next, add the following configuration to the Metricbeat configuration file:

sudo vim /etc/metricbeat/metricbeat.yml

Comment out the Elasticsearch output, and enter the following configurations:

fields:
  env: dev
  logzio_codec: json
  token: <yourLogzioToken>
  type: metricbeat
fields_under_root: true
ignore_older: 3hr
encoding: utf-8

output.logstash:
  hosts: ["listener.logz.io:5015"]
  ssl:
      certificate_authorities: ['/etc/pki/tls/certs/COMODORSADomainValidationSecureServerCA.crt']

Be sure to enter your Logz.io account token in the relevant field. You can find your token in the Logz.io UI, on the General page of your settings.

Save the configuration file and start Filebeat:

sudo service metricbeat start

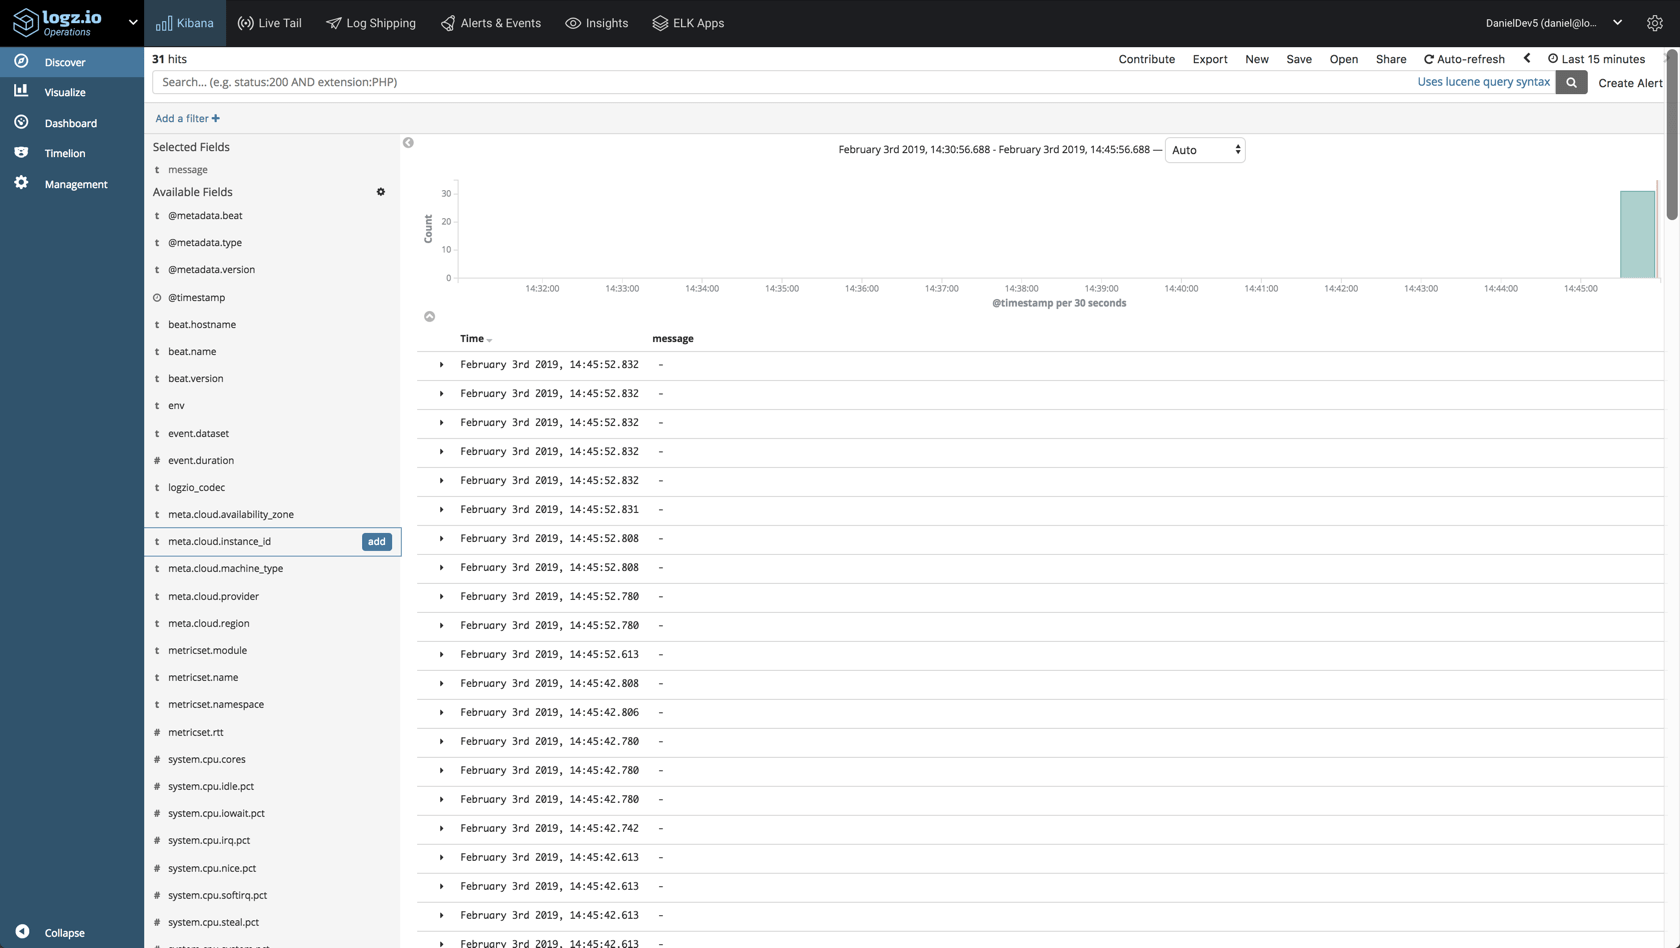
Wait a minute or two, and you will begin to see your server metrics data in Logz.io:

server metrics data

Analyzing the data in Kibana

Collecting the data is straightforward enough. In a multi-host environment, you will, of course, need to repeat the process above per server. The next step is to understand how to analyze and visualize the data and extract some insight from it.

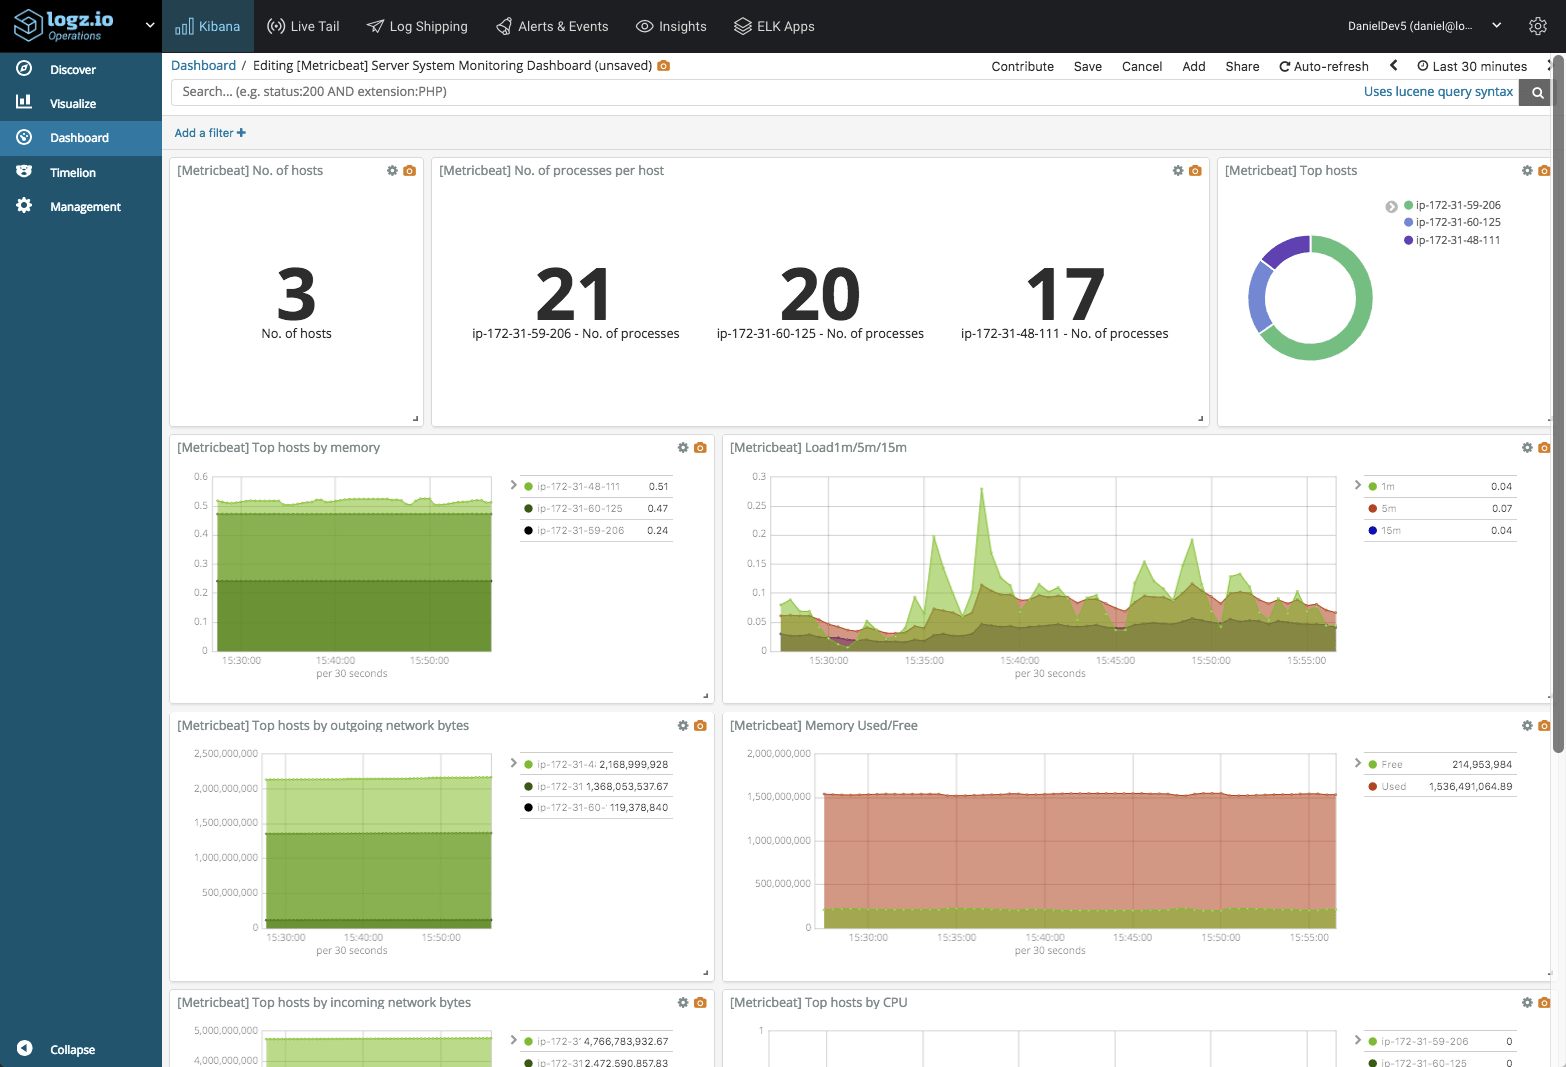
Metricbeat records a large number of metrics, and Kibana provides the tools to build some nifty visualizations to monitor them. Below are some examples of visualizations you can build based on these metrics.

No. of hosts

Let’s start with the basics. A metric visualization using a unique count aggregation of the host.beatname field will give us the number of hosts you are monitoring:

3

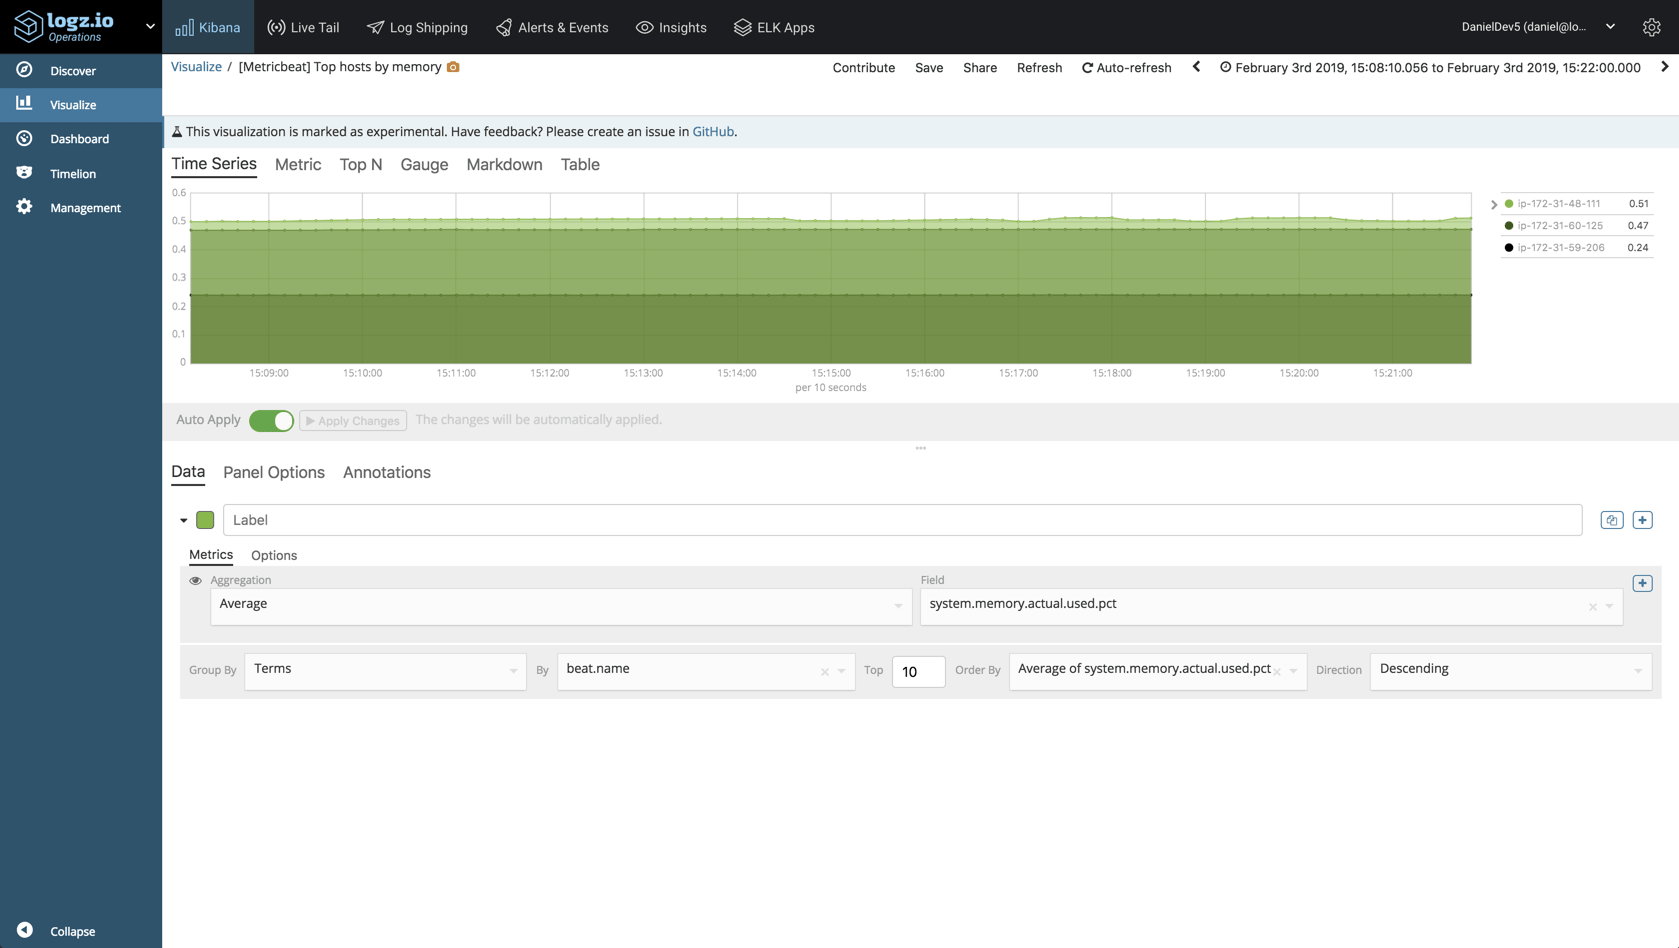
Memory used per host

A more advanced visualization will help us monitor the amount of memory used per host. To build this visualization, we will use Visual Builder, Kibana’s Grafana-like visualization tool.

We will use a simple average of the system.memory.actual.used.pct field:

memory

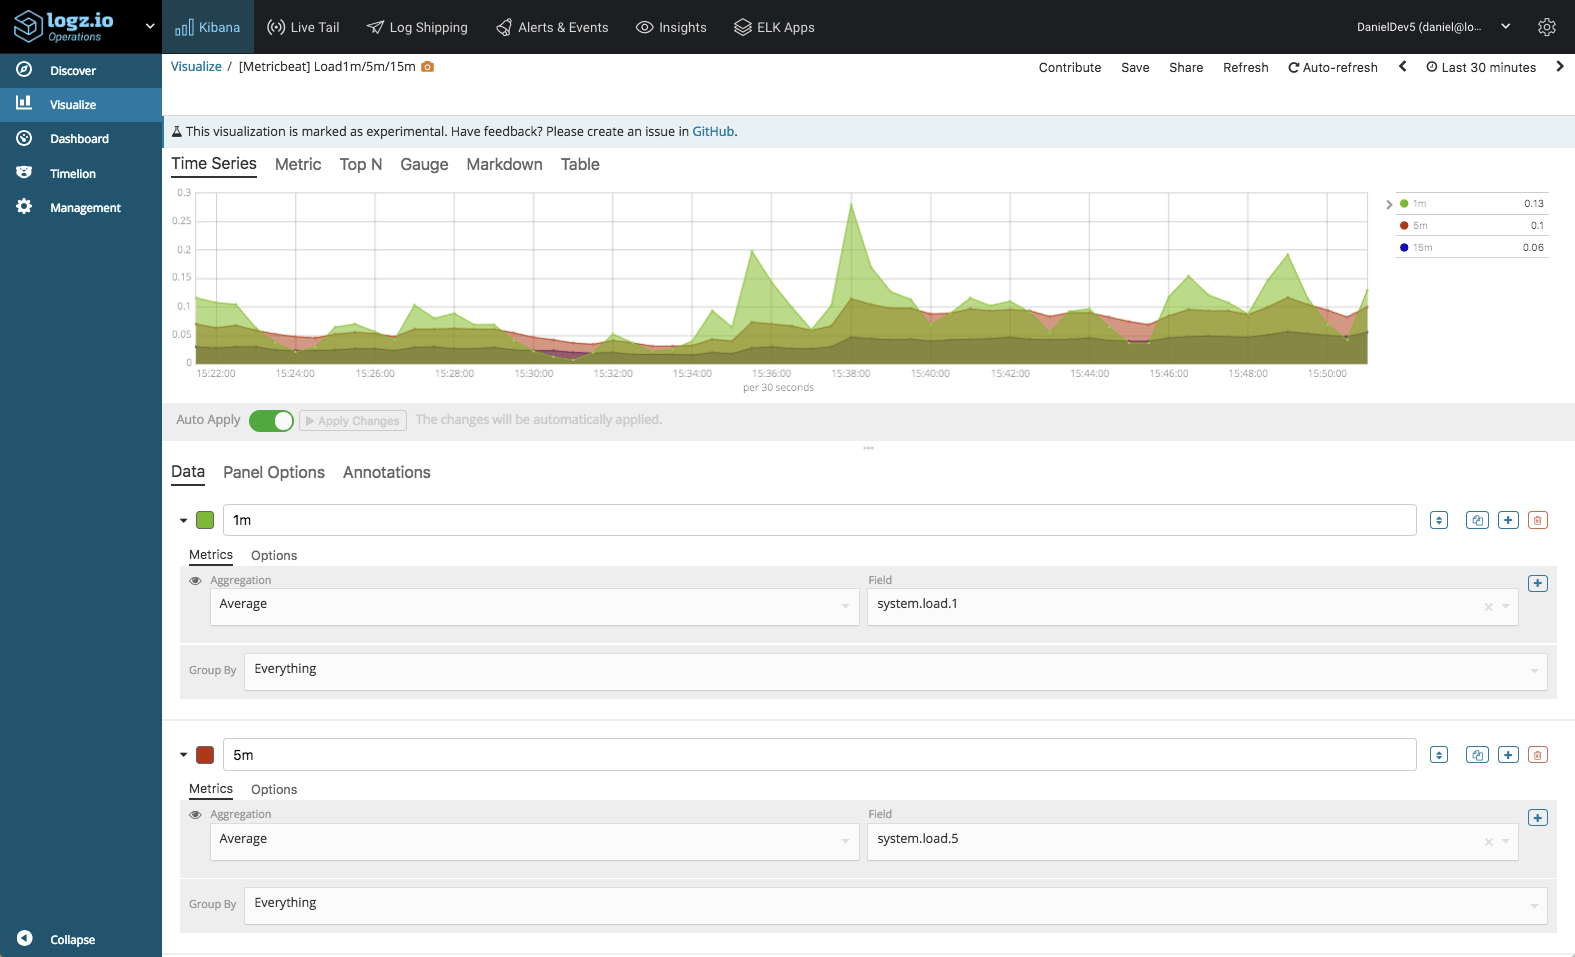
System load

We can compare various metrics as well. In the example below, we are using Visual Builder again — this time to compare system load, 1m, 5m and 15m:

visual builder

And the examples go on. There really is no limit to how you can slice and dice the data in Kibana and the best way is to experiment. Once you have all your visualizations ready, simply add them into one dashboard.

dashboard

This dashboard is available in ELK Apps — Logz.io’s library of Kibana searches, alerts, visualizations and dashboards, together with other Metricbeat dashboards. Simply search for “Metricbeat” and install any of the listed dashboards in one click.

Monitoring does not end with a dashboard

To be a bit more proactive in your monitoring, you will want to be notified when something out of the ordinary is taking place. If you’re using your own ELK deployment, you will need to add an alerting module to the stack — ElastAlert for example. If you’re a Logz.io user, you can use the built-in alerting mechanism to get alerted via Slack, PagerDuty, or any other endpoint you may have configured in the system.

Endnotes

We only touched upon one type of metrics that Metricbeat supports, but in reality, you will be collecting metrics from a much larger infrastructure and different types of servers. Whether MySQL, Apache, Kubernetes or Kafka — Metricbeat supports the collection and forwarding of a vast array of server metrics which can be used to gauge the general health of your environment.

You will most likely want to use a configuration management or automation system of sorts to simplify the process of deploying Metricbeat. You could use Ansible or Terraform, for example, but in either case, Metricbeat itself is extremely easy to configure.

To sum it up, while the ELK Stack is first and foremost a log management system, changes being made to both Elasticsearch on the backend and Kibana on the frontend, as well as the shipping agents used to collect and forward the data, are making the stack a compelling solution for metrics as well.

Check out our Metricbeat Dashboard, now available in Logz.io's ELK Apps, to make server monitoring easier than ever!

Network Security Monitoring with Suricata, Logz.io and the ELK Stack

$
0
0

Suricata is an open source threat detection system. Initially released by the Open Information Security Foundation (OISF) in 2010, Suricata can act both as an intrusion detection system (IDS), and intrusion prevention system (IPS), or be used for network security monitoring. 

Suricata can be set up as a host-based IDS to monitor the traffic of a single machine, a passive IDS to monitor all the traffic passing through the network and to notify the analyst when malicious activity is detected, or as an active, inline IDS and IPS to monitor inbound and outbound traffic.

Suricata comes with built-in security rules but can also be complemented with external rule sets. These rules generate log data, or security events, and to be able to effectively ingest, store and analyze this data requires a security analytics platform that can act as a centralized logging system for Suricata data and all the other types of data flowing in from other security layers.

In this article, we will explore the steps for installing and integrating Suricata with Logz.io and the ELK Stack. You’ll need either a Logz.io account or your own ELK deployment to follow the procedures described here.

Installing Suricata

Our first step, is to set up Suricata.

Suricata can be installed on a variety of distributions using binary packages or compiled from source files. We’ll be installing Suricata on Ubuntu 16.04, and full installation instructions are available here.

Start with installing recommended dependencies:

apt-get install libpcre3 libpcre3-dbg libpcre3-dev build-essential libpcap-dev   \
                libyaml-0-2 libyaml-dev pkg-config zlib1g zlib1g-dev \
                make libmagic-dev

Next, define the PPA for installing latest stable release:

sudo add-apt-repository ppa:oisf/suricata-stable

Update your system and install Suricata with:

sudo apt-get update
sudo apt-get install suricata

Next, we’re going to install Suricata-Update — a tool for updating and managing Suricata rules. Suricate-Update is packaged with  Suricata, so to use it simply use:

sudo suricata-update

The Emerging Threats Open ruleset is downloaded to /var/lib/suricata/rules/, and this is the command to use to update your rules.

Last but not least, start Suricata:

sudo service suricata start

Shipping Suricata data to the ELK Stack

After a minute or two, Suricata will begin to generate events in a file called ‘eve.json’ located at /var/log/suricata/eve.json.

All the data generated by Suricata, whether rule-based alerts, DNS or HTTP logs, will be sent into this file. You can configure what data is shipped into this file, define different log outpouts per data type, and more, in the Suricata configuration file (/etc/suricata/suricata.yaml).

All the log types in the ‘eve.json’ file share a common structure:

{"timestamp":"2009-11-24T21:27:09.534255","event_type":"TYPE", ...tuple... ,"TYPE":{ 
... type specific content ... }}

Our next step is to ship this data into the ELK Stack for analysis. We will outline two methods — using Filebeat to ship to Logz.io and using a combination of Filebeat and Logstash for vanila ELK deployments.

Using Logz.io

If you’re a Logz.io user, all you have to do is install Filebeat and configure it to forward the suricata_ews.log file to Logz.io. Processing and parsing will be applied automatically.

To install Filebeat, use:

wget -qO - https://artifacts.elastic.co/GPG-KEY-elasticsearch | sudo apt-key add -
sudo apt-get install apt-transport-https

echo "deb https://artifacts.elastic.co/packages/6.x/apt stable main" | sudo tee -a 
/etc/apt/sources.list.d/elastic-6.x.list

sudo apt-get update && sudo apt-get install filebeat

Before configuring Filebeat, download an SSL certificate for encryption:

wget 
https://raw.githubusercontent.com/logzio/public-certificates/master/COMODORSADomainValidationSecureServerCA.crt

sudo mkdir -p /etc/pki/tls/certs

sudo cp COMODORSADomainValidationSecureServerCA.crt /etc/pki/tls/certs/

Next, open up the Filebeat configuration file at /etc/filebeat/filebeat.yml, and enter the following configuration:

filebeat.inputs:

- type: log
  paths:
    - /var/log/suricata/eve.json
  fields:
    logzio_codec: json
    token: <yourLogzioToken>
    type: suricata
  fields_under_root: true
  encoding: utf-8
  ignore_older: 3h

registry_file: /var/lib/filebeat/registry

output:
  logstash:
    hosts: ["listener.logz.io:5015"]  
    ssl:
      certificate_authorities: ['/etc/pki/tls/certs/COMODORSADomainValidationSecureServerCA.crt']

Be sure to enter your Logz.io account token in the relevant field. You can find your token in the Logz.io UI, on the General page of your settings.

Save the configuration file and start Filebeat:

sudo service filebeat start

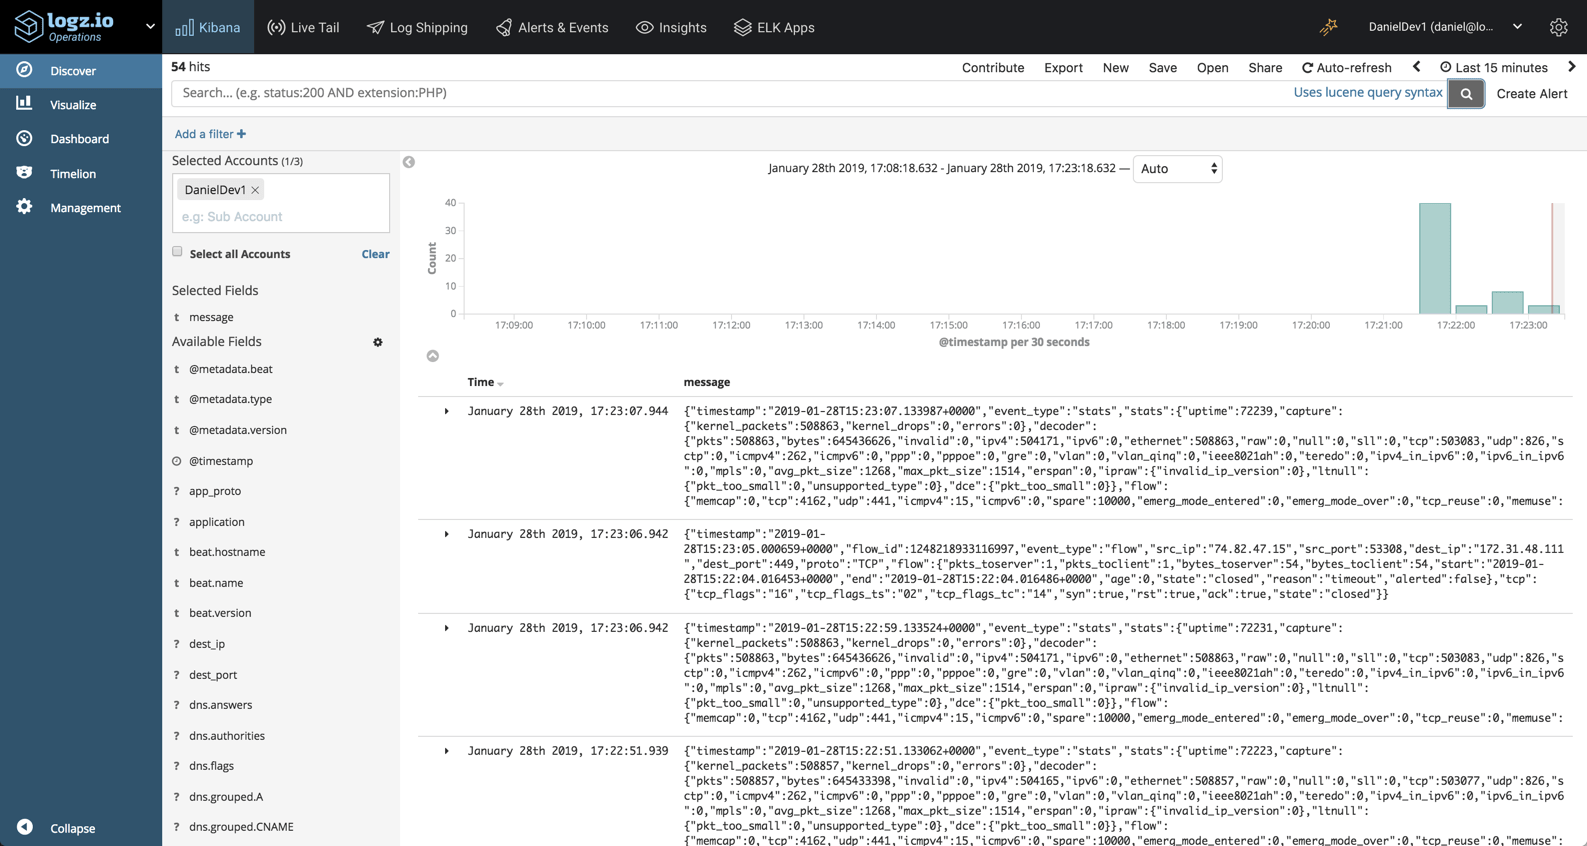
Wait a minute or two, you will begin to see the Suricata data in Logz.io:

Suricata data

Using Logstash

If you’re using your own ELK deployment you will want to add Logstash into the pipeline for processing the data.

First though, our Filebeat configuration file will look as follows:

filebeat:
 prospectors:
  - input_type: log
    paths:
     - "/var/log/suricata/eve.json"
    json.keys_under_root: true
    json.overwrite_keys: true
    fields:
      application: suricata

output:
 logstash:
  # The Logstash hosts
   hosts: ["localhost:5044"]

Next up, Logstash. This is a critical step in the process as we need to ensure the Suricata logs are broken up properly for easier analysis.

Since we will be using the geoip filter plugin, we need to first install it:

cd /usr/share/logstash
sudo bin/logstash-plugin install logstash-filter-geoip

Create a configuration file:

sudo vim /etc/logstash/conf.d/suricata.conf

The configuration defines beats as the input, Elasticsearch as the output and uses a variety of filter plugins to process the logs:

input {
  beats { 
    port => 5044
    codec => "json_lines"
  }
}

filter {
  if [application] == "suricata" {
    date {
      match => [ "timestamp", "ISO8601" ]
    }
    ruby {
      code => "if event['event_type'] == 'fileinfo'; event['fileinfo']['type']=event['fileinfo']['magic'].to_s.split(',')[0]; end;" 
    }
  }

  if [src_ip]  {
    geoip {
      source => "src_ip" 
      target => "geoip" 
      add_field => [ "[geoip][coordinates]", "%{[geoip][longitude]}" ]
      add_field => [ "[geoip][coordinates]", "%{[geoip][latitude]}"  ]
    }
    mutate {
      convert => [ "[geoip][coordinates]", "float" ]
    }
    if ![geoip.ip] {
      if [dest_ip]  {
        geoip {
          source => "dest_ip" 
          target => "geoip" 
          add_field => [ "[geoip][coordinates]", "%{[geoip][longitude]}" ]
          add_field => [ "[geoip][coordinates]", "%{[geoip][latitude]}"  ]
        }
        mutate {
          convert => [ "[geoip][coordinates]", "float" ]
        }
      }
    }
  }
}

output { 
  elasticsearch {
    hosts => ["localhost:9200"]
  }
}

Start Logstash and Filebeat with:

sudo service logstash start
sudo service filebeat start

Within a minute or two, you should see a new Logstash index created in Elasticsearch:

curl -X GET "localhost:9200/_cat/indices?v"

health status index                     uuid                   pri rep docs.count docs.deleted store.size pri.store.size
green  open   .kibana_1                 Eb79G5FESxiadHz8WCoE9w   1   0        178            8    280.3kb        280.3kb
yellow open   logstash-2019.01.28       _53z4wLXSLiiW5v-OMSqRg   5   1       1157            0      2.3mb          2.3mb

In Kibana, you can then define the new index pattern to start your analysis:

define index pattern

Analyzing the data

So – what are we looking for? What can be done with Suricata logs?

The parsing applied to the logs parses out some important fields which we can use for monitoring our network for suspicious behavior.  Below are a few examples of visualizations that can be built in Kibana for detecting malicious activity.

Suricata Alerts

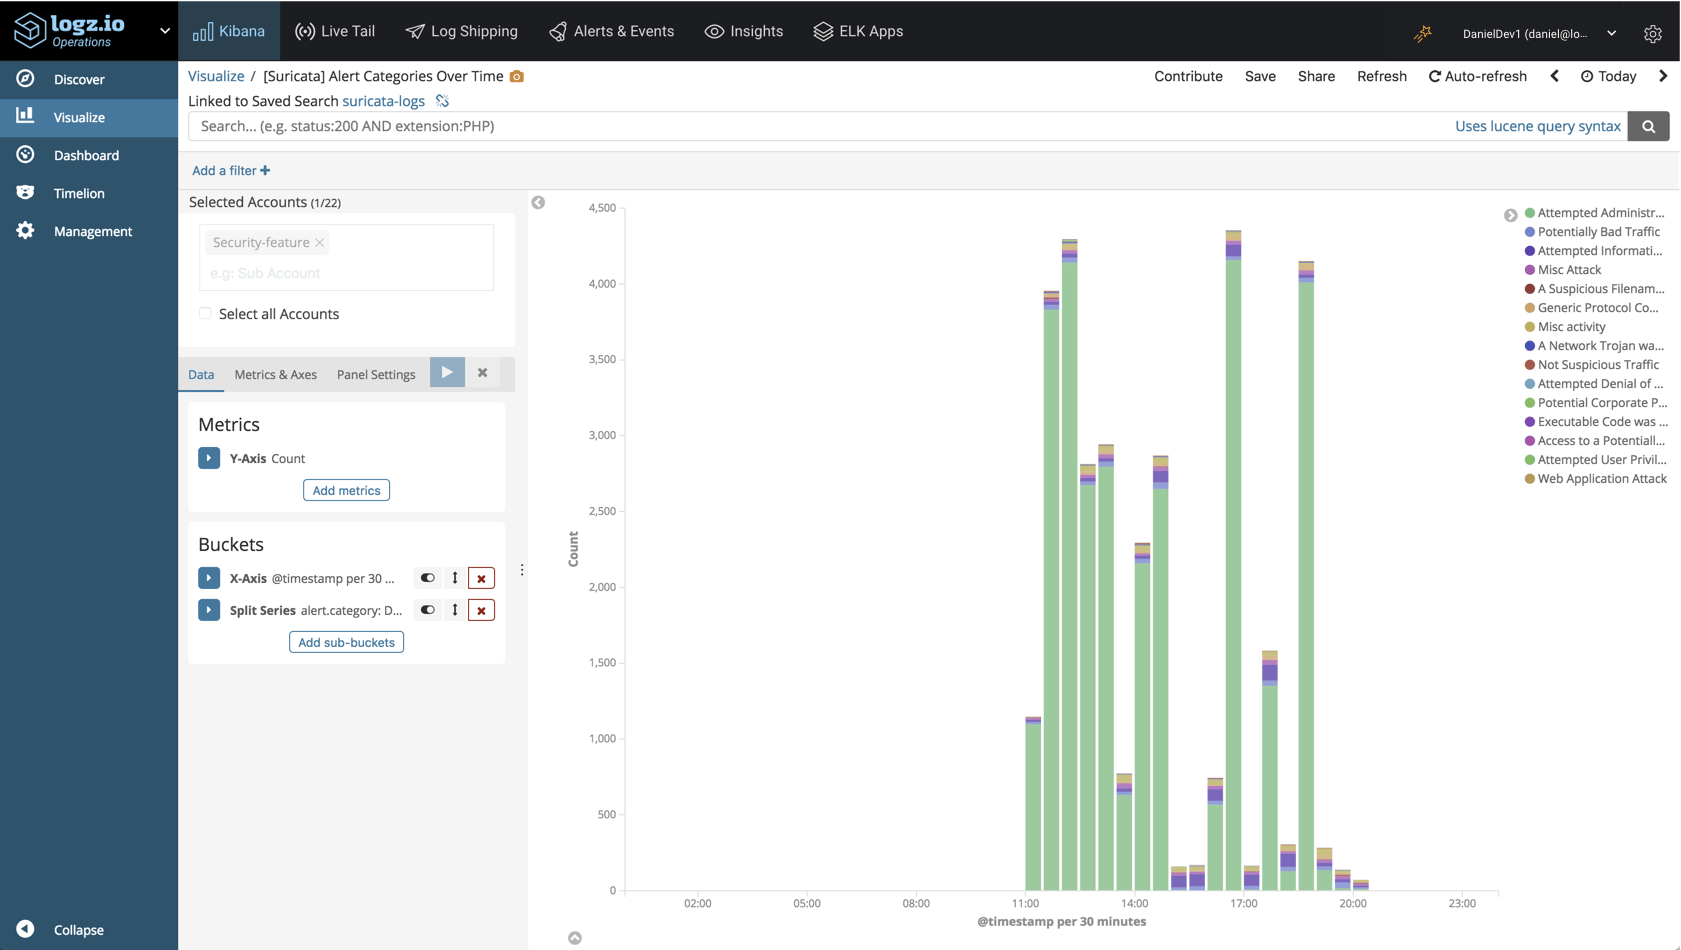
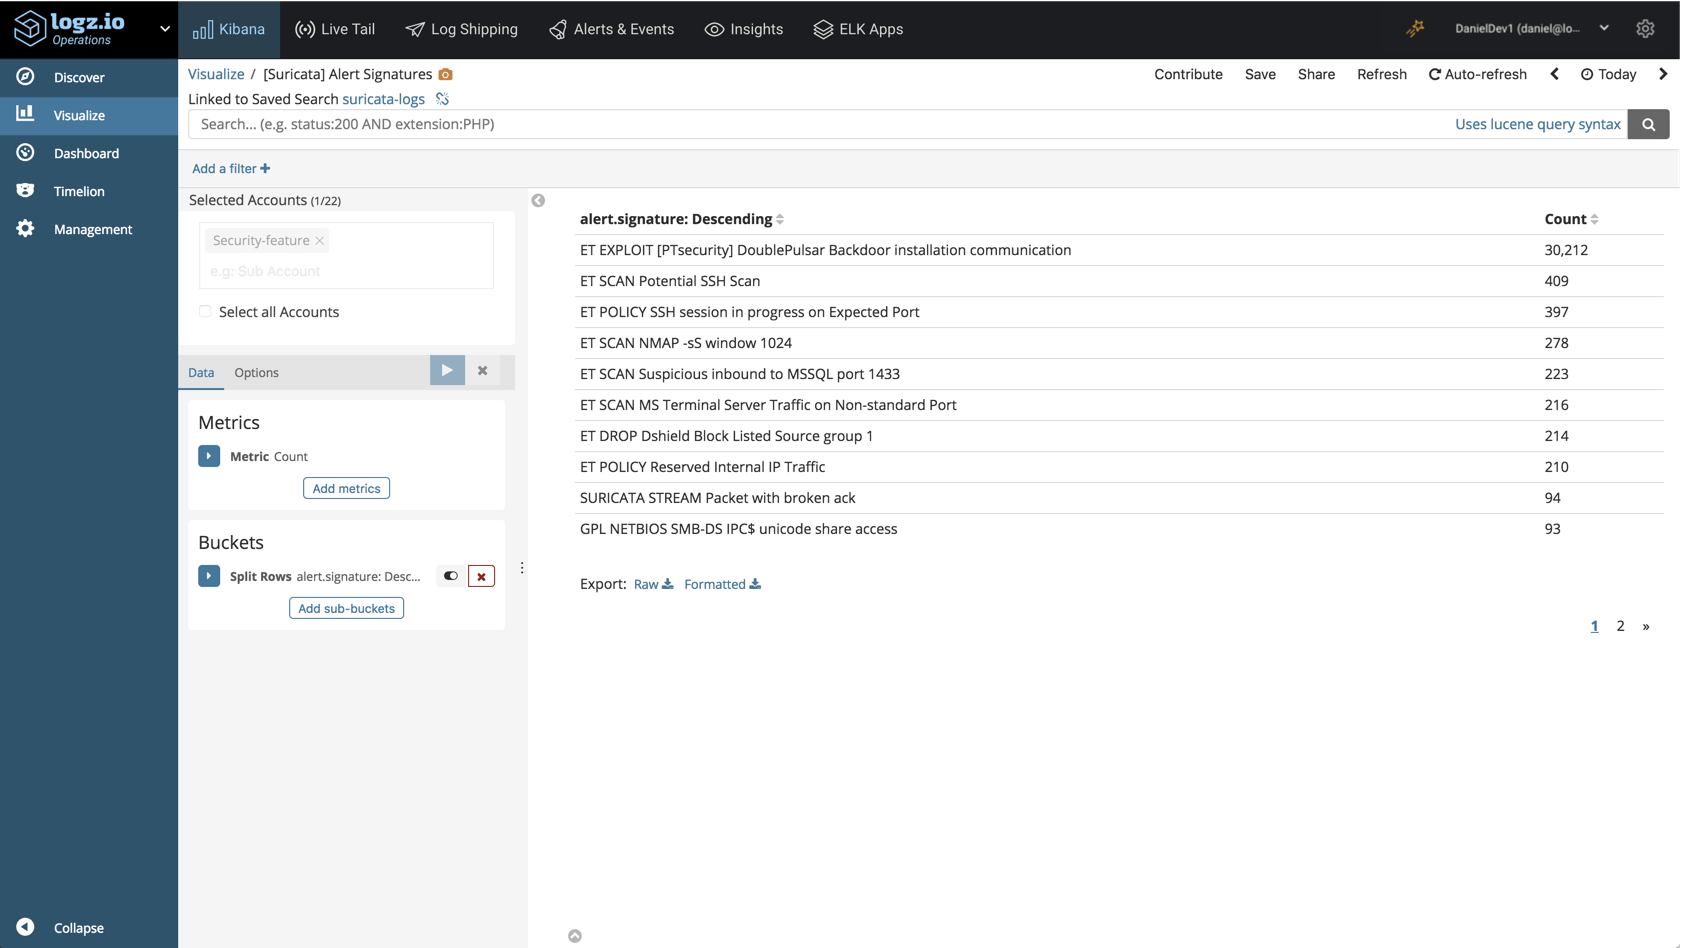
Suricata rules (/etc/suricata/rules) will trigger alerts and send logs to Logz.io should the conditions defined in those rules be met. To understand what the actual rules mean, I would recommend you refer to Suricata docs.  

In the bar chart below, we are monitoring the different alert categories Suricata is logging over time:

bar

To monitor alert signatures, we could build a Data Table visualization:

alert signature

Traffic Geographic Distribution

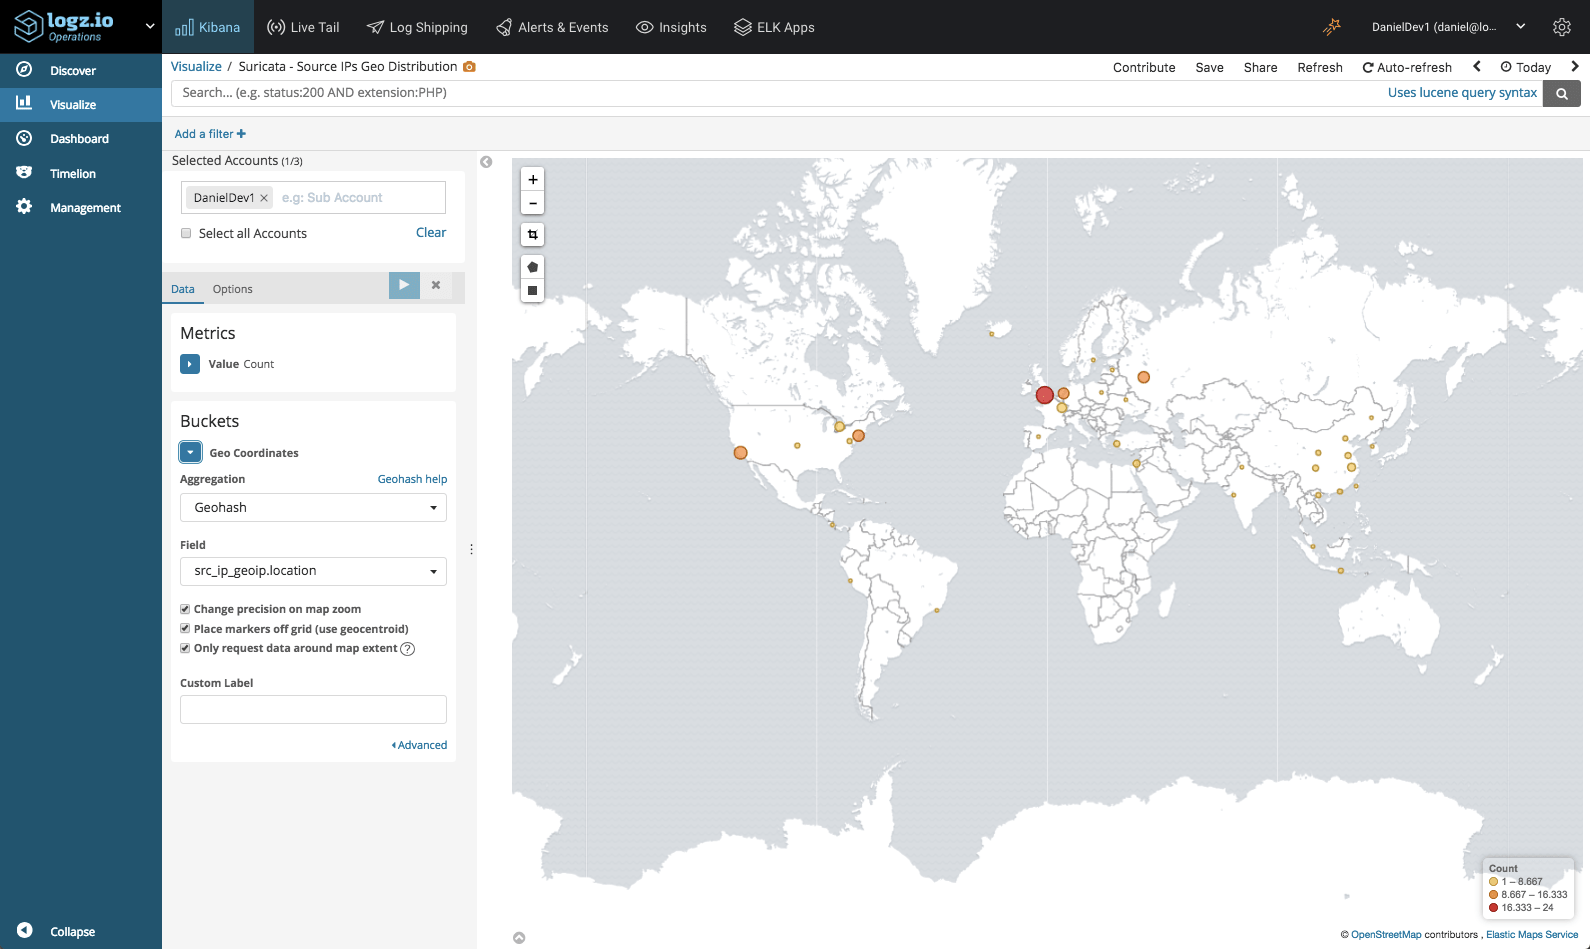
We can monitor the geographical distribution of traffic coming into our system using Kibana’s Coordinate Map visualization. To do this we will make use of the geo enhancement applied to the src_ip field in Suricata logs.

map

Suricata Event Types

The event_type field indicates the Suricata log type. With the help of a pie chart visualization, we can see a breakdown of the top log types recorded in the system:

pie

Line chart visualizations are great to monitor trends over time. In the visualization below, we’re looking at the top Suricata log types over time:

line

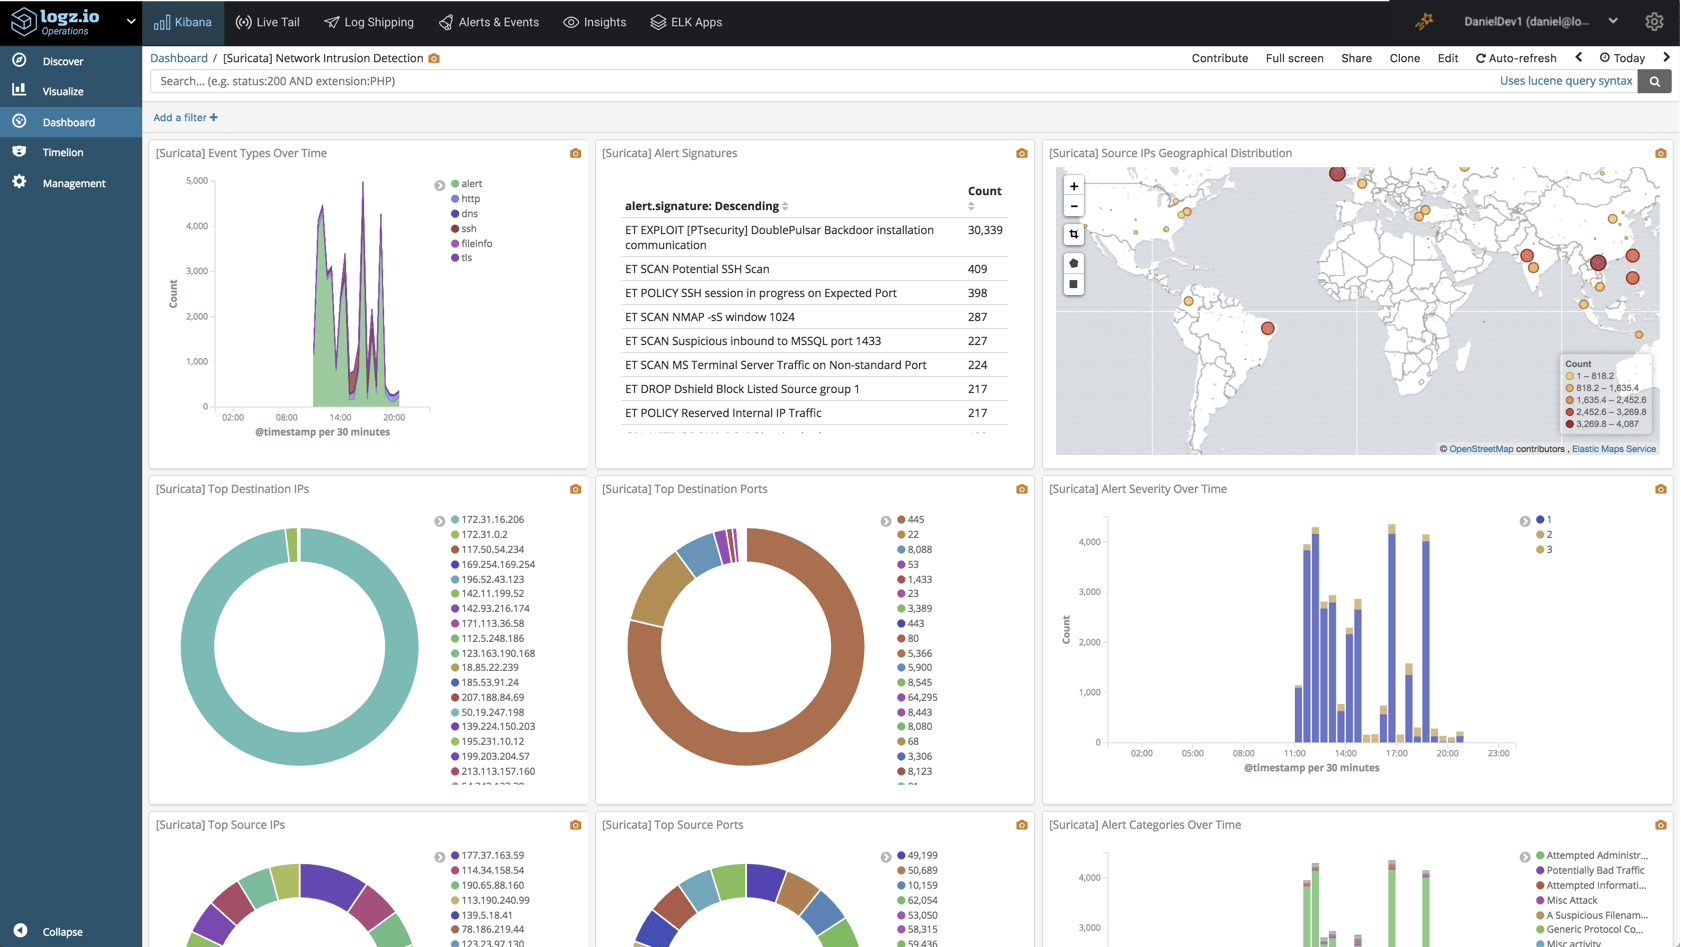
Once you’ve got all your visualizations lined up, you can add them into one comprehensive dashboard:

dashboard

This dashboard is available in ELK Apps — Logz.io’s library of Kibana searches, alerts, visualizations and dashboards, together with other Suricata dashboards. Simply search for “Suricata” and install any of the listed dashboards in one click.

Endnotes

Suricata is a great open source option for monitoring your network for malicious activity. Still, it is just one layer in what must be a more comprehensive system deployed, rather than a complete solution for security issues.

Firewalls, endpoint monitoring, access monitoring, and more — these are additional layers that need to be put in place and integrated into your security architecture. Of course, a multi-layered system generate a huge volume of data which requires a security analytics platform that can ingest all the data, process it and give you the tools to effectively analyze it.

The integration with Logz.io provides you with aggregation and analytics capabilities necessary to make the most out of the logs and events that Suricata generates. We will be enhancing our Suricata integration with additional rules and dashboards in our Security Analytics platform so stay tuned!

Identify and remediate threats faster with one unified platform for operations and security.

Securing the ELK Stack with Nginx

$
0
0

If you’ve been following Elasticsearch-related news over the past few months, you’ve most likely heard about a series of cases in which sensitive data stored in Elasticsearch clusters was exposed. Here’s a recap just in case — Equifax, CITI, AIESEC to name just a few.

Elasticsearch features are available via an extensive REST API over HTTP, which makes it easy to fit it into modern architectures. It’s super easy to create a new index, search across multiple indices and perform other management actions. Since Elasticsearch and Kibana don’t ship with built-in authentication, this also means that data can be easily exposed to malicious activity if simple yet necessary steps are not taken to secure it.

In this article, I’d like to explain how to implement one of the more common and simple methods of securing the ELK Stack — deploying nginx in front of Elasticsearch and Kibana to act as a reverse proxy.

Setting up ELK

I’m not going to provide all the instructions for installing Kibana and Elasticsearch. If you need help with this, check out our ELK guide. However, to make sure the steps for securing these two components work correctly, we do need to verify we have some settings configured correctly — changing the default ports and binding to localhost. 

Configuring Kibana

Open the Kibana configuration file, change the default port, and make sure Kibana is bound to localhost.

sudo vim /etc/kibana/kibana.yml

server.port:8882
server.host: "127.0.0.1"

Save the file and restart Kibana:

sudo service kibana restart

Configuring Elasticsearch

Repeat the same process with Elasticsearch.

Open the Elasticsearch configuration file, change the default port, and in the Network section, make sure Elasticsearch is bound to localhost:

sudo vim /etc/elasticsearch/elasticsearch.yml

network.host: "127.0.0.1"
http.port: 8881

Save the file and restart Kibana:

sudo service elasticsearch restart

You’ll see that Kibana can still be easily accessed by simply opening your browser at:

http://localhost:8882:

Kibana

Our next step will make sure this can no longer happen.

Installing and configuring Nginx

To start the process of adding authentication, we’ll install nginx:

sudo apt-get install nginx

We’re also going to install apache2-utils to help us create the accounts used with basic authentication:

sudo apt-get install apache2-utils

Next, we’ll create a user account for the basic authentication (I chose kibanauser, but you can of course replace this with any user account you’d like):

sudo htpasswd -c /etc/nginx/htpasswd.users kibanauser

After hitting enter, we’ll be prompted to enter and verify a password for the user.

New password:
Re-type new password:
Adding password for user kibanauser

Next, we’re going to create an nginx configuration file:

sudo vim /etc/nginx/conf.d/kibana.conf

Enter the following configuration:

worker_processes  1;
events {
  worker_connections 1024;
}

http {
  upstream elasticsearch {
    server 127.0.0.1:9200;
    keepalive 15;
  }

  upstream kibana {
    server 127.0.0.1:5601;
    keepalive 15;
  }

  server {
    listen 8881;

    location / {
      auth_basic "Restricted Access";
      auth_basic_user_file /etc/nginx/htpasswd.users;


      proxy_pass http://elasticsearch;
      proxy_redirect off;
      proxy_buffering off;

      proxy_http_version 1.1;
      proxy_set_header Connection "Keep-Alive";
      proxy_set_header Proxy-Connection "Keep-Alive";
    }

  }

  server {
    listen 8882;

    location / {
      auth_basic "Restricted Access";
      auth_basic_user_file /etc/nginx/htpasswd.users;

      proxy_pass http://kibana;
      proxy_redirect off;
      proxy_buffering off;

      proxy_http_version 1.1;
      proxy_set_header Connection "Keep-Alive";
      proxy_set_header Proxy-Connection "Keep-Alive";
    }
  }
}

We are asking nginx to listen to port 8881 for connections to Elasticsearch and port 8882 for connections to Kibana, using basic authentication with the account we created with htpasswd.   

That’s all there is to it.

Restart nginx and restart Kibana:

sudo service nginx restart
sudo service kibana restart

Verifying authentication

Both Elasticsearch and Kibana are now gated with basic authentication. We can verify this using some cURL commands.

For Elasticsearch, use:

curl --verbose http://kibanauser:1234@127.0.0.1:8881

You should see the following output:

* Rebuilt URL to: http://kibanauser:1234@127.0.0.1:8881/
*   Trying 127.0.0.1...
* Connected to 127.0.0.1 (127.0.0.1) port 8881 (#0)
* Server auth using Basic with user 'kibanauser'
> GET / HTTP/1.1
> Host: 127.0.0.1:8881
> Authorization: Basic a2liYW5hdXNlcjoxMjM0
> User-Agent: curl/7.47.0
> Accept: */*
>
< HTTP/1.1 200 OK
< Server: nginx/1.10.3 (Ubuntu)
< Date: Sun, 10 Feb 2019 11:14:13 GMT
< Content-Type: application/json; charset=UTF-8
< Content-Length: 493
< Connection: keep-alive
<
{
  "name" : "9qenDRz",
  "cluster_name" : "elasticsearch",
  "cluster_uuid" : "rbfDdSWaRmyrh9kOSVNwyg",
  "version" : {
    "number" : "6.6.0",
    "build_flavor" : "default",
    "build_type" : "deb",
    "build_hash" : "a9861f4",
    "build_date" : "2019-01-24T11:27:09.439740Z",
    "build_snapshot" : false,
    "lucene_version" : "7.6.0",
    "minimum_wire_compatibility_version" : "5.6.0",
    "minimum_index_compatibility_version" : "5.0.0"
  },
  "tagline" : "You Know, for Search"
}
* Connection #0 to host 127.0.0.1 left intact

For Kibana:

curl --verbose http://kibanauser:1234@127.0.0.1:8882

And the output:

* Rebuilt URL to: http://kibanauser:1234@127.0.0.1:8882/
*   Trying 127.0.0.1...
* Connected to 127.0.0.1 (127.0.0.1) port 8882 (#0)
* Server auth using Basic with user 'kibanauser'
> GET / HTTP/1.1
> Host: 127.0.0.1:8882
> Authorization: Basic a2liYW5hdXNlcjoxMjM0
> User-Agent: curl/7.47.0
> Accept: */*
>
< HTTP/1.1 302 Found
< Server: nginx/1.10.3 (Ubuntu)
< Date: Sun, 10 Feb 2019 11:15:43 GMT
< Content-Type: text/html; charset=utf-8
< Content-Length: 0
< Connection: keep-alive
< location: /app/kibana
< kbn-name: kibana
< kbn-xpack-sig: 4081d734fcd0e7d12f32aeb71f111a2d
< cache-control: no-cache
<
* Connection #0 to host 127.0.0.1 left intact

Opening up our browser at http://localhost:8882 displays an authentication dialog (since I’m using an EC2 instance, the URL specifies the public IP):

Sign in


Enter the user and password you configured, and Kibana is displayed.

Welcome

Endnotes

Like many open source projects, the ELK Stack lacks some key ingredients to make it production-ready. Security is one of them. While using nginx as a reverse proxy helps us close some of the security gaps, it will not help us protect our stack from specific attack vectors and Elasticsearch-specific vulnerabilities.

That’s where using a completely managed service like Logz.io can help, providing users with a bullet-proof platform that includes role-based access, user control, SSO and is fully compliant with the strictest regulatory requirements.

Of course, the nginx configuration described here was just a simple example. More advanced configurations will allow you to encrypt traffic with SSL and we will explore adding SSL into the mix in a future article.

Logz.io offers a secure and compliant ELK solution. Easily monitor, troubleshoot, and secure your environment with one unified platform.

Deploying a Kubernetes Cluster with Amazon EKS

$
0
0

There’s no denying it — Kubernetes has become the de-facto industry standard for container orchestration. 

In 2018, AWS, Oracle, Microsoft, VMware and Pivotal all joined the CNCF as part of jumping on the Kubernetes bandwagon. This adoption by enterprise giants is coupled by a meteoric rise in usage and popularity.

Yet despite all of this, the simple truth is that Kubernetes is hard.

Yes, recent versions have made deploying and handling a Kubernetes cluster simpler but there are still some obstacles disrupting wider adoption. Even once you’ve acquainted yourself with pods, services and replication controllers, you still need to overcome networking, load balancing and monitoring. And that’s without mentioning security.

This challenge has given rise to a wave of hosted and managed Kubernetes services, and in this article I’d like to provide those interested in trying out AWS EKS with some basic steps to get a Kubernetes cluster up and running.

What is Amazon EKS?

Amazon EKS (Elastic Container Service for Kubernetes) is a managed Kubernetes service that allows you to run Kubernetes on AWS without the hassle of managing the Kubernetes control plane.

The Kubernetes control plane plays a crucial role in a Kubernetes deployment as it is responsible for how Kubernetes communicates with your cluster — starting and stopping new containers, scheduling containers, performing health checks, and many more management tasks.

The big benefit of EKS, and other similar hosted Kubernetes services, is taking away the operational burden involved in running this control plane. You deploy cluster worker nodes using defined AMIs and with the help of CloudFormation, and EKS will provision, scale and manage the Kubernetes control plane for you to ensure high availability, security and scalability.

Step 0: Before you start

You will need to make sure you have the following components installed and set up before you start with Amazon EKS:

  • AWS CLI – while you can use the AWS Console to create a cluster in EKS, the AWS CLI is easier. You will need version 1.16.73 at least. For further instructions, click here.
  • Kubectl – used for communicating with the cluster API server. For further instructions on installing, click here.
  • AWS-IAM-Authenticator – to allow IAM authentication with the Kubernetes cluster. Check out the repo on GitHub for instructions on setting this up.

Step 1: Creating an EKS role

Our first step is to set up a new IAM role with EKS permissions.

Open the IAM console, select Roles on the left and then click the Create Role button at the top of the page.

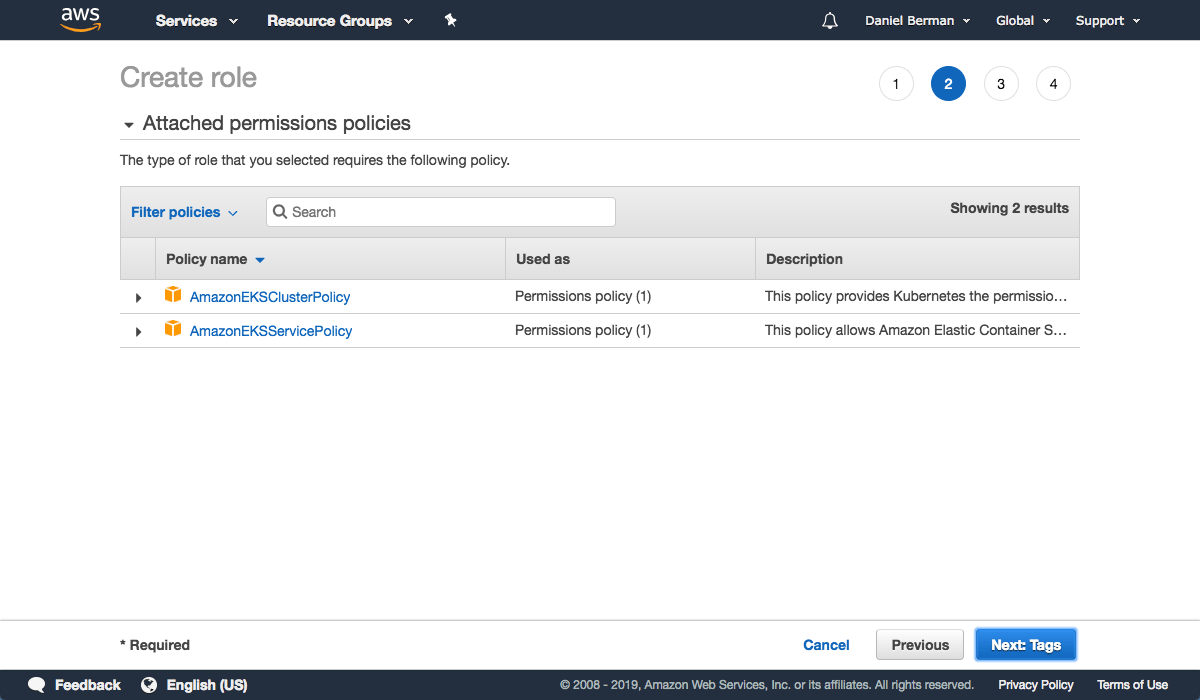
From the list of AWS services, select EKS and then Next: Permissions at the bottom of the page.

createrole

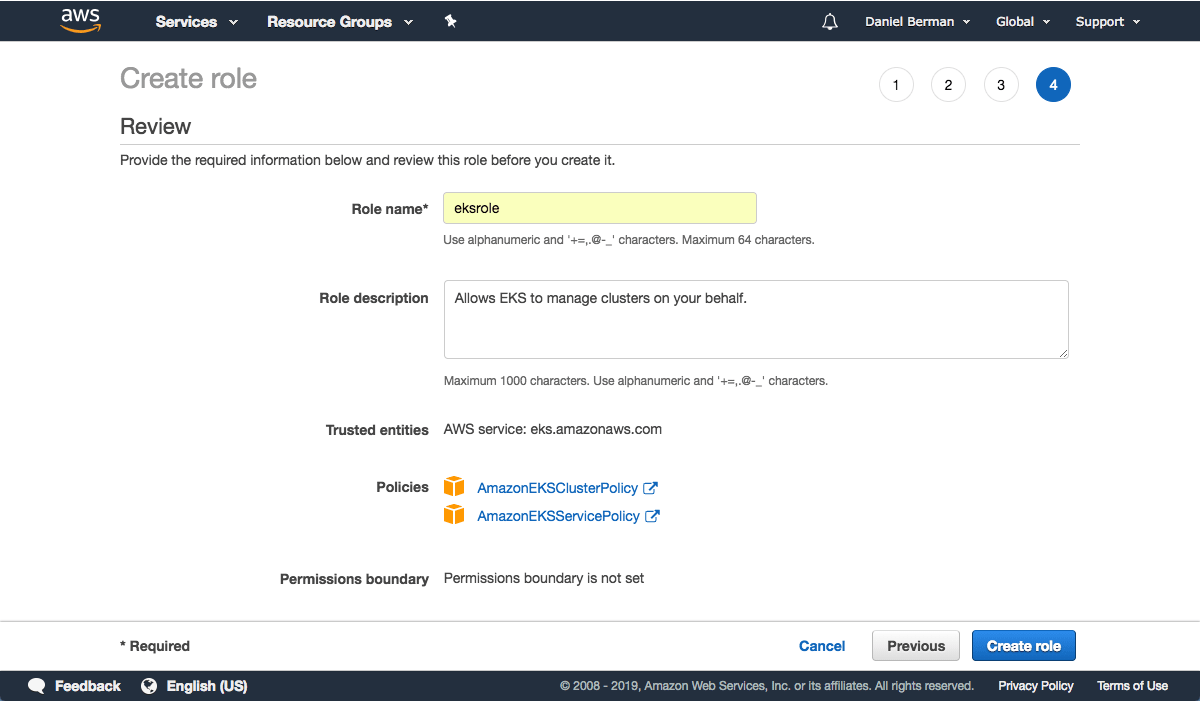
Leave the selected policies as-is, and proceed to the Review page.

role review

Enter a name for the role (e.g. eksrole) and hit the Create role button at the bottom of the page to create the IAM role.

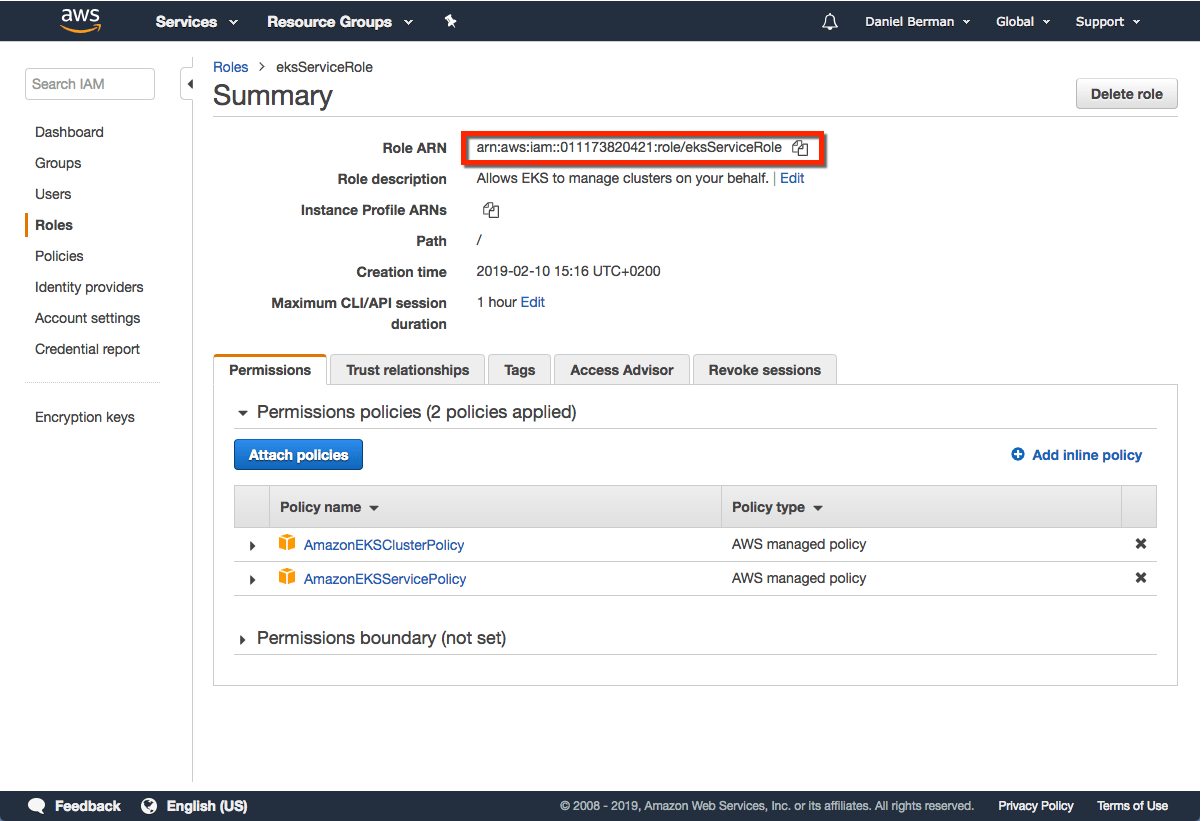
The IAM role is created.

Summary

Be sure to note the Role ARN, you will need it when creating the Kubernetes cluster in the steps below.

Step 2: Creating a VPC for EKS

Next, we’re going to create a separate VPC for our EKS cluster. To do this, we’re going to use a CloudFormation template that contains all the necessary EKS-specific ingredients for setting up the VPC.

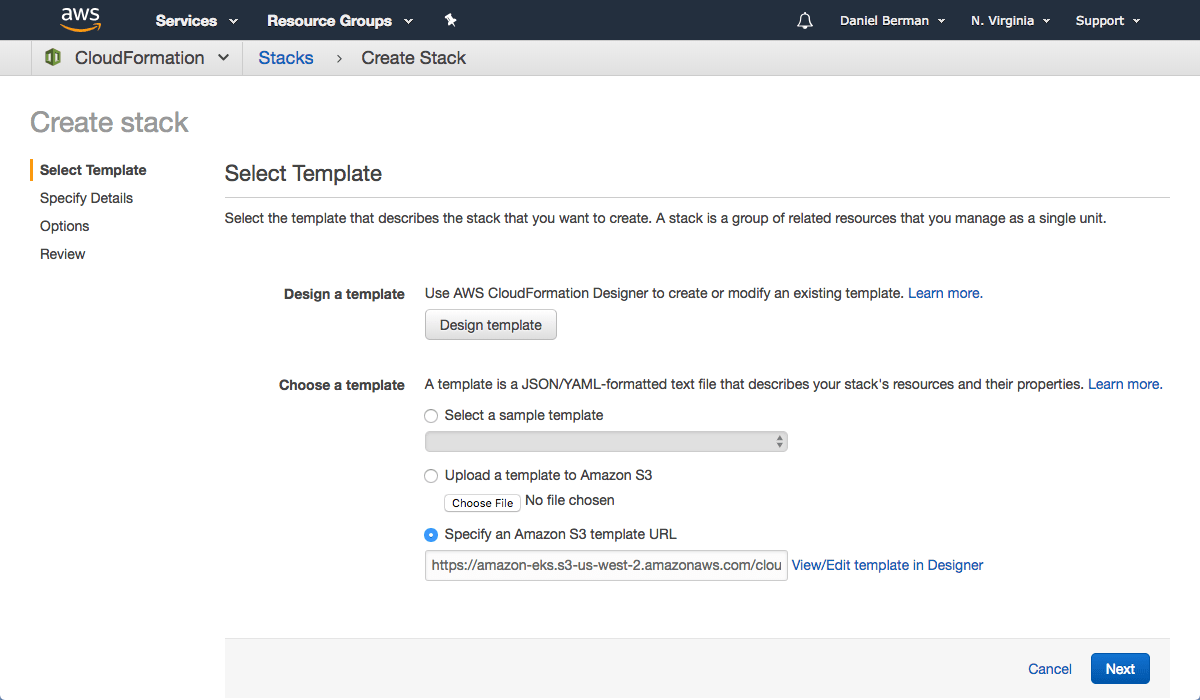
Open up CloudFormation, and click the Create new stack button.

On the Select template page, enter the URL of the CloudFormation YAML in the relevant section:

https://amazon-eks.s3-us-west-2.amazonaws.com/cloudformation/2019-01-
09/amazon-eks-vpc-sample.yaml

create stack

Click Next.

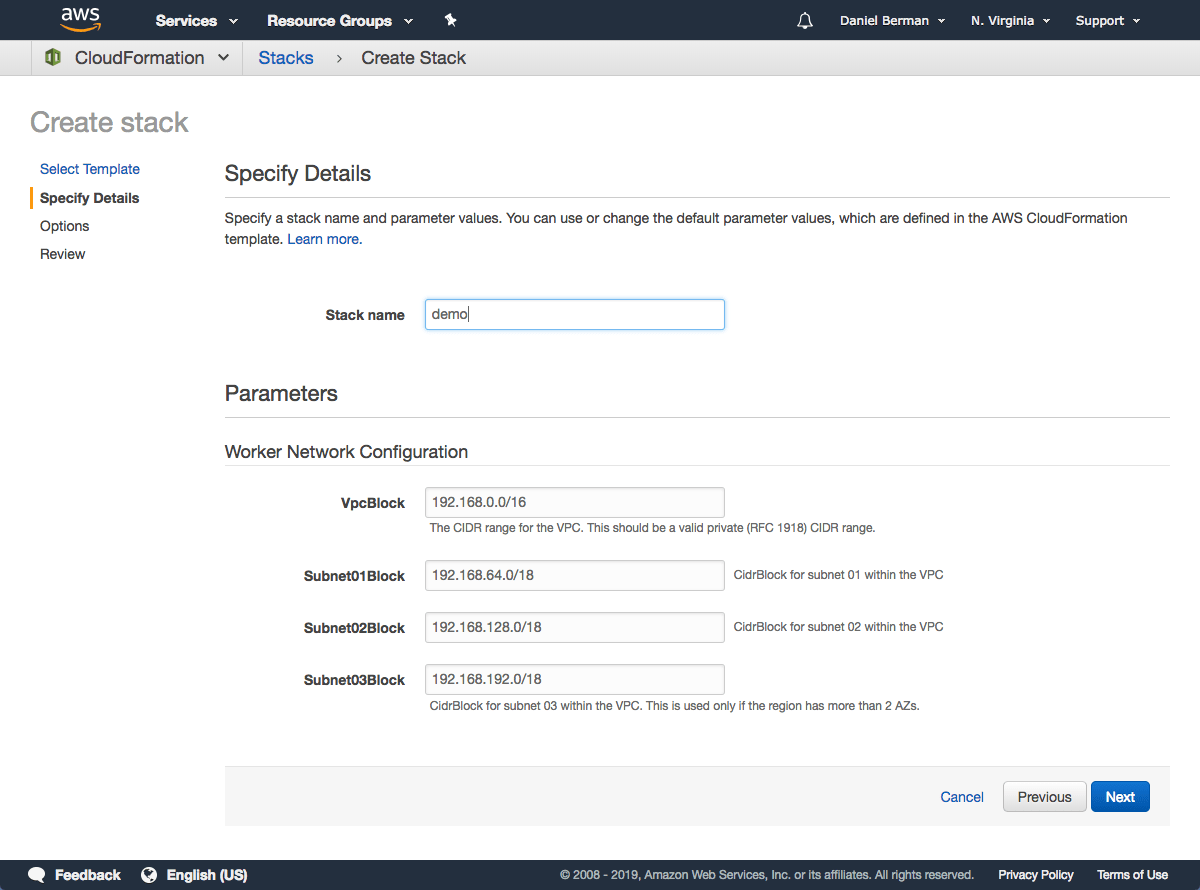
specify details

Give the VPC a name, leave the default network configurations as-is, and click Next.

On the Options page, you can leave the default options untouched and then click Next.

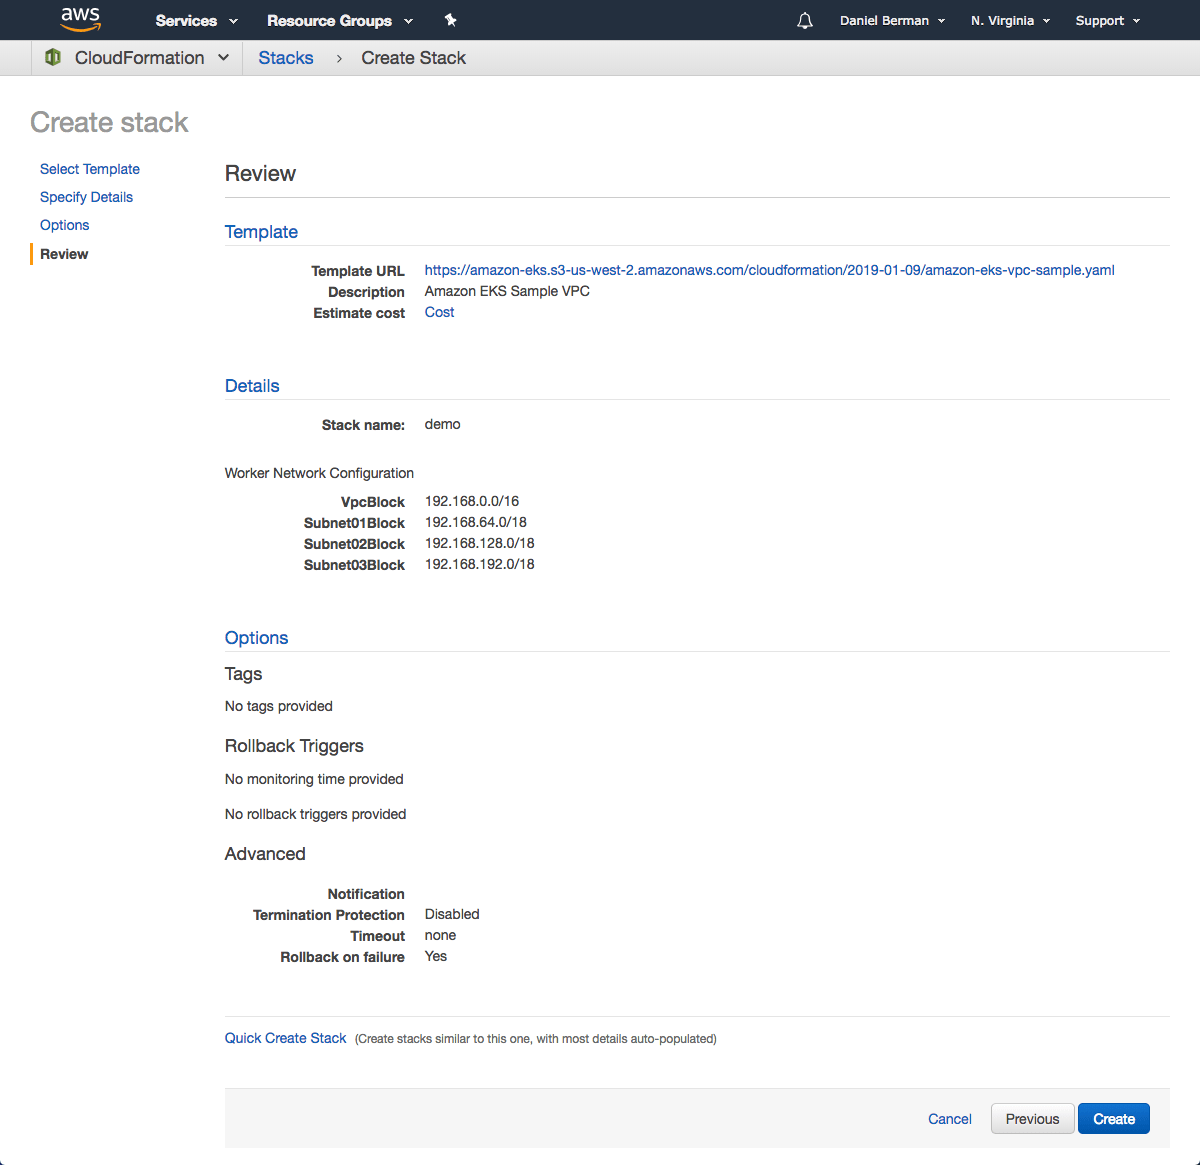
create vpc

On the Review page, simply hit the Create button to create the VPC.

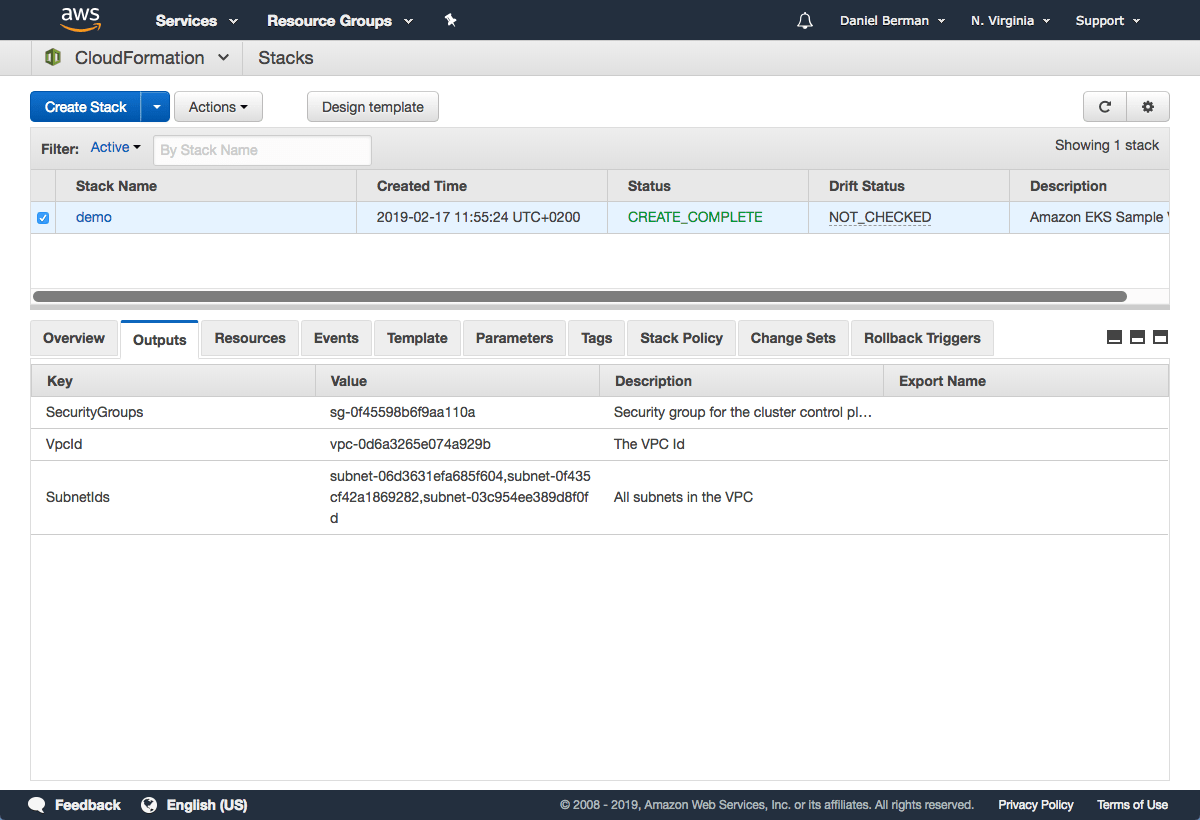
CloudFormation will begin to create the VPC. Once done, be sure to note the various values created — SecurityGroups, VpcId and SubnetIds. You will need these in subsequent steps. You can see these under the Outputs tab of the CloudFormation stack:

demo

Step 3: Creating the EKS cluster

As mentioned above, we will use the AWS CLI to create the Kubernetes cluster. To do this, use the following command:

demo

aws eks --region <region> create-cluster --name <clusterName> 
--role-arn <EKS-role-ARN> --resources-vpc-config 
subnetIds=<subnet-id-1>,<subnet-id-2>,<subnet-id-3>,securityGroupIds=
<security-group-id>

Be sure to replace the bracketed parameters as follows:

  • region — the region in which you wish to deploy the cluster.
  • clusterName — a name for the EKS cluster you want to create.
  • EKS-role-ARN — the ARN of the IAM role you created in the first step above.
  • subnetIds — a comma-separated list of the SubnetIds values from the AWS CloudFormation output that you generated in the previous step.
  • security-group-id — the SecurityGroups value from the AWS CloudFormation output that you generated in the previous step.

This is an example of what this command will look like:

aws eks --region us-east-1 create-cluster --name demo --role-arn
arn:aws:iam::011173820421:role/eksServiceRole --resources-vpc-config 
subnetIds=subnet-06d3631efa685f604,subnet-0f435cf42a1869282,
subnet-03c954ee389d8f0fd,securityGroupIds=sg-0f45598b6f9aa110a

Executing this command, you should see the following output in your terminal:

{
    "cluster": {
        "status": "CREATING",
        "name": "demo",
        "certificateAuthority": {},
        "roleArn": "arn:aws:iam::011173820421:role/eksServiceRole",
        "resourcesVpcConfig": {
            "subnetIds": [
                "subnet-06d3631efa685f604",
                "subnet-0f435cf42a1869282",
                "subnet-03c954ee389d8f0fd"
            ],
            "vpcId": "vpc-0d6a3265e074a929b",
            "securityGroupIds": [
                "sg-0f45598b6f9aa110a"
            ]
        },
        "version": "1.11",
        "arn": "arn:aws:eks:us-east-1:011173820421:cluster/demo",
        "platformVersion": "eks.1",
        "createdAt": 1550401288.382
    }
}

It takes about 5 minutes before your cluster is created. You can ping the status of the command using this CLI command:

aws eks --region us-east-1 describe-cluster --name demo --query 
cluster.status

The output displayed will be:

"CREATING"

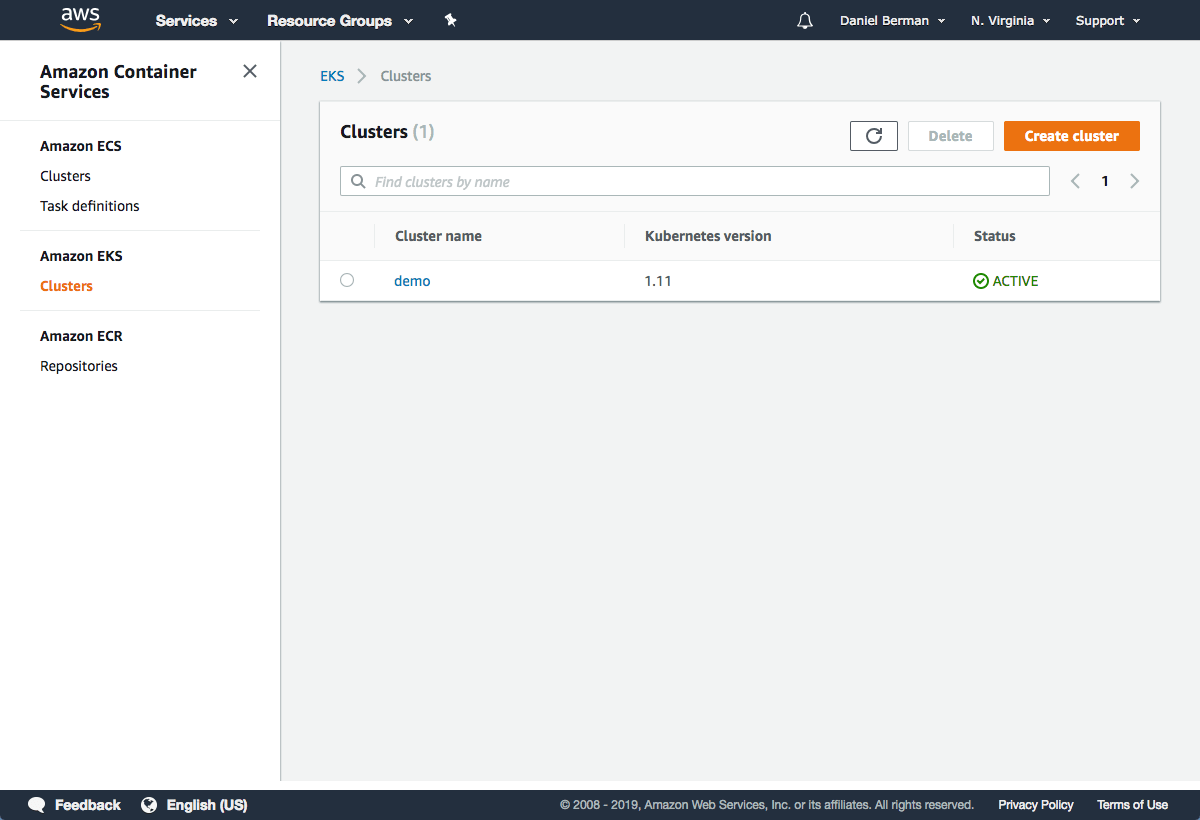
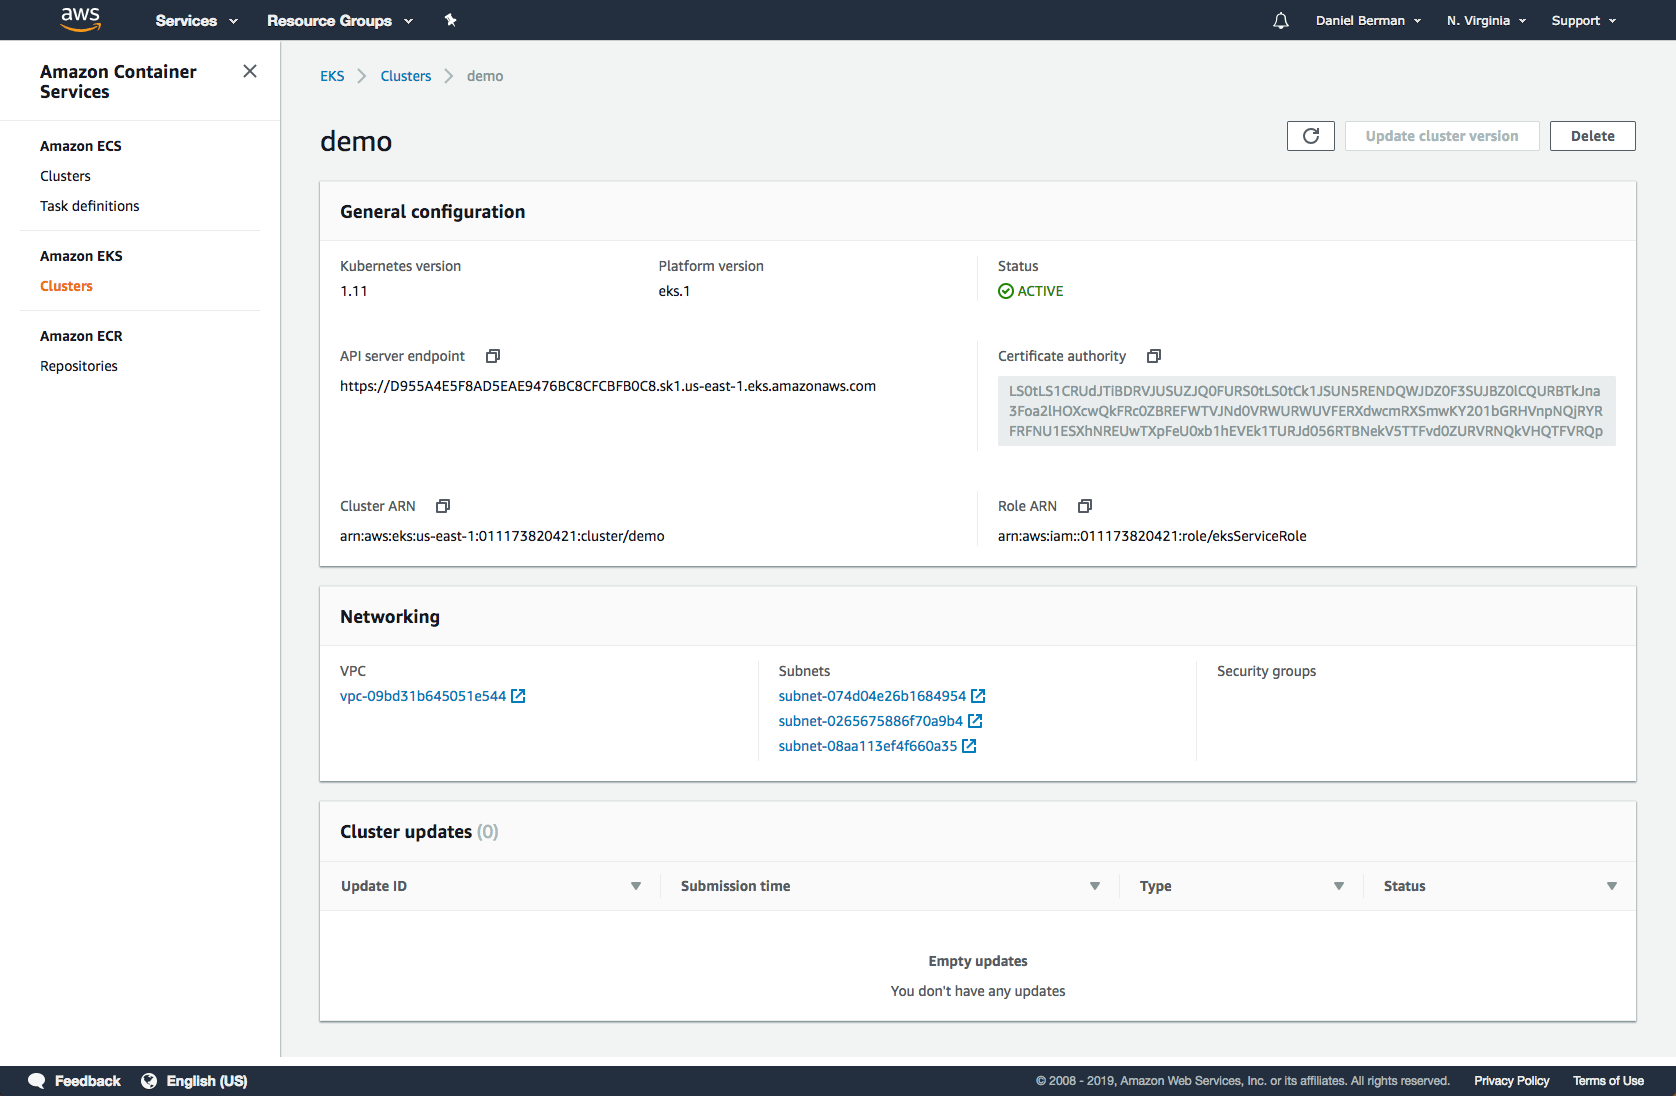
Or you can open the Clusters page in the EKS Console:

clusters

Once the status changes to “ACTIVE”, we can proceed with updating our kubeconfig file with the information on the new cluster so kubectl can communicate with it.

To do this, we will use the AWS CLI update-kubeconfig command (be sure to replace the region and cluster name to fit your configurations):

aws eks --region us-east-1 update-kubeconfig --name demo

You should see the following output:

Added new context arn:aws:eks:us-east-1:011173820421:cluster/demo to 
/Users/Daniel/.kube/config

We can now test our configurations using the kubectl get svc command:

kubectl get svc

NAME         TYPE        CLUSTER-IP   EXTERNAL-IP   PORT(S)   AGE
kubernetes   ClusterIP   10.100.0.1   <none>        443/TCP   2m

Click the cluster in the EKS Console to review configurations:

general configuration

Step 4: Launching Kubernetes worker nodes

Now that we’ve set up our cluster and VPC networking, we can now launch Kubernetes worker nodes. To do this, we will again use a CloudFormation template.

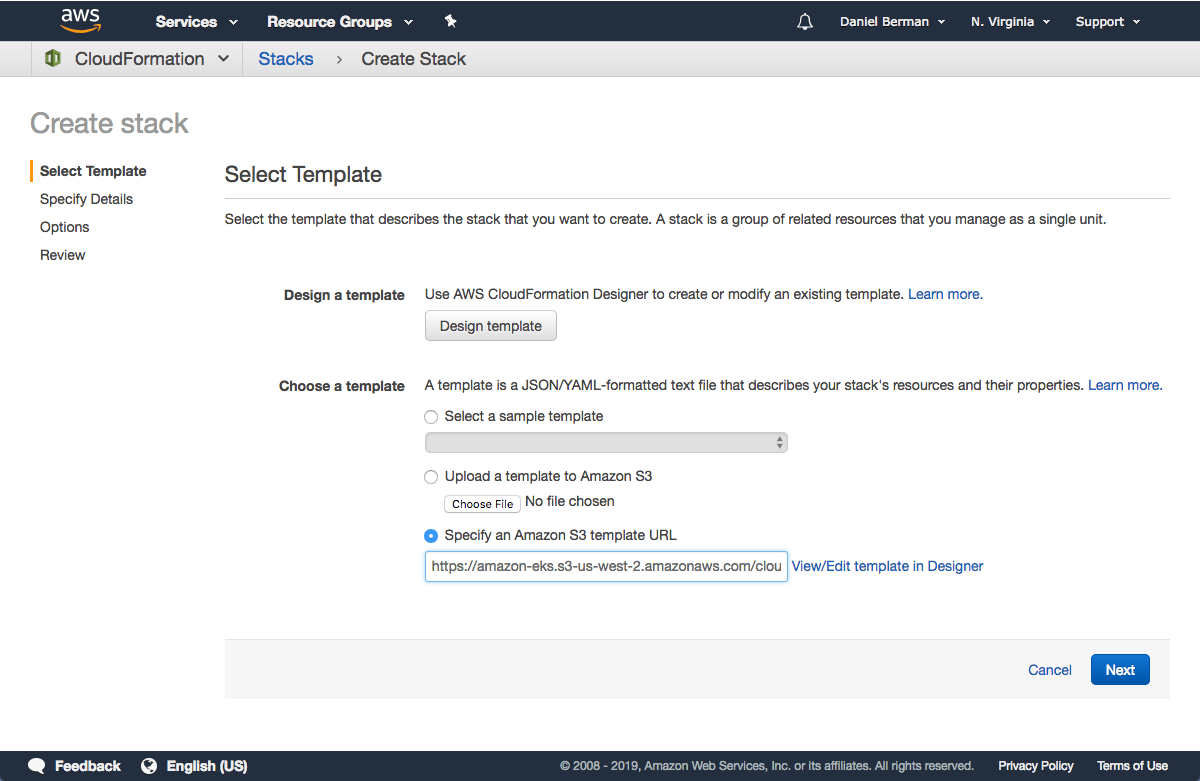
Open CloudFormation, click Create Stack, and this time use the following template URL:

https://amazon-eks.s3-us-west-2.amazonaws.com/cloudformation/2019-01-
09/amazon-eks-nodegroup.yaml

select template

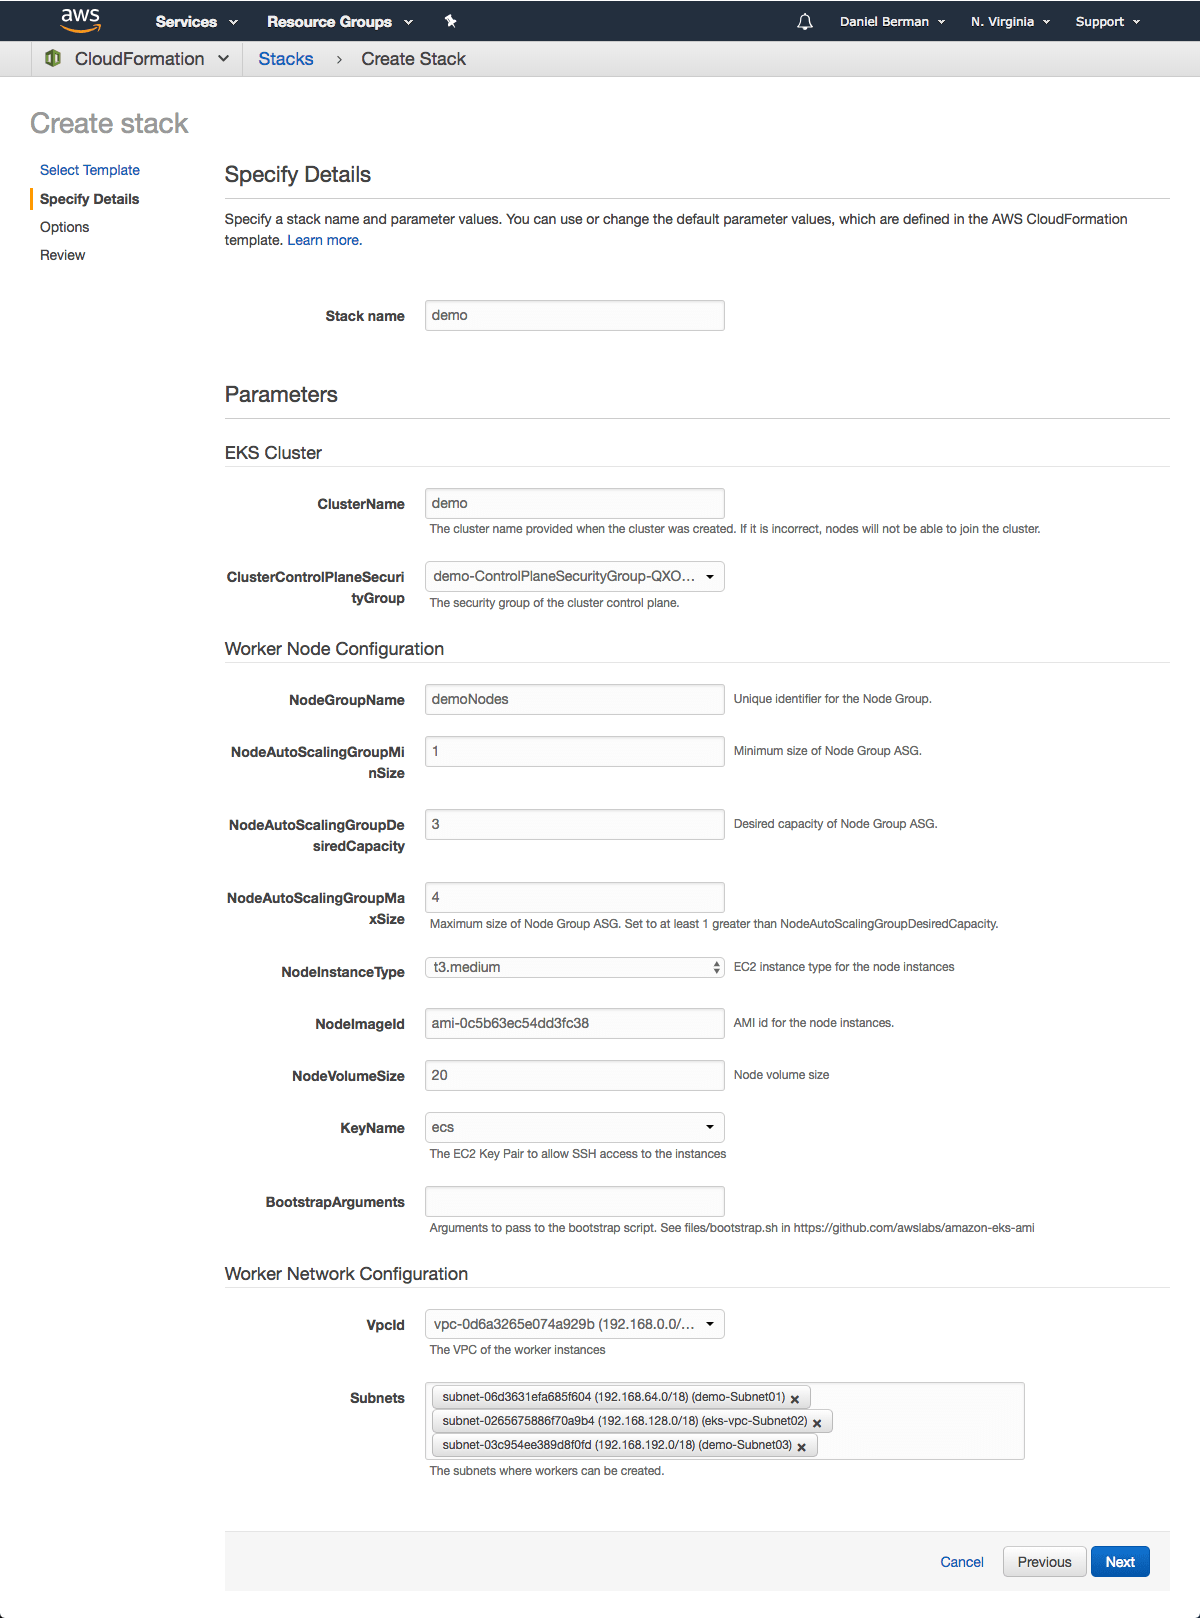
Clicking Next, name your stack, and in the EKS Cluster section enter the following details:

  • ClusterName – the name of your Kubernetes cluster (e.g. demo)
  • ClusterControlPlaneSecurityGroup – the same security group you used for creating the cluster in previous step.
  • NodeGroupName – a name for your node group.
  • NodeAutoScalingGroupMinSize – leave as-is. The minimum number of nodes that your worker node Auto Scaling group can scale to.
  • NodeAutoScalingGroupDesiredCapacity – leave as-is. The desired number of nodes to scale to when your stack is created.
  • NodeAutoScalingGroupMaxSize – leave as-is. The maximum number of nodes that your worker node Auto Scaling group can scale out to.
  • NodeInstanceType – leave as-is. The instance type used for the worker nodes.
  • NodeImageId – the Amazon EKS worker node AMI ID for the region you’re using. For us-east-1, for example: ami-0c5b63ec54dd3fc38
  • KeyName – the name of an Amazon EC2 SSH key pair for connecting with the worker nodes once they launch.
  • BootstrapArguments – leave empty. This field can be used to pass optional arguments to the worker nodes bootstrap script.
  • VpcId – enter the ID of the VPC you created in Step 2 above.
  • Subnets – select the three subnets you created in Step 2 above.

stack details

Proceed to the Review page, select the check-box at the bottom of the page acknowledging that the stack might create IAM resources, and click Create.

CloudFormation creates the worker nodes with the VPC settings we entered — three new EC2 instances are created using the

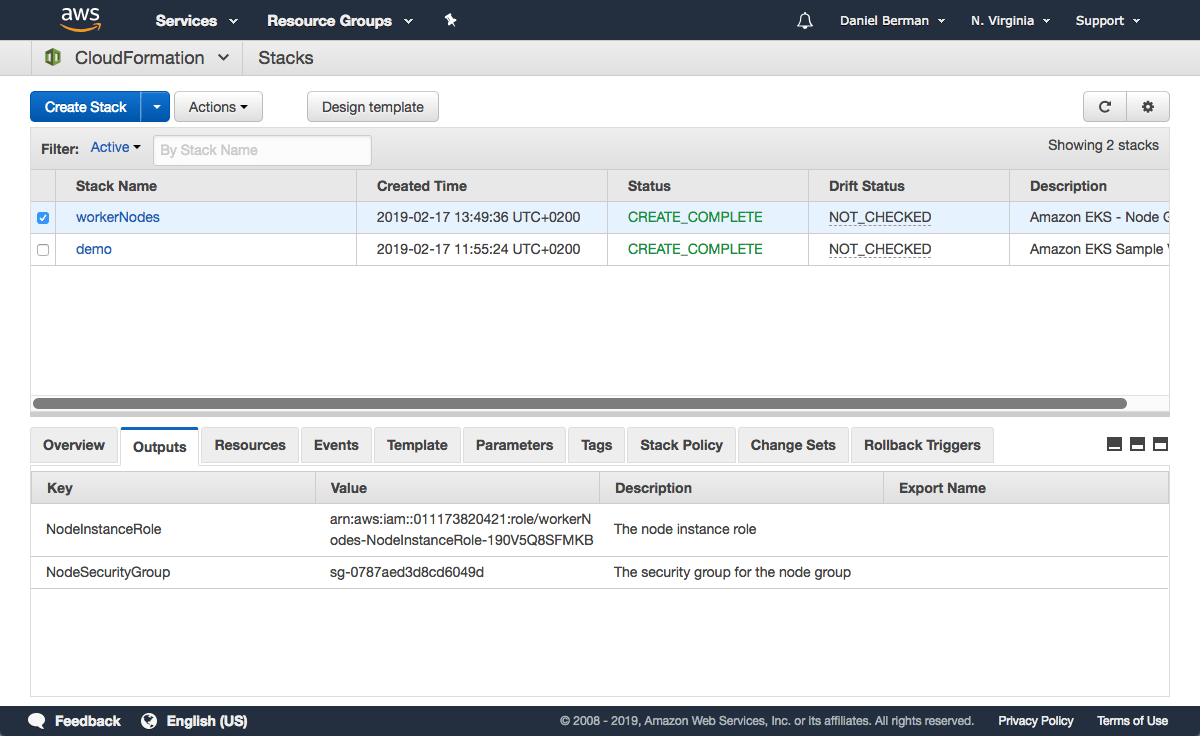
As before, once the stack is created, open Outputs tab:

open outputs


Note the value for NodeInstanceRole as you will need it for the next step — allowing the worker nodes to join our Kubernetes cluster.

To do this, first download the AWS authenticator configuration map:

curl -O 
https://amazon-eks.s3-us-west-2.amazonaws.com/cloudformation/2019-01-09
/aws-auth-cm.yaml

Open the file and replace the rolearn with the ARN of the NodeInstanceRole created above:

apiVersion: v1
kind: ConfigMap
metadata:
  name: aws-auth
  namespace: kube-system
data:
  mapRoles: |
    - rolearn: <ARN of instance role>
      username: system:node:{{EC2PrivateDNSName}}
      groups:
        - system:bootstrappers
        - system:nodes

Save the file and apply the configuration:

kubectl apply -f aws-auth-cm.yaml

You should see the following output:

configmap/aws-auth created

Use kubectl to check on the status of your worker nodes:

kubectl get nodes --watch

NAME                              STATUS     ROLES     AGE         VERSION
ip-192-168-245-194.ec2.internal   Ready     <none>    <invalid>   v1.11.5
ip-192-168-99-231.ec2.internal   Ready     <none>    <invalid>   v1.11.5
ip-192-168-140-20.ec2.internal   Ready     <none>    <invalid>   v1.11.5

Step 5: Installing a demo app on Kubernetes

Congrats! Your Kubernetes cluster is created and set up. To take her for a spin, we’re going to deploy a simple Guestbook app written in PHP and using Redis for storing guest entries.

The following commands create the different Kubernetes building blocks required to run the app — the Redis master replication controller, the Redis master service, the Redis slave replication controller, the Redis slave service, the Guestbook replication controller and the guestbook service itself:

kubectl apply -f https://raw.githubusercontent.com/kubernetes/examples/master/guestbook-go/redis-master-controller.json

kubectl apply -f https://raw.githubusercontent.com/kubernetes/examples/master/guestbook-go/redis-master-service.json

kubectl apply -f https://raw.githubusercontent.com/kubernetes/examples/master/guestbook-go/redis-slave-controller.json

kubectl apply -f https://raw.githubusercontent.com/kubernetes/examples/master/guestbook-go/redis-slave-service.json

kubectl apply -f https://raw.githubusercontent.com/kubernetes/examples/master/guestbook-go/guestbook-controller.json

kubectl apply -f https://raw.githubusercontent.com/kubernetes/examples/master/guestbook-go/guestbook-service.json

Use kubectl to see a list of your services:

kubectl get svc

guestbook      LoadBalancer   10.100.17.29     aeeb4ae3132ac11e99a8d12b26742fff-1272962453.us-east-1.elb.amazonaws.com   3000:31747/TCP   7m
kubernetes     ClusterIP      10.100.0.1       <none>                                                                    443/TCP          1h
redis-master   ClusterIP      10.100.224.82    <none>                                                                    6379/TCP         8m
redis-slave    ClusterIP      10.100.150.193   <none>                                                                    6379/TCP         8m

Open your browser and point to the guestbook’s external IP at port 3000:
guestbook

Summing it up

Kubernetes is THE container orchestration tool. There’s no argument there. But as already stated, it can be challenging, especially in large deployments and at a certain scale you might want to consider shifting some of the manual work to a managed solution.

Quoting the Kubernetes documentation, “If you just want to “kick the tires” on Kubernetes, use the local Docker-based solutions. When you are ready to scale up to more machines and higher availability, a hosted solution is the easiest to create and maintain.”

For those of you who are AWS power users, Amazon EKS is a natural fit. For those of you who are just migrating to the cloud or are deployed on a different cloud, Amazon EKS might seem a bit daunting to begin with.

In future articles, I’ll be taking a look at the other two main players in the world of managed Kubernetes — Azure Kubernetes Service (AKS) and Google’s Kubernetes Engine (GKE).

Easily monitor Kubernetes with Logz.io's ELK as a Service.

Monitoring Azure Activity Logs with Logz.io

$
0
0

In a previous post, we introduced a new integration with Microsoft Azure that makes it easy to ship Azure logs and metrics into Logz.io using a ready-made deployment template. Once in Logz.io, this data can be analyzed using the advanced analytics tools Logz.io has to offer — you can query the data, create visualizations and dashboards, and create alerts to get notified when something out of the ordinary occurs. 

In this article, we’ll take a look at how to collect and analyze a specific type of log data Azure makes available — Azure Activity Logs.

What are Azure Activity Logs?

Simply put, Azure Activity Logs allow users to monitor who did what and when for any write operations (PUT, POST, DELETE) executed for Azure resources in a specific Azure subscription and to understand the status of the operation and other relevant properties. You can, for example, use Activity Logs to gain insight into when new VMs are created, updated or deleted via the Resource Manager.

There are several different categories of Activity Logs, each giving you a different type of insight into what is transpiring within your subscription — Administrative, Service Health, Resource Health, Alert, Autoscale, Recommendation, Security and Policy. To understand the different types of Activity Log categories, I recommend Azure’s docs on the topic.

Deploying the template

First, you will need to deploy the template (if you’ve already set up the integration with Logz.io, feel free to skip to the next step). The easiest way to do this to use the Deploy to Azure button displayed in the first step of the repo’s readme:

logzioazureserverless

Once clicked, the Custom Deployment page in the Azure portal will be displayed with a list of pre-filled fields.

Custom Deployment

You can leave most of the fields as-is but be sure to enter the following settings:

  • Resource group: Either select an existing group or create a new one.
  • Logzio Logs Host: Enter the URL of the Logz.io listener. If you’re not sure what this URL is, check your login URL – if it’s app.logz.io, use listener.logz.io (this is the default setting). If it’s app-eu.logz.io, use listener-eu.logz.io.
  • Logzio Metrics Host: Enter the URL of the Logz.io listener. If you’re not sure what this URL is, check your login URL – if it’s app.logz.io, use listener.logz.io (this is the default setting). If it’s app-eu.logz.io, use listener-eu.logz.io.
  • Logzio Logs Token: Enter the token of the Logz.io account you want to ship Azure logs to. You can find this token on the account page in the Logz.io UI.
  • Logzio Metrics Token: Enter a token for the Logz.io account you want to use for shipping Azure metrics to. You can use the same account used for Azure logs.

Agree to the terms at the bottom of the page, and click Purchase.

Azure will then deploy the template. This may take a while as there is a long list of resources to be deployed, but after a minute or two, you will see the Deployment succeeded message at the top of the portal.

Streaming Azure Activity Logs to Logz.io

Now that we have all the building blocks in place for streaming the data into Logz.io, our next step is to set up exporting activity logs.

Activity logs can be exported to Events Hub which fits our scenario perfectly.

Open the Activity Log in the Azure portal and click Export to Event Hub at the top of the page.

export event hub


In the Export activity log blade that’s displayed, select Export to an event hub, and then click Select a service bus namespace.

selectservicebus

Enter the details of the Logz.io event hub namespace and policy name, and click OK.

save settings

Save the settings.

Azure will apply the settings, and within a minute or two you will start to see activity logs in Logz.io.

Analyzing Azure Activity Logs

Azure Activity Logs contain a wealth of information that can be used for tracking activities within a subscription. There are various categories of events recorded in this data, each with a different set of fields available for analysis.

To begin your analysis in Logz.io, you will most likely start with the Discover page in Kibana. Start by selecting some fields from the list on the left to get more visibility into the data. For example, in the example below I added the operationName, category and durationMs fields:

analyzing azure activity log

Using different types of queries, you can then search for specific events.

To examine only write events, for example, use:

category:Write

Or, say you want to find write actions performed within a specific Azure region:

category:Write AND location:westus

Kibana supports rich querying options that will help you dive deeper into the rabbit hole. To learn about the different query types, read this post.

Visualizing Azure Activity Logs

Of course, Kibana is well known for its visualization capabilities and once you’ve gained a better understanding of the data collected in Activity Logs, you can start building visualizations. Again, there is a wide variety of options to play around with and I’ll provide you with some examples here.

Operation type breakdown

The category field details the operation type – “Write”, “Delete” or “Action. Using a pie chart visualization, we can monitor this breakdown to get a picture of the different operations performed in our Azure subscription.

circle

Locations breakdown

In a similar fashion, we can monitor operations across regions, this time using the location field:

location

Status codes over time

The Azure Activity Log also reports the status for executed operations, such as “Started”, “Created” and “Active”, etc. Using a bar chart visualization, we can see a breakdown of these codes over time.

bar graph

Avg. Action Duration

The durationMs informs us how long the different actions take to execute. Line chart visualizations are great for monitoring trends over time so we can use an average aggregation of this field to get an overview picture of our Azure actions:

line graph

Activities per user

Another example is listing activities per user. One way of visualizing this data is using a data table visualization:

list

Adding all your visualizations into a dashboard gives you a nice overview of all the activity being recorded in Azure’s Activity Log.

dashboard
The dashboard above is available for one-click deployment in ELK Apps — Logz.io’s library of pre-made dashboards and visualizations. To deploy, simply open ELK Apps, search for Azure, and hit the Install button.

ELK Apps

Endnotes

The Activity Log is a great way to keep track of the different operations being executed by users in your Azure subscriptions. It provides details on who did what, when and in what region. The integration with Logz.io adds advanced analysis capabilities on top of this data.

As mentioned, Azure also generates diagnostic logs that together with the Activity Log gives you a comprehensive view into your Azure environment. To find out more about shipping and analyzing Azure Monitor logs and metrics, take a look at Monitoring Azure with Logz.io.

Enjoy!

Easily Monitor your Azure Activity Logs with Logz.io!

6 Things To Consider When Choosing A Log Management Solution

$
0
0

The days when you could simply SSH into a server and perform a fancy grep are long gone. If you’re reading this article, chances are either you are looking to move from that obsolete approach to a centralized logging approach with a log management tool, or you are looking for an alternative log management tool to replace your existing solution.

Problem is, there are so many different tools out there, making a choice can be overwhelming. So how do you pick the right solution?

We’re all snowflakes. We work differently and have requirements that vary from team to team, organization to organization, and use case to use case. It would be presumptuous and highly erroneous on my part to prescribe a one-size-fits-all framework for choosing a log management tool. Still, there are some common key requirements that any log management solution today must meet to be even considered, whether for IT operations, security analytics, DevOps or compliance.

Yes. Logz.io meets all these requirements. So do other solutions in the market, to some degree or other. My purpose here is not to highlight Logz.io but to provide readers with an understanding of what they cannot afford to miss out in their search process.

1. Data collection

Let’s start with the basics — collecting the logs from your data sources. Every log management tool promises to easily collect your log data, but it’s up to you to make sure that this promise holds water for your specific environment.

If your application is deployed with Kubernetes, for example, can the log management solution integrate natively with the Kubernetes logging architecture? If not, how much extra configuration is required? Is data collection automated when you auto-scale or do you have to set up integration for each new pod or node as it is deployed? And once collected, does the solution process that data or do you have to apply additional parsing to the logs manually pre-ingestion?

Centralized logging is a basic concept in theory but implementation can be complicated in modern architectures. Be sure you verify that data collection is indeed as simple and seamless as promised.

2. Search experience

Every log management tool must enable users to easily search their log data across multiple data sources. This sounds super-simple, but it actually involves much more than just entering a query in a search field.

First, performing searches must be easy. This means that the search syntax should be simple enough to perform simple text searches on the one hand and be robust enough to support more complicated queries.

Second, additional search features such as autocomplete, autosuggest, or the ability to easily add field and time-based filters can have a dramatic impact on the search experience

Third, and perhaps most importantly, searches must be fast and return results quickly. Which brings me to the next point.

3. Scalability

As we all know, log data today fits the three “V”s that define big data. The sheer volume, velocity and variety of log data makes log management tools crucial for effective monitoring and troubleshooting.

Engineers need to be able to easily access and analyze the huge volumes of log data their applications and infrastructure are generating. When an issue occurs, they cannot afford to wait for a minute or two until a query returns results. They need speed, regardless of the amount of data they are collecting and querying.

Nor can they afford to lose data. Every log message is important. And so, the log management solution you select must be scalable enough to support data bursts, data growth and cloud scale.

Most vendors tout scalability. Not all of them actually provide it. Make sure these solutions can put their money where their mouth is.

4. Security

Cyber threats and compliance requirements are pushing more and more organizations toward tighter security protocols. Log data contains a lot of sensitive information about your business, and potentially about your customers as well. So the security of your logs is of paramount importance.

Any log management solution you opt for must support SSL encryption for data in transit and role-based access, allowing users to be defined as admins or users as well as suspended or deleted. Account admins must be able to manage and control user access, including the provisioning of new users with a defined access level.

Depending on your business, you should be looking at solutions that are compliant with relevant regulatory requirements. If you are in the healthcare industry for example, HIPAA compliance will be important. The PCI DSS compliance framework will be relevant if your business handles or processes credit card data. I recommend reviewing what compliance needs you might require in this article on our blog.

5. Advanced analytics

Most log management tools in the market provide the means to query the log data and analyze it with the help of different types of charts and graphs. Some solutions provide more robust visualization capabilities than others, which should be a consideration as well. However, if you are drowning in TBs of log data a day, this will only take you part of the way.

You can query your data to your heart’s delight, but your troubleshooting process can end up being extremely frustrating as you might not be quite sure what to query in the first place. In today’s modern IT environments, you need to think about log management tools that help you overcome the big data challenge with advanced analytics capabilities.

More and more solutions are offering machine learning and anomaly detection to streamline troubleshooting and improve monitoring by giving you the tools to detect issues early on. As you examine these solutions, be sure to examine these advanced capabilities to gauge their effectiveness. Can they help your use case? Do they really provide added value or are they simply jumping on the AI bandwagon?  

6. Cost-effectiveness

Log data is extremely verbose and noisy in nature. Even if you are an extremely log-driven organization and have implemented structured logging from your very first line of code, your logs will eventually grow in volume and exact a considerable cost from your business.

The pricing model most log management tools use is based on data volume and retention. This makes sense, especially if you consider the fact that these services are paying for storage on the cloud themselves. The problem is that reality is a bit more complex, and sometimes your use case might not fit this all-in-one, take it or leave it, pricing model. What if you want to retain some of the logs for a limited amount of time and retain other logs for a year or more? What happens if you exceed your quota, something that happens often with data bursts?

As you look at the different log management tools on the market, make sure you understand your use case and are able to define your needs clearly. Look for solutions that are flexible, offer granular pricing and that are willing to work with you to find a model that is tailored to suit your needs.

Summing it up

If you’re on the hunt for a log management solution, there’s something about how you are currently working with log data that isn’t working. It might be the process of manually grepping scores of log files located on multiple hosts, or maybe it’s extremely bad search performance with the log management tool you are currently using.  

At the end of the day, your next solution needs to empower you to solve the problems you have, not impede you by creating new problems. Despite the long list of alternative solutions that complicates the selection process, how you narrow down the list of options is simple.

Ask yourself these qualifying questions:

Will the log management tool make my life Easier? Is it easy to deploy, integrate with and use? Does it play nicely with my environment? Will migrating to it be a simple process? Can it support the scale I require?

Will the log management tool make me more Efficient? Can it help me save time and resources? Can it help me overcome the “needle in the haystack” challenge and identify issues more quickly.

Looking for a scalable, open source log management solution? We have you covered

Introducing Enhancements to the Logz.io Security Analytics App – RSA 2019

$
0
0

RSA 2019 is finally here and we’re super-excited to participate this year in this great gathering of security experts where we will be demoing Logz.io Security Analytics — our new app for helping organizations combat security threats and meet compliance requirements.


Logz.io Security Analytics provides a unified platform for security and operations designed for cloud and DevOps environments. It’s built on top of Logz.io’s enterprise-grade ELK Stack and is extremely easy to set up and integrate with. Advanced security features include preconfigured rules, threat intelligence and anomaly detection that together help organizations identify and mitigate threats more efficiently.

At RSA we will be showing off a series of new features and enhancements for this app that help improve incident investigation workflows and the general user experience. Below is a list of some of these features, but if you’re attending RSA and want to learn more from up close, be sure to pay us a visit at booth 2068

Revamped Summary page

The Summary page provides you with a security overview of your environment and can be used to gauge your general security standpoint. We’ve added some enhancements to this dashboard to include detailed information on triggered rules — the number of triggered rules per category, a map showing the attack geographical origins, lists of triggered rules, and more.

revamped summary

Lookups

Lookups allow you to easily create reference lists for using in Kibana queries or correlation rules.

lookupsFor example, you might want to create a rule for failed logins into the AWS console. Instead of manually entering all the IAM users that are allowed access and can, therefore, be excluded from the rule definitions, you can create a lookup table that includes these users and can be updated separately.  

lookups

Packaged rules and dashboards

Logz.io Security Analytics ships with pre-packaged rules and security dashboards that can be used out-of-the-box for common security scenarios and use cases. We have added some new rules and dashboards, including for GDPR compliance (based on a Wazuh integration), AWS GuardDuty, Microsoft Azure Active Directory, Windows Firewall, and more.

dashboard

Drilldown

To simplify investigation, we’ve added the ability in Kibana to jump from one dashboard to another.

For example, on the Threats dashboard you can see a summary on the various threats identified by the system, including a list of malicious IPs probing your network. To investigate a specific IP, you can simply click the IP in question and a dedicated dashboard is displayed, providing a more detailed picture.

drilldown

Looking ahead

Offering seamless integrations, automatic scalability, threat detection, pre-packaged rules and reports and investigation tools, Logz.io Security Analytics extends the ELK Stack with security capabilities to help organizations protect their systems and meet regulatory standards.

The new features above will help make investigating security events easier. Further down the road, we will be adding some advanced forensics capabilities based on machine learning. More on this soon.

We rely heavily on our users’ feedback and so would love to hear back from you. If you are at RSA, be sure to drop by booth 2068  for a chat.

Identify and remediate threats faster with one unified platform for operations and security

Deploying a Kubernetes Cluster with GKE

$
0
0

In an attempt to jump on the Kubernetes bandwagon, more and more managed Kubernetes services are being introduced. In a previous post, we explored how to deploy a Kubernetes cluster on Amazon EKS. This time, we will cover the steps for performing a similar process, this time on Google’s Kubernetes Engine.

What is Google Kubernetes Engine (GKE)?

Originally a Google-spawned project, it’s no surprise that Kubernetes is strongly intertwined and supported in the public cloud services provided by Google. In fact, Google was among the first public cloud providers to offer a fully managed Kubernetes service called the Google Kubernetes Engine, or GKE. 

Similar to the other players in this field, GKE allows users to deploy Kubernetes without the need to install, manage and operate the clusters on their own, thus eliminating a key pain-point when running Kubernetes. It provides users with full control over cluster management and container orchestration, including load-balancing, networking as well as access to all Kubernetes features.

Users can run Kubernetes in a Google Cloud Platform-friendly environment, meaning they can reap the benefits of seamless integrations with other cloud tooling provided by Google such as Code Shell, Stackdriver, and more.

Step 0: Before you start

In this tutorial, I use the GCP console to create the Kubernetes cluster and Code Shell for connecting and interacting with it. You can, of course, do the same from your CLI, but this requires you have the following set up:

(gcloud components install kubectl)

Step 1: Create a new project

If you’re a newcomer to GCP, I recommend you start by creating a new project for your Kubernetes cluster — this will enable you to sandbox your resources more easily and safely.

In the console, simply click the project name in the menu bar at the top of the page, click New Project, and enter the details of the new project:

new project

Step 2: Creating your cluster

We can now start the process for deploying our Kubernetes cluster. Open the Kubernetes Engine page in the console, and click the Create cluster button (the first time you access this page, the Kubernetes API will be enabled. This might take a minute or two):

Kubernetes cluster

GKE offers a number of cluster templates you can use, but for this tutorial, we will make do with the template selected by default — a Standard cluster.

There a are a bunch of settings we need to configure:

  • Name – a name for the cluster.
  • Location type – you can decide whether to deploy the cluster to a GCP zone or region. Read up on the difference between regional and zonal resources here.
  • Node pools (optional) – node pools are a subset of node instances within a cluster that all have the same configuration. You have the option to edit the number of nodes in the default pool or add a new node pool.

There are other advanced networking and security settings that can be configured here but you can use the default settings for now and click the Create button to deploy the cluster.

After a minute or two, your Kubernetes cluster is deployed and available for use.

available

Step 3: Connecting to the cluster

Clicking the name of the cluster, we can see a lot of information about the deployment, including the Kubernetes version deployed, its endpoint, the size of the cluster and more. Conveniently, we can edit the deployment’s state.

Conveniently, GKE provides you with various management dashboards that we can use to manage the different resources of our cluster, replacing the now deprecated Kubernetes dashboard:

  • Clusters – displays cluster name, its size, total cores, total memory, node version, outstanding notifications, and more.
  • Workloads – displays the different workloads deployed on the clusters, e.g. Deployments, StatefulSets, DaemonSets and Pods.
  • Services – displays a project’s Service and Ingress resources
  • Applications – displays your project’s Secret and ConfigMap resources.
  • Configuration
  • Storage – displays PersistentVolumeClaim and StorageClass resources associated with your clusters.

To connect to the newly created cluster, you will need to configure kubectl to communicate with it. You can do this via your CLI or using GCP’s Cloud Shell. For the latter, simply click the Connect button on the right, and then the Run in Cloud Shell button. The command to connect to the cluster is already entered in Cloud Shell:

cloud shell

Hit Enter to connect. You should see this output:

Fetching cluster endpoint and auth data.
kubeconfig entry generated for daniel-cluster.

To test the connection, use:

kubectl get nodes

NAME                                                STATUS    ROLES     AGE       VERSION
gke-standard-cluster-1-default-pool-227dd1e4-4vrk   Ready     <none>    15m       v1.11.7-gke.4
gke-standard-cluster-1-default-pool-227dd1e4-k2k2   Ready     <none>    15m       v1.11.7-gke.4
gke-standard-cluster-1-default-pool-227dd1e4-k79k   Ready     <none>    15m       v1.11.7-gke.4

Step 4: Deploying a sample app

Our last step is to deploy a sample guestbook application on our Kubernetes cluster.

To do this, first clone the Kubernetes examples repository. Again, you can do this locally in your CLI or using GCP’s Cloud Shell:

git clone https://github.com/kubernetes/examples

Access the guestbook project:

cd examples/guestbook

ls

all-in-one                   legacy      README.md                     
redis-slavefrontend-deployment.yaml  MAINTENANCE.md  
redis-master-deployment.yaml  redis-slave-deployment.yaml 
frontend-service.yaml     php-redis       redis-master-service.yaml     
redis-slave-service.yaml

The directory contains all the configuration files required to deploy the app — the Redis backend and the PHP frontend.

We’ll start by deploying our Redis master:

kubectl create -f redis-master-deployment.yaml

Then, the Redis master service:

kubectl create -f redis-master-service.yaml

kubectl get svc

NAME           TYPE        CLUSTER-IP      EXTERNAL-IP   PORT(S)    AGE
kubernetes     ClusterIP   10.47.240.1     <none>        443/TCP    1h
redis-master   ClusterIP   10.47.245.252   <none>        6379/TCP   43s

To add high availability into the mix, we’re going to add two Redis worker replicas:

kubectl create -f redis-slave-deployment.yaml

Our application needs to communicate to the Redis workers to be able to read data, so to make the Redis workers discoverable we need to set up a Service:

kubectl create -f redis-slave-service.yaml

We’re not ready to deploy the guestbook’s frontend, written in PHP.

kubectl create -f frontend-deployment.yaml

Before we create the service, we’re going to define type:LoadBalancer in the service configuration file:

sed -i -e 's/NodePort/LoadBalancer/g' frontend-service.yaml

To create the service, use:

kubectl create -f frontend-service.yaml

Reviewing our services, we can see an external IP for our frontend service:

kubectl get svc

NAME           TYPE           CLUSTER-IP      EXTERNAL-IP     PORT(S)        AGE
frontend       LoadBalancer   10.47.255.112   35.193.66.204   80:30889/TCP   57s
kubernetes     ClusterIP      10.47.240.1     <none>          443/TCP        1h
redis-master   ClusterIP      10.47.245.252   <none>          6379/TCP       13m
redis-slave    ClusterIP      10.47.253.50    <none>          6379/TCP       6m

guestbook

Congratulations! You’ve deployed a multi-tiered application on a Kubernetes cluster!

What next?

This was a very basic deployment using a simple example application. In larger production deployments, there are many more considerations that you will need to take into account — security, networking and of course — monitoring and troubleshooting.

In a future article, we’ll show how to add the ELK Stack and Logz.io into the mix to help you gain visibility into your Kubernetes deployments on GKE.  

Gain visibility into your Kubernetes deployments with Logz.io.

Java Garbage Collection Logging with the ELK Stack and Logz.io

$
0
0

Java programs running on JVM create objects on the heap. At some stage, these objects are no longer used and can pile up as  “garbage” needlessly taking up memory. Replacing the manual process of explicitly allocating and freeing memory, the Java Garbage Collection process was designed to take care of this problem automatically. 

Put simply, Java Garbage Collection is a process for optimizing memory usage by looking at heap memory, identifying which objects are being used (aka referenced objects) and which aren’t (aka unreferenced objects), and removing the unused objects. Removing these unused objects results in freeing up memory for smoother execution of programs. 

The Java Garbage Collection process can also generate a log file containing information about each collection performed, its results and duration. Monitoring this log over time can help us understand how our application is performing and optimize the garbage collection process. In this article, I’ll show how to aggregate these logs using the ELK Stack. 

Enabling Java Garbage Collection logging

To use Java Garbage Collection logs, we need to first enable them by passing some arguments when running JVM. By default, the Java Garbage Collection log is written to stdout and should output a line for every collection performed, but we can also output to file.

There are many JVM options related to Garbage Collection logs, but at a minimum, these are the parameters you will want to start out with:

-XX:+PrintGCDetails -XX:+PrintGCDateStamps -Xloggc:/opt/app/gc.log

  • -XX:+PrintGCDetails – for enabling detailed logging verbosity
  • -XX:+PrintGCDateStamps – for adding date and time timestamps
  • Xloggc:<file-path> – to log to file

Understanding a Java Garbage Collection log

A typical Garbage Collection log will contain detailed information on memory allocation for the three different heap “generations” — young generation, old generation and permanent generation (to understand the JVM memory model, I recommend reading this informative article).

Below is an example, followed by a brief explanation of the different types of information available for analysis but it’s important to understand that Java Garbage Collection logs come in many different flavors and tastes and the format of your logs will depend on the JVM version you’re using.

2019-03-05T15:33:45.314+0000: 7311.455: [GC (Allocation Failure) 
2019-03-05T15:33:45.314+0000: 7311.455: [ParNew: 68303K->118K(76672K), 
0.0097455 secs] 165753K->97571K(1040064K), 0.0101806 secs] 
[Times: user=0.01 sys=0.00, real=0.01 secs]

Let’s try and understand what we’re looking at:

  • 2019-01-18T18:39:17.518-0600 – the timestamp for when Garbage Collection was executed.
  • 7311.455 – when the Garbage Collection started (in seconds) relative to the JVM startup time.
  • GCthe type of Garbage Collection executed. In this case, a Minor GC but it could be ‘Full GC’ .
  • Allocation Failure – the cause of the collection event. In this case, Garbage Collection was triggered due to a data structure not fitting into any region in Young Generation.
  • ParNew – the type of collector used. “ParNew” is a stop-the-world, copying collector which uses multiple GC threads.
  • 68303K->118K(76672K), 0.0097455 secs – young generation space before -> after collection, (current space) and duration of event.
  • 165753K->97571K(1040064K), 0.0101806 secs – the overall heap memory change after the Garbage Collection ran and the total allocated memory space.
  • 0.0101806 secs – Garbage Collection execution time.
  • [Times: user=0.01 sys=0.00, real=0.01 secs] – duration of the GC event:
    • user – total CPU time consumed by the Garbage Collection process
    • sys – time spent in system calls or waiting for system events
    • real – elapsed time including time slices used by other processes

Collecting Java Garbage collection logs with ELK

To be able to effectively analyze Garbage Collection logs you will need a better solution than your preferred text editor. There are some tools available specifically for analyzing these logs such as the GCViewer but if you’re interested in correlation with other logs and data sources, a more centralized approach is required.

The ELK Stack to the rescue! I’ll be demonstrating how to use both Logz.io or your own deployment to collect, process and analyze the Garbage Collection logs.

Shipping to ELK

To collect and ship Garbage Collection logs to your own ELK deployment you’ll need to install Filebeat and Logstash first. If you don’t have these already installed as part of your logging pipelines, please refer to this tutorial.

Configuring Filebeat

Filebeat will simply forward our Garbage Collection logs to Logstash for processing.

sudo vim /etc/filebeat/filebeat.yml

The abbreviated form of the file will look something as followed:

filebeat.inputs:

- type: log
    enabled: true
  paths:
    - /var/log/<pathtofile>

output.logstash:
  hosts: ["localhost:5044"]

Save the file.

Configuring Logstash

Your Logstash configuration file needs to define Filebeat as the input source, apply various filtering and processing to the Garbage Collection logs and then forward the data to Elasticsearch for indexing.

Below is an example of a Logstash configuration file for processing the Garbage Collection logs explained above. Remember – you may encounter other formats and so the filtering might need to be tweaked.

Create a new configuration file:

sudo vim /etc/logstash/conf.d/gc.conf

Paste the following configuration:

input {
  beats {
    port => 5044
  }
}

filter {
    grok {
      match => {"message" => "%{TIMESTAMP_ISO8601:timestamp}: %{NUMBER:jvm_time}: \[%{DATA:gc_type} \(%{DATA:gc_cause}\) %{DATA:gc_time}: \[%{DATA:gc_collector}: %{NUMBER:young_generation_before}\K\-\>%{NUMBER:young_generation_after}\K\(%{NUMBER:young_generation_total}\K\)\, %{NUMBER:collection_time} .*?\] %{NUMBER:heap_before}\K\-\>%{NUMBER:heap_after}\K\(%{NUMBER:heap_total}\K\)\, %{NUMBER:gc_duration} .*?\] \[.*?\: .*?\=%{NUMBER:cpu_time} .*?\=%{NUMBER:system_time}\, .*?\=%{NUMBER:clock_time} .*?\]"}
    }
    mutate {
      convert => { 
        "young_generation_before" => "integer" 
        "young_generation_after" => "integer"
        "young_generation_total" => "integer"
        "heap_before" => "integer"
        "heap_after" => "integer"
        "heap_total" => "integer"
        "gc_duration" => "integer"
        "cpu_time" => "integer"
        "system_time" => "integer"
        "clock_time" => "integer"
        }
    }
}

output {
  elasticsearch { 
    hosts => ["localhost:9200"] 
  }
}

Save the file.

Starting the pipeline

All that’s left to do is start Filebeat and Logstash:

sudo service filebeat start
sudo service logstash start

If no problems arise, you should see a new Logstash index created in Elasticsearch:

curl -X GET "localhost:9200/_cat/indices?v"

health status index                       uuid                   pri rep docs.count docs.deleted store.size pri.store.size
green  open   .kibana_1                   LPx5-jcxROO4lzYCDxlDOg   1   0          3            0       12kb           12kb
yellow open   logstash-2019.03.07         9CyfZ_pFRr2oCcVCzJeEdw   5   1         29            0      432kb          432kb

Open up Kibana and define the new index pattern in the Management → Kibana →  Index Patterns page:

create index pattern

Once defined, you’ll see the Garbage Collection logs displayed and parsed on the Discover page:

discover

Shipping to Logz.io

To ship the data into Logz.io, some tweaks are required in our Logstash configuration file —  we need to add a mutate filter for adding the Logz.io account token and we need to change the output to point to Logz.io’s listeners.

Open the configuration file:

sudo vim /etc/logstash/conf.d/gc.conf

Paste the following configuration:

input {
  beats {
    port => 5044
  }
}

filter {
    grok {
      match => {"message" => "%{TIMESTAMP_ISO8601:timestamp}: %{NUMBER:jvm_time}: \[%{DATA:gc_type} \(%{DATA:gc_cause}\) %{DATA:gc_time}: \[%{DATA:gc_collector}: %{NUMBER:young_generation_before}\K\-\>%{NUMBER:young_generation_after}\K\(%{NUMBER:young_generation_total}\K\)\, %{NUMBER:collection_time} .*?\] %{NUMBER:heap_before}\K\-\>%{NUMBER:heap_after}\K\(%{NUMBER:heap_total}\K\)\, %{NUMBER:gc_duration} .*?\] \[.*?\: .*?\=%{NUMBER:cpu_time} .*?\=%{NUMBER:system_time}\, .*?\=%{NUMBER:clock_time} .*?\]"}
    }
    mutate {
      convert => { 
        "young_generation_before" => "integer" 
        "young_generation_after" => "integer"
        "young_generation_total" => "integer"
        "heap_before" => "integer"
        "heap_after" => "integer"
        "heap_total" => "integer"
        "gc_duration" => "integer"
        "cpu_time" => "integer"
        "system_time" => "integer"
        "clock_time" => "integer"
        }
    }
    mutate {
      add_field => { "token" => "yourAccountToken" }
    }
}

output {
  tcp {
    host => "listener.logz.io"
    port => 5050
    codec => json_lines
    }
}

Your Logz.io account token can be retrieved from the General settings page in Logz.io (click the cogwheel at the top-right corner).

Save the file.

Starting the pipeline

Start Logstash:

sudo service logstash start

You should begin to see your Garbage Collection logs appearing in Logz.io after a minute or two:

see logs

Analyzing the Garbage Collection logs

Shipping the Garbage Collection logs to the ELK Stack or Logz.io, you’ll be able to use all the analytics tools Kibana has to offer. Most of the fields that we parsed in the logs are numerical fields that we can use to creating visualizations.

Here are a few examples.

Young generation space

Using the Visual Builder in Kibana, we can monitor the average size of the young generation – before and after garbage collection.

generation space

Heap size

In a similar way, we can monitor the heap size, before and after garbage collection:

heap size

Endnotes

Monitoring Java Garbage Collection logs can come in handy when troubleshooting application performance issues. The problem is that these logs are somewhat difficult to understand and analyze. The benefit of shipping these logs to the ELK Stack lies in the ability to apply processing to the logs and subsequently use Kibana to slice and dice them.

As explained, Java Garbage Collection logs can come in different colors and shapes and so it’s not always easy to configure the processing of these logs in Logstash and later create visualizations. Still, this article should provide a solid basis from which to explore the art of analyzing this data in Kibana.

Easily monitor your Java Garbage Collection logs with Logz.io.

How to debug your Logstash configuration file

$
0
0

Logstash plays an extremely important role in any ELK-based data pipeline but is still considered as one of the main pain points in the stack. Like any piece of software, Logstash has a lot of nooks and crannies that need to be mastered to be able to log with confidence. 

One super-important nook and cranny is the Logstash configuration file (not the software’s configuration file (/etc/logstash/logstash.yml), but the .conf file responsible for your data pipeline). How successful you are at running Logstash is directly determined from how well versed you are at working with this file and how skilled you are at debugging issues that may occur if misconfiguring it.

To all those Logstash newbies, before you consider alternatives, do not despair — Logstash is a great log aggregator, and in this article you’ll find some tips for properly working with your pipeline configuration files and debugging them.

Understanding the structure of the config file

Before we take a look at some debugging tactics, you might want to take a deep breath and understand how a Logstash configuration file is built. This might help you avoid unnecessary and really basic mistakes.

Each Logstash configuration file contains three sections — input, filter and output.

Each section specifies which plugin to use and plugin-specific settings which vary per plugin. You can specify multiple plugins per section, which will be executed in order of appearance.  

Let’s take a look at this simple example for Apache access logs:

##Input section
input {
  file {
         path => "/var/log/apache/access.log"
    }
}

##Filter section
filter {
    grok {
      match => { "message" => "%{COMBINEDAPACHELOG}" }
    }
    date {
    match => [ "timestamp" , "dd/MMM/yyyy:HH:mm:ss Z" ]
  }
  geoip {
      source => "clientip"
    }
}

##Output section
output {
  elasticsearch { 
    hosts => ["localhost:9200"] 
  }
}

In this case, we are instructing Logstash to use the file input plugin to collect our Apache access logs from /var/log/apache/access.log, the grok and geoip plugins to process the log, and the Elasticsearch output plugin to ship the data to a local Elasticsearch instance.

Tips

  • Use a text editor to verify closing curly brackets for each statement and no breaking lines.
  • Each plugin has different settings. Verify the syntax for each plugin by referring to the plugin’s documentation.
  • Only use the plugins you need. Do not overload your Logstash configuration with plugins you don’t need that will only add more points of failure. More plugins also affect performance.

Building your groks

The grok filter plugin is one of the most popular plugins used by Logstash users. Its task is simple — to parse logs into beautiful and easy to analyze data constructs. Handling grok, on the other hand, is the opposite of simple.  

Grok is essentially based upon a combination of regular expressions so if you’re a regex genius, using this plugin in Logstash might be a bit easier compared to other users. Still, if you need some tips on grokking, take a look at this article.

The grokdebugger is a free online tool that will help you test your grok patterns on log messages. This tool makes life much easier (there is even a version of this tool available within Kibana), but please note that even if your grok passes the grokdebugge’s test, you still might encounter a Logstash configuration error or even a failed grok (_grokparsefailure).

Tips

  • Use the Logstash supported patterns in your groks. A full list of these patterns is available here.
  • As you begin configuring your grok, I recommend starting with the %{GREEDYDATA:message} pattern and slowly adding more and more patterns as you proceed.
  • There are a bunch of online tools that will help you with building regex’s. I like using regex101.

Testing your configuration

There’s no rush. Before you start Logstash in production, test your configuration file. If you run Logstash from the command line, you can specify parameters that will verify your configuration for you.

In the Logstash installation directory (Linux: /usr/share/logstash), enter:

sudo bin/logstash --config.test_and_exit -f <path_to_config_file>

This will run through your configuration, verify the configuration syntax and then exit. In case an error is detected, you will get a detailed message pointing you to the problem.

For example, in the error below we can see we had a configuration error on line 34, column 7:

[FATAL] 2019-03-09 17:37:27.334 [LogStash::Runner] runner - The given 
configuration is invalid. Reason: Expected one of #, => at line 34, 
column 7 (byte 1173) after filter

In case your configuration passes the configtest, you will see the following message:

Configuration OK
[INFO ] 2019-03-06 19:01:46.286 [LogStash::Runner] runner - Using config.test_and_exit mode. Config Validation Result: OK. 
Exiting Logstash

Logstash logging

In most cases, if you’ve passed the configtest and have verified your grok patterns separately using the grokdebugger, you’ve already greatly enhanced the chances you have of starting your Logstash pipeline successfully.

However, Logstash has the uncanny ability to surprise you with an error just when you’re feeling confident about your configuration. In this case, the first place you need to check is the Logstash logs (Linux: /var/log/logstash/logstash-plain.log). Here you might find the root cause of your error.

Another common way of debugging Logstash is by printing events to stdout.

output { 
  stdout { codec => rubydebug }
}

Tips

  • You cannot see the stdout output in your console if you start Logstash as a service.
  • You can use the stdout output plugin in conjunction with other output plugins.
  • I have a habit of opening another terminal each time I start Logstash and tail Logstash logs with:

sudo tail -f /var/log/logstash/logstash.log

Endnotes

Working with Logstash definitely requires experience. The examples above were super-basic and only referred to the configuration of the pipeline and not performance tuning. Things can get even more complicated when you’re working with multiple pipelines and more complex configuration files.  

As a rule of thumb, before you start with Logstash make sure you actually need it. Some use cases might be able to rely on beats only. Filebeat now supports some basic filtering and processing which might mean you don’t need to complicate matters with Logstash.

Again, Logstash is a great log aggregator. The improvements added in recent versions, such as the monitoring API and performance improvements, have made it much easier to build resilient and reliable logging pipelines. If you do indeed require Logstash, have started to work with it and have begun to encounter issues — be patient, it’s worth your while!

Easily process and enhance your data with Logz.io's advanced parsing.

Logging Kubernetes on GKE with the ELK Stack and Logz.io

$
0
0

An important element of operating Kubernetes is monitoring. Hosted Kubernetes services simplify the deployment and management of clusters, but the task of setting up logging and monitoring is mostly up to us. Yes, Kubernetes offer built-in monitoring plumbing, making it easier to ship logs to either Stackdriver or the ELK Stack, but these two endpoints, as well as the data pipeline itself, still need to be set up and configured. 

GKE simplifies matters considerably compared to other hosted Kubernetes solutions by enabling Stackdriver logging for newly created clusters, but many users still find Stackdriver lacking compared to more robust log management solution. Parsing is still problematic, and often requires extra customization of the default fluentd pods deployed when creating a cluster. Querying and visualizing data in Stackdriver is possible but not easy, not to mention the missing ability to create alerts to get notified on specific events.

In this article, I’ll show how to collect and ship logs from a Kubernetes cluster deployed on GKE to Logz.io’s ELK Stack using a fluentd daemonset.

I use Cloud Shell for connecting to and interacting with the cluster, but if you are using your local CLI, Kubectl and gcloud need to be installed and configured. To deploy a sample application that generates some data, you can use this article.

Step 1: Create a new project

If you already have a GCP project, just skip to the next step.

I recommend you start by creating a new project for your Kubernetes cluster — this will enable you to sandbox your resources more easily and safely.

In the console, simply click the project name in the menu bar at the top of the page, click New Project, and enter the details of the new project:

new project

Step 2: Creating your cluster

If you already have a Kubernetes cluster running on GKE, skip to the next step.

Open the Kubernetes Engine page in the console, and click the Create cluster button (the first time you access this page, the Kubernetes API will be enabled. This might take a minute or two):

kubernetes cluster

GKE offers a number of cluster templates you can use, but for this tutorial, we will make do with the template selected by default — a Standard cluster and the default settings provided for this template (for more information on deploying a Kubernetes cluster on GKE, check out this article.)

Just hit the Create button at the bottom of the page. After a minute or two, your Kubernetes cluster is deployed and available for use.

Kubernetes Engine

To connect to the newly created cluster, you will need to configure kubectl to communicate with it. You can do this via your CLI or using GCP’s Cloud Shell.

For the latter, simply click the Connect button on the right, and then the Run in Cloud Shell button.

The command to connect to the cluster is already entered in Cloud Shell:

standard cluster

Hit Enter to connect:

Fetching cluster endpoint and auth data.
kubeconfig entry generated for daniel-cluster.

To test the connection, use:

kubectl get nodes

NAME                                                STATUS    ROLES     AGE       VERSION
gke-standard-cluster-1-default-pool-227dd1e4-4vrk   Ready     <none>    15m       v1.11.7-gke.4
gke-standard-cluster-1-default-pool-227dd1e4-k2k2   Ready     <none>    15m       v1.11.7-gke.4
gke-standard-cluster-1-default-pool-227dd1e4-k79k   Ready     <none>    15m       v1.11.7-gke.4

Step 3: Enabling RBAC

To ship Kubernetes cluster logs to Logz.io, we will be using a fluentd daemonset with defined RBAC settings. RBAC helps you apply finer-grained control over who is accessing different resources in your Kubernetes cluster.

Before you deploy the daemonset, first grant your user the ability to create roles in Kubernetes by running the following command (replace [USER_ACCOUNT] with the user’s email address):

kubectl create clusterrolebinding cluster-admin-binding --clusterrole 
cluster-admin --user [USER_ACCOUNT]

And the output:

clusterrolebinding.rbac.authorization.k8s.io "cluster-admin-binding" created

Step 4: Deploying the fluentd daemonset

Fluentd pods are deployed by default in a new GKE cluster for shipping logs to Stackdriver, but we will be deploying a dedicated daemonset for shipping logs to Logz.io. Every node in your cluster will deploy a fluentd pod that is configured to ship stderr and stdout logs from the containers in the pods on that node to Logz.io.

First, clone the Logz.io Kubernetes repo:

git clone https://github.com/logzio/logzio-k8s/
cd /logz.io/logzio-k8s/

Open the daemonset configuration file:

sudo vim logzio-daemonset-rbc.yaml

---
apiVersion: v1
kind: ServiceAccount
metadata:
  name: fluentd
  namespace: kube-system

---
apiVersion: rbac.authorization.k8s.io/v1
kind: ClusterRole
metadata:
  name: fluentd
  namespace: kube-system
rules:
- apiGroups:
  - ""
  resources:
  - pods
  - namespaces
  verbs:
  - get
  - list
  - watch

---
kind: ClusterRoleBinding
apiVersion: rbac.authorization.k8s.io/v1
metadata:
  name: fluentd
roleRef:
  kind: ClusterRole
  name: fluentd
  apiGroup: rbac.authorization.k8s.io
subjects:
- kind: ServiceAccount
  name: fluentd
  namespace: kube-system
---
apiVersion: extensions/v1beta1
kind: DaemonSet
metadata:
  name: fluentd-logzio
  namespace: kube-system
  labels:
    k8s-app: fluentd-logzio
    version: v1
    kubernetes.io/cluster-service: "true"
spec:
  template:
    metadata:
      labels:
        k8s-app: fluentd-logzio
        version: v1
        kubernetes.io/cluster-service: "true"
    spec:
      serviceAccount: fluentd
      serviceAccountName: fluentd
      tolerations:
      - key: node-role.kubernetes.io/master
        effect: NoSchedule
      containers:
      - name: fluentd
        image: logzio/logzio-k8s:latest
        env:
        - name:  LOGZIO_TOKEN
          value: "yourToken"
        - name:  LOGZIO_URL
          value: "listenerURL"
        resources:
          limits:
            memory: 200Mi
          requests:
            cpu: 100m
            memory: 200Mi
        volumeMounts:
        - name: varlog
          mountPath: /var/log
        - name: varlibdockercontainers
          mountPath: /var/lib/docker/containers
          readOnly: true
      terminationGracePeriodSeconds: 30
      volumes:
      - name: varlog
        hostPath:
          path: /var/log
      - name: varlibdockercontainers
        hostPath:
          path: /var/lib/docker/containers

Enter the values for the following two environment variables in the file:

  • LOGZIO_TOKEN – your Logz.io account token. Can be retrieved from within the Logz.io UI, on the Settings page.
  • LOGZIO_URL – the Logz.io listener URL. If the account is in the EU region insert https://listener-eu.logz.io:8071. Otherwise, use https://listener.logz.io:8071. You can tell your account’s region by checking your login URL – app.logz.io means you are in the US. app-eu.logz.io means you are in the EU.

Save the file.

All that’s left is to deploy the daemonset with:

kubectl create -f logzio-daemonset-rbc.yaml

The output reports all the resources we require are created:

serviceaccount "fluentd" created
clusterrole.rbac.authorization.k8s.io "fluentd" created
clusterrolebinding.rbac.authorization.k8s.io "fluentd" created
daemonset.extensions "fluentd-logzio" created

You can verify that the pods were created with:

kubectl get pods --namespace=kube-system

NAME                                                       READY     STATUS    RESTARTS AGE
event-exporter-v0.2.3-85644fcdf-bngk9                      2/2       Running   0        2h
fluentd-gcp-scaler-8b674f786-d6lmb                         1/1       Running   0        2h
fluentd-gcp-v3.2.0-h4zg5                                   2/2       Running   0        2h
fluentd-gcp-v3.2.0-qrfbs                                   2/2       Running   0        2h
fluentd-gcp-v3.2.0-wrn46                                   2/2       Running   0        2h
fluentd-logzio-9knkr                                       1/1       Running   0        1m
fluentd-logzio-nfxwz                                       1/1       Running   0        1m
fluentd-logzio-xtcq4                                       1/1       Running   0        1m
heapster-v1.6.0-beta.1-69878744d4-n9lsf                    3/3       Running   0        2h
kube-dns-6b98c9c9bf-5286g                                  4/4       Running   0        2h
kube-dns-6b98c9c9bf-xr9nh                                  4/4       Running   0        2h
kube-dns-autoscaler-67c97c87fb-9spmf                       1/1       Running   0        2h
kube-proxy-gke-daniel-cluster-default-pool-de9fa6e4-0cl9   1/1       Running   0        2h
kube-proxy-gke-daniel-cluster-default-pool-de9fa6e4-5lvx   1/1       Running   0        2h
kube-proxy-gke-daniel-cluster-default-pool-de9fa6e4-d7bb   1/1       Running   0        2h
kubernetes-dashboard-69db8c7745-wnb4n                      1/1       Running   0        2h
l7-default-backend-7ff48cffd7-slxrj                        1/1       Running   0        2h
metrics-server-v0.2.1-fd596d746-f4ljm                      2/2       Running   0        2h

As seen here, a fluentd pod has been deployed for each node in the cluster (the other fluentd pods are the default pods deployed when creating a new GKE cluster).

In Logz.io, you will see container logs displayed on the Discover page in Kibana after a minute or two:

Discover

Step 5: Analyzing your Kubernetes cluster logs

Congrats. You’ve built a logging pipeline from a Kubernetes cluster on GKE to Logz.io. What now? How do you make sense of all the log data being generated by your cluster?

By default, container logs are shipped in JSON format using Docker’s json-file logging driver. This means that they will be parsed automatically by Logz.io. This makes it much easier to slice and dice the data with the analysis tools provided by Logz.io.

Still, you may find that some messages require some extra parsing, in which case you can, of course, tweak parsing in fluentd or simply ping Logz.io’s support team for some help.

You can query the data using a variety of different queries. You could perform a simple free-text search looking for errors but Kibana offers much more advanced filtering and querying options that will help you find the information you’re looking for.

For example, the filter box allows you to easily look at logs for a specific pod or container:

filter

Logz.io also provides advanced machine learning capabilities that help reveal events that otherwise would have gone unnoticed within the piles of log messages generated in our environment.

In the example below, Cognitive Insights has flagged an issue with kubelet — the Kubernetes “agent” that runs on each node in the cluster. Opening the event reveals contextual information that helps us understand whether there is a real issue here or not:

open event

If you want to see a live feed of the cluster logs, either in their raw format or in parsed format, you can use Logz.io’s Live Tail page. Sure, you could use the kubectl logs command to tail logs but in an environment consisting of multiple nodes and an even larger amount of pods, this approach is far from being efficient.

logs

Step 6: Building a monitoring dashboard

Kibana is a great tool for visualizing log data. You can create a variety of different visualizations that help you monitor your Kubernetes cluster — from simple metric visualizations to line charts and geographical maps. Below are a few basic examples.

No. of pods

Monitoring the number of pods running will show you if the number of nodes available is sufficient and if they will be able to handle the entire workload in case a node fails. A simple metric visualization can be created to help you keep tabs on this number:

18

Logs per pod

Monitoring noisy pods or a sudden spike in logs from a specific pod can indicate whether an error taking place. You could create a bar chart visualization to monitor the log traffic:

logs per pod

Once you have all your visualizations lined up, you can add them into a dashboard that provides a comprehensive picture of how your pods are performing.

dashboard

Endnotes

Of course, monitoring Kubernetes involves tracking a whole lot more than just container logs — container metrics, Kubernetes metrics and even application metrics — all these need to be collected in addition to the stderr and stdout output of your pods.

In a future article, we will explore how to ship Kubernetes metrics to Logz.io using a daemonset based on Metricbeat.  In the meantime, I recommend reading up on Kubernetes monitoring best practices in this article.

The combination of GKE and the analysis tools provided in the ELK Stack and Logz.io is a powerful combination that can help simplify not only the deployment and management of your Kubernetes cluster but also troubleshooting and monitoring it.

Proactively monitor Kubernetes with Logz.io Alerts.

Migrating to a new log management system

$
0
0

In a previous post we looked at 6 key considerations to keep in mind when selecting a log management solution: data collection, search experience, scalability, security, advanced analytics and cost effectiveness. Hopefully, you’ve managed to use this list to finally select your solution. What now? 

If you thought selecting a log management solution was the most difficult step of the process, you’re in for a nasty surprise. The actual process of migrating to this solution will prove to be just as much a challenge and must be factored into your team’s planning. Your team will have to figure out how to collect and ship the data, how to migrate existing logging pipelines and visualizations, put into place a DRP (Disaster Recovery Plan), and more.

Sounds like a lot, right? The goal of this article is not to put the fear of God into you, but to provide you with a list of the things you need to plan for. Not all the points listed here suit everyone’s use case, but most of you will be able to create an outline of a migration project based on this list.

Standardizing logs

While this is more of a general logging best practice than anything else, the more standardized your data is, the easier the migration process to a new log management solution is.

If your logs are formatted and structured consistently throughout your environment, ingestion into any new log management tool will be much simpler. The last thing you want you and your team spending time on is parsing five differently formatted timestamp fields coming from different hosts.

So – use a logging framework if possible, stick to the same field naming and log level conventions, output using one logging format (JSON preferably) and use tags where possible. These steps will help ensure your data requires a minimum amount of pre and post-ingestion processing, as well as make analysis in your new log management tool much more efficient.

Log collection and shipping

Regardless of the log management solution you’re migrating to, how well you handle the collection of log data and shipping it into the new tool will greatly influence the transition process.

A key factor here is understanding what log data you want to collect in the first case. Hopefully, you already have a good answer to this question, but if not, dedicate some time to formulate a wishlist of the logs you intend on shipping.

Once you have this wishlist in place, you will need to figure out the method for collecting and forwarding the data into the tool. The specific method will vary from data source to data source and from tool to tool. For example, if you’re planning on shipping all your AWS logs, a Lambda that extracts the logs from CloudWatch into your log management solution might be your weapon of choice. If you’re logging a Kubernetes cluster deployed on GKE, you might be using fluentd.

Many log management tools provide agents that need to be deployed on hosts or appenders that need to be coded into your applications. Some data sources support plugins to integrate with specific log management tools. In any case, be sure you’re familiar with these methods and are confident they ensure your logging pipelines will be resilient and robust enough to handle your log traffic. Logstash crashing because you didn’t provision enough resources for it to run is not something you want to be awoken to in the middle of the night.

Migrating pipelines

If you’re building a logging pipeline from scratch, you will not have to worry about migrating an existing pipeline. Based on the considerations above, you will have built a wishlist of the logs you want to ship and a plan for collecting them.

But what if you’re already shipping TBs of logs into an existing solution? How do you make sure you don’t lose any data during the migration process? To migrate existing pipelines, you will need to implement a phased process:

In phase 1, you will ship in parallel to both your existing solution and the new one. This could be as simple as running two agents per hosts or pointing to two endpoint URLs at the same time. In more complicated scenarios, you might need to run multiple collectors per data source.

In phase 2, you will need to gradually disengage from the existing pipeline. Once you’ve made sure all your logs are being collected properly and forwarded into the new tool, disable log collection and forwarding to your existing tool.

An optional phase here is importing historical data. Depending on your environment and data sources, you will need to think about a way to import old log data. You might, for example, need to think about archiving into S3 buckets and ingesting this into the new tool at a later stage. In case your solution is ELK-based, both Filebeat and Logstash support various options to reingest old data.

Securing your data

You’ve probably already done a fair amount of due diligence before selecting your log management solution. Meaning, you’ve made sure the solution adheres to strict security rules and is compliant with relevant regulatory requirements. When planning the migration process, there are some security measure you need to think of on your end too.

Opening up ports, granting permissions to log files, and making sure your logs are sanitized (i.e. don’t include credit card numbers) are some basic security steps to take. If you’re moving to a cloud-based solution, be sure your log data is encrypted while in transit. This means the agent or collector you are using has to support SSL. Encryption at rest is another key requirement to consider, especially if you are migrating to a do-it-yourself deployment.

Most log management solutions today provide role-based access and user management out of the box. This is most likely one of the reasons you’ve chosen to migrate to a new tool in the first place. SSO support, for example, is a standard requirement now, and you will need to be sure the new tool is able to integrate properly with your SSO provider, whether Okta, Active Directory or CA.

Planning for growth

As your business continues to grow, new services and apps will be developed. This means additional infrastructure will be provisioned to support this growth. And all this together means one thing — more logs. If you add to this the fact that logs can be extremely bursty in nature, spiking during crisis or busy times of the year.

When migrating to a new log management tool, be sure you have extra wiggle room. How you do this depends on your solution of course. For example, if you’ve selected to migrate to a SaaS solution, be sure that your plan provides for data bursts and overage. If it’s a do-it-yourself ELK Stack, be sure you have enough storage capacity whether you’re deploying Elasticsearch on-prem or on the cloud.

Preparing for disaster

If you’re responsible for monitoring business-critical applications, you cannot afford to lose a single log message. Implementing the phased approach described above ensures a smooth transition. But are you totally safe once you’ve completed the process? You should think about a DRP (Data Recovery Plan) in case something goes wrong. Archiving logs to an S3 bucket or Glacier, for example, is a common backup workflow.

Migrating dashboards

Again, if you’re starting from scratch and have no dashboards to migrate, then it’s just a matter of creating new objects. Granted, this is no simple task, but conveniently, some solutions provide you with canned dashboards to help you hit the ground running.

If you already have dashboards set up, the last thing you want is to start building them out again in your new tool. Sadly, there is no easy workaround. Some tools support exporting objects but that does not help with importing them into the new tool.

There is one exception here and that is if you’re migrating from one ELK-based solution to another. Kibana allows you to export and import JSON configurations of your dashboards and visualizations, and this makes the migration process much simpler.

Endnotes

Adding a new tool into your stack is always a daunting task, and log management tools are no exception to this rule. Log data is super-critical for organizations and this adds to the pressure of making sure the onboarding and transition process is successful.

As complex as it is, the process is also well defined and the points above provide you with an idea of what this process needs to include. Ideally, the log management solution you have selected can provide you with support and training to help you but if you’re on your own and have opted for a do-it-yourself solution, use the list above as a blueprint.

Good luck!

Monitor, Troubleshoot, and Secure your environment with Logz.io Intelligent ELK-as-a-Service.

Monitoring AWS EC2 with Metricbeat, the ELK Stack and Logz.io

$
0
0

Amazon EC2 is the cornerstone for any Amazon-based cloud deployment. Enabling you to provision and scale compute resources with different memory, CPU, networking and storage capacity in multiple regions all around the world, EC2 is by far Amazon’s most popular and widely used service.

Monitoring EC2 is crucial for making sure your instances are available and performing as expected. Metrics such as CPU utilization, disk I/O, and network utilization, for example, should be closely tracked to establish a baseline and identify when there is a performance problem.

Conveniently, these monitoring metrics, together with other metric types, are automatically shipped to Amazon CloudWatch for analysis. While it is possible to use the AWS CLI, API or event the CloudWatch Console to view these metrics, for deeper analysis and more effective monitoring, a more robust monitoring solution is required.

In this article, I’d like to show how to ship EC2 metrics into the ELK Stack and Logz.io. The method I’m going to use is a new AWS module made available in Metricbeat version 7 (beta). While still under development, and as shown below, this module provides an extremely simple way for centrally collecting performance metrics from all your EC2 instances.

Prerequisites

I assume you already have either your own ELK Stack deployed or a Logz.io account. For more information on installing the ELK Stack, check out our ELK guide. To use the Logz.io community edition, click here.

Step 1: Creating an IAM policy

First, you need to create an IAM policy for pulling metrics from CloudWatch and listing EC2 instances. Once created, we will attach this policy to the IAM user we are using.

In the IAM Console, go to Policies, hit the Create policy button, and use the visual editor to add the following permissions to the policy:

  • ec2:DescribeRegions
  • ec2:DescribeInstances
  • cloudwatch:GetMetricData

The resulting JSON for the policy should look like this:

{
    "Version": "2012-10-17",
    "Statement": [
        {
            "Sid": "VisualEditor0",
            "Effect": "Allow",
            "Action": [
                "ec2:DescribeInstances",
                "cloudwatch:GetMetricData",
                "ec2:DescribeRegions"
            ],
            "Resource": "*"
        }
    ]
}

Once saved, attach the policy to your IAM user.

Step 2: Installing Metricbeat

Metricbeat can be downloaded and installed using a variety of different methods, but I will be using Apt to install it from Elastic’s repositories.

First, you need to add Elastic’s signing key so that the downloaded package can be verified (skip this step if you’ve already installed packages from Elastic):

wget -qO - https://artifacts.elastic.co/GPG-KEY-elasticsearch | 
sudo apt-key add -

The next step is to add the repository definition to your system. Please note that I’m using the 7.0 beta repository since the AWS module is bundled with this version only for now:

echo "deb https://artifacts.elastic.co/packages/7.x-prerelease/apt stable 
main" | sudo tee -a /etc/apt/sources.list.d/elastic-7.x-prerelease.list

All that’s left to do is to update your repositories and install Metricbeat:

sudo apt-get update && sudo apt-get install metricbeat

Step 3: Configuring Metricbeat

Before we run Metricbeat, there are a few configurations we need to apply.

First, we need to disable the system module that is enabled by default. Otherwise, we will be seeing system metrics in Kibana collected from our host. This is not mandatory but is recommended if you want to keep a cleaner Kibana workspace.

sudo metricbeat modules disable system

Verify with:

ls /etc/metricbeat/module.d

envoyproxy.yml.disabled     kvm.yml.disabled         postgresql.yml.disabled
aerospike.yml.disabled      etcd.yml.disabled        logstash.yml.disabled   prometheus.yml.disabled
apache.yml.disabled         golang.yml.disabled      memcached.yml.disabled  rabbitmq.yml.disabled
aws.yml.disabled            graphite.yml.disabled    mongodb.yml.disabled    redis.yml.disabled
ceph.yml.disabled           haproxy.yml.disabled     mssql.yml.disabled      system.yml.disabled
couchbase.yml.disabled      http.yml.disabled        munin.yml.disabled      traefik.yml.disabled
couchdb.yml.disabled        jolokia.yml.disabled     mysql.yml.disabled      uwsgi.yml.disabled
docker.yml.disabled         kafka.yml.disabled       nats.yml.disabled       vsphere.yml.disabled
dropwizard.yml.disabled     kibana.yml.disabled      nginx.yml.disabled      windows.yml.disabled
elasticsearch.yml.disabled  kubernetes.yml.disabled  php_fpm.yml.disabled    zookeeper.yml.disabled

The next step is to configure the AWS module.

sudo vim /etc/metricbeat/module.d/aws.yml.disabled

Add your AWS IAM user credentials to the module configuration as follows:

- module: aws
  period: 300s
  metricsets:
    - "ec2"
  access_key_id: 'YourAWSAccessKey'
  secret_access_key: 'YourAWSSecretAccessKey'
  default_region: 'us-east-1'

In this example, we’re defining the user credentials directly but you can also refer to them as env variables if you have defined as such. There is also an option to use temporary credentials, and in that case you will need to add a line for the session token. Read more about these options in the documentation for the module.

The period setting defines the interval at which metrics are pulled from CloudWatch.

To enable the module, use:

sudo metricbeat modules enable aws

Shipping to ELK

To ship the EC2 metrics to your ELK Stack, simply start Metricbeat (the default Metricbeat configuration has a locally Elasticsearch instance defined as the output so if you’re shipping to a remote Elasticsearch cluster, be sure to tweak the output section before starting Metricbeat):

sudo service metricbeat start

Within a few seconds, you should see a new metricbeat-* index created in Elasticsearch:

health status index                                    uuid                   pri rep docs.count docs.deleted store.size pri.store.size
green  open   .kibana_1                                kzb_TxvjRqyhtwY8Qxq43A   1   0        490            2    512.8kb        512.8kb
green  open   .kibana_task_manager                     ogV-kT8qSk-HxkBN5DBWrA   1   0          2            0     30.7kb         30.7kb
yellow open   metricbeat-7.0.0-beta1-2019.03.20-000001 De3Ewlq1RkmXjetw7o6xPA   1   1       2372            0        2mb            2mb

Open Kibana, define the new index patten under Management → Kibana Index Patterns, and you will begin to see the metrics collected by Metricbeat on the Discover page:

Kibana discover

Shipping to Logz.io

By making a few adjustments to the Metricbeat configuration file, you can ship the EC2 metrics to Logz.io for analysis and visualization.

First, you will need to download an SSL certificate to use encryption:

wget https://raw.githubusercontent.com/logzio/public-certificates/
master/COMODORSADomainValidationSecureServerCA.crt

sudo mkdir -p /etc/pki/tls/certs

sudo cp COMODORSADomainValidationSecureServerCA.crt 
/etc/pki/tls/certs/

Next, retrieve your Logz.io account token from the UI (under Settings → General).

Finally, tweak your Metricbeat configuration file as follows:

fields:
  logzio_codec: json
  token: <yourToken>
fields_under_root: true
ignore_older: 3hr
type: system_metrics

output.logstash:
  hosts: ["listener.logz.io:5015"]
  ssl.certificate_authorities: 
['/etc/pki/tls/certs/COMODORSADomainValidationSecureServerCA.crt']

Be sure to enter your account token in the relevant placeholder above and to comment out the Elasticsearch output.

Restart Metricbeat with:

sudo service metricbeat restart

Within a minute or two, you will see the EC2 metrics collected by Metricbeat show up in Logz.io:

33 hits

Step 4: Analyzing EC2 metrics in Kibana

Once you’ve built a pipeline of EC2 metrics streaming into your ELK Stack, it’s time to reap the benefits. Kibana offers rich visualization capabilities that allow you to slice and dice data in any way you want. Below are a few examples of how you can start monitoring your EC2 instances with visualizations.

Failed status checks

CloudWatch performs different types of status checks for your EC2 instances. Metrics for these checks can be monitored to keep tabs on the availability and status of your instances. For example, we can create a simple metric visualization to give us an indication on whether any of these checks failed:

1

CPU utilization

Kibana’s visual builder visualization is a great tool for monitoring time series data and is improving from version to version. The example below gives us an average aggregation of the ‘aws.ec2.cpu.total.pct’ field per instance.

time series

Network utilization

In the example below, we’re using the visual builder again to look at an average aggregation of the ‘aws.ec2.network.in.bytes’ field per instance to monitor incoming traffic. In the Panel Options tab, I’ve set the interval at ‘5m’ to correspond with the interval at which we’re collecting the metrics from CloudWatch.

network utilization

We can do the same of course for outgoing network traffic:

bytes out

Disk performance

In the example here, we’re monitoring disk performance of our EC2 instances. We’re showing an average of the ‘aws.ec2.diskio.read.bytes’ and the ‘aws.ec2.diskio.write.bytes’ fields, per instance:

disk performance

disk write bytes

Summing it up

The combination of CloudWatch and the ELK Stack is a great solution for monitoring your EC2 instances. Previously, Metricbeat would have been required to be installed per EC2 instance. The new AWS module negates this requirement, making the process of shipping EC2 metrics into either your own ELK or Logz.io super-simple.

Once in the ELK Stack, you can analyze these metrics to your heart’s delight, using the full power of Kibana to slice and dice the metrics and build your perfect EC2 monitoring dashboard!

ec2 monitoring dashboard

This dashboard is available in ELK Apps — Logz.io’s library of premade dashboards and visualizations for different log types. To install, simply open ELK Apps and search for ‘EC2’.

Looking forward, I expect more and more metricsets being supported by this AWS module, meaning additional AWS services will be able to be monitored with Metricbeat. Stay tuned for news on these changes in this blog!

monitoring dashboard

Easily customize your EC2 monitoring dashboard with Logz.io's ELK Apps.

Installing the EFK Stack with Kubernetes with GKE

$
0
0

The ELK Stack (Elasticsearch, Logstash and Kibana) is the weapon of choice for many Kubernetes users looking for an easy and effective way to gain insight into their clusters, pods and containers. The “L” in “ELK” has gradually changed to an “F” reflecting the preference to use Fluentd instead of Logstash and making the “EFK Stack” a more accurate acronym for what has become the de-facto standard for Kubernetes-native logging.

While Elasticsearch, Logstash/Fluentd and Kibana can be installed using a variety of different methods, using Kubernetes is becoming more and more popular. The same reasons you’d use Kubernetes to deploy your application — for automanaging and orchestrating the underlying containers — apply here as well, and there are a lot of examples and resources online to make the process easier. 

In this article, I’ll be taking a look at one of these resources — a relatively new app available in GKE’s app marketplace called, rather succinctly, “Elastic GKE Logging”. As the name implies, this app is a turnkey solution for deploying a fully functioning logging solution for Kubernetes comprised of Elasticsearch, Kibana and Fluentd.

As described on the GitHub page, the app deploys an Elasticsearch StatefulSet for the Elasticsearch cluster with a configurable number of replicas, a stateless Kibana deployment and a fluentd DaemonSet that includes predefined configurations for shipping different logs.  


Step 1: Preparing your GKE environment

Before we can proceed with deploying the GKE Logging app from the marketplace, there are some basic steps to take to prepare the ground.

If you’re new to Google Cloud Platform (GCP) and haven’t created a project yet, this is the right time to do so.  Projects are the basis for creating, enabling, and using GCP services, including GKE’s services.

Once you’ve created your GCP project, you will need to create a Kubernetes cluster on GKE. Just follow the steps as outlined in this article. When creating your cluster, I recommend you choose a node size with 4, 8, or 16 CPUs and a cluster size of at least 2. Of course, you can always start with a small setup and then scale up later.

To connect to my GKE cluster with kubectl, I use GCP’s CloudShell service. You can, of course, do the same from your own local terminal in which case you will need to download and set up gcloud.

Next, I find it a good best practice to use dedicated namespaces to separate between different deployments in my Kubernetes cluster. In this case, I’m going to create a new namespace for all our logging infrastructure:

Create a new object file:

sudo vim kube-logging-ns.yaml

Paste the following namespace configuration:

kind: Namespace
apiVersion: v1
metadata:
  name: kube-logging

Save the file, and create the namespace with:

kubectl create -f kube-logging-ns.yaml

Confirm that the namespace was created:

kubectl get namespaces

NAME           STATUS    AGE
default        Active    1d
kube-logging   Active    1m
kube-public    Active    1d
kube-system    Active    1d

Step 2: Deploying the EFK Stack

We’re now ready to deploy our EFK-based logging solution using the Elastic GKE Logging app.

In the GCP console, open the marketplace and search for “Elastic GKE Logging”. You will see only one choice — select it to see more information on the app:

GKE Logging

Hit the Configure button. You’ll now be presented with a short list of configuration options to customize the deployment process:

Logging Overview

  • Cluster – In case you have multiple Kubernetes clusters, select the relevant one for deploying the EFK Stack. In my case, I only have on running in my project so it’s selected by default.
  • Namespace – For your namespace, be sure to select the kube-logging namespace you created in the previous step.
  • App instance name – You can play around with the name for the deployment or simply go with the provided name.
  • Elasticsearch replicas – The default number of replicas for the Elasticsearch ReplicaSet is 2 but for larger environments and production loads I would change this to a higher number.
  • Fluentd Service Account – You can leave the default selection for the fluentd service account.

Click the Deploy button when ready.

GKE will deploy all the components in the app within the namespace and the cluster you defined and within a few minutes will present you with a summary of your deployment:

Application Details

Step 3: Reviewing the deployment

Before we take a look at our Kubernetes logs, let’s take a look at some of the objects created as part of the deployment.

First, the deployment itself:

kubectl get deployment --namespace kube-logging

We can take a closer look at the deployment configuration with:

kubectl describe deployment elastic-gke-logging-kibana --namespace kube-logging

Name:                   elastic-gke-logging-kibana
Namespace:              kube-logging
CreationTimestamp:      Sun, 24 Mar 2019 13:10:09 +0200
Labels:                 app.kubernetes.io/component=kibana-server
                        app.kubernetes.io/name=elastic-gke-logging
Annotations:            deployment.kubernetes.io/revision=2
                        kubectl.kubernetes.io/last-applied-configuration={"apiVersion":"apps/v1beta2","kind":"Deployment","metadata":{"annotations":{},"labels":{"app.kubernetes.io/component":"kibana-server","app.kubernetes.i...
Selector:               app.kubernetes.io/component=kibana-server,app.kubernetes.io/name=elastic-gke-logging
Replicas:               1 desired | 1 updated | 1 total | 1 available | 0 unavailable
StrategyType:           RollingUpdate
MinReadySeconds:        0
RollingUpdateStrategy:  25% max unavailable, 25% max surge
Pod Template:
  Labels:  app.kubernetes.io/component=kibana-server
           app.kubernetes.io/name=elastic-gke-logging
  Containers:
   kibana:
    Image:      gcr.io/cloud-marketplace/google/elastic-gke-logging/kibana@sha256:2d7675a1cc23800ab8040e28cd12f9ccdaceace4c0a2dae4a7802ed6be8964d7
    Port:       5601/TCP
    Host Port:  0/TCP
    Liveness:   http-get http://:5601/api/status delay=5s timeout=1s period=10s #success=1 #failure=3
    Readiness:  http-get http://:5601/api/status delay=5s timeout=1s period=10s #success=1 #failure=3
    Environment:
      ELASTICSEARCH_URL:    http://elastic-gke-logging-elasticsearch-svc:9200
      KIBANA_DEFAULTAPPID:  discover
    Mounts:                 <none>
  Volumes:                  <none>
Conditions:
  Type           Status  Reason
  ----           ------  ------
  Available      True    MinimumReplicasAvailable
  Progressing    True    NewReplicaSetAvailable
OldReplicaSets:  <none>
NewReplicaSet:   elastic-gke-logging-kibana-579db88676 (1/1 replicas created)
Events:          <none>

Diving a bit deeper, we can see that the deployment consists of 3 Elasticsearch pods, a Kibana pod and 3 Fluentd pods deployed as part of the DaemonSet:

kubectl get pods --namespace kube-logging

NAME                                          READY     STATUS      RESTARTS   AGE

elastic-gke-logging-elasticsearch-0           1/1       Running     0          1h
elastic-gke-logging-elasticsearch-1           1/1       Running     0          1h
elastic-gke-logging-elasticsearch-2           1/1       Running     0          1h
elastic-gke-logging-fluentd-es-6hxst          1/1       Running     4          1h
elastic-gke-logging-fluentd-es-sfskc          1/1       Running     5          1h
elastic-gke-logging-fluentd-es-zcl49          1/1       Running     0          1h
elastic-gke-logging-kibana-579db88676-tdqst   1/1       Running     0          1h

The provided configurations applied to the deployment can be viewed with:

kubectl get configmap --namespace kube-logging

NAME                                    DATA      AGE
elastic-gke-logging-configmap           2         1h
elastic-gke-logging-deployer-config     8         1h
elastic-gke-logging-fluentd-es-config   4         1h
elastic-gke-logging-kibana-configmap    6         1h

A closer look at the fluentd ConfigMap reveals the provided log aggregation and processing applied as part of the deployment. Here’s an abbreviated version of this configuration:

kubectl describe configmap elastic-gke-logging-fluentd-es-config --namespace kube-logging

Name:         elastic-gke-logging-fluentd-es-config
Namespace:    kube-logging
Labels:       app.kubernetes.io/component=fluentd-es-logging
              app.kubernetes.io/name=elastic-gke-logging
Annotations:  kubectl.kubernetes.io/last-applied-configuration={"apiVersion":"v1","data":{"containers.input.conf":"\u003csource\u003e\n  @id fluentd-containers.log\n  @type tail\n  path /var/log/containers/*.log\n ...

Data
====
containers.input.conf:
----
<source>
  @id fluentd-containers.log
  @type tail
  path /var/log/containers/*.log
  pos_file /var/log/es-containers.log.pos
  tag raw.kubernetes.*
  read_from_head true
  <parse>
    @type multi_format
    <pattern>
      format json
      time_key time
      time_format %Y-%m-%dT%H:%M:%S.%NZ
    </pattern>
    <pattern>
      format /^(?<time>.+) (?<stream>stdout|stderr) [^ ]* (?<log>.*)$/
      time_format %Y-%m-%dT%H:%M:%S.%N%:z
    </pattern>
  </parse>
</source>

Step 4: Accessing Kibana

The app deploys two ClusterIP type services, one for Elasticsearch and one for Kibana. Elasticsearch is mapped to ports 9200/9300 and Kibana to port 5601:

kubectl get svc --namespace kube-logging

NAME      TYPE        CLUSTER-IP      EXTERNAL-IP   PORT(S)             AGE
elastic-gke-logging-elasticsearch-svc   ClusterIP   10.39.243.235   <none>        9200/TCP,9300/TCP   1h
elastic-gke-logging-kibana-svc          ClusterIP   10.39.254.15    <none>        
5601/TCP            1h

As seen above, the Kibana service does not have an external IP so we need to expose Kibana to be able to access it. To do this from your local terminal, use:

kubectl port-forward --namespace kube-logging svc/elastic-gke-logging-kibana-svc 5601

You will then be able to access Kibana at http://localhost:5601:

kibana

Your next step is of course to begin analyzing your Kubernetes logs. I’m not going to specify the different ways in which Kibana allows you to query and visualize the data, take a look at this article for more information. Suffice to say that within a few minutes, and without too much work on your part, you’ll be able to gain operational visibility into your cluster.

Endnotes

The Elastic GKE Logging app is a nice way to set up Elasticsearch, Kibana and Fluentd on Kubernetes. For production environments, however, you will want to explore more advanced Kubernetes deployment methods.

Separating nodes in different roles for example, with master, data and ingest nodes is a common design pattern that will result in better performance (I experienced some sluggish performance even with a basic configuration). Exposing both Elasticsearch and Kibana using ingress is also a better way of allowing access from the outside to the cluster. You will also need to look into ways of cleaning up your Elasticsearch clusters, with Curator being one way to go.

But again — if you’re just getting started with Kubernetes and want to set up a quick development EFK Stack, this is a great way to go about it.

Get insights into your Kubernetes clusters, pods, and containers with Logz.io.

What’s New in Elastic Stack 6.7

$
0
0

In the midst of all the turmoil and debate around Open Distro for Elasticsearch, Elastic continues to produce, and last week announced both a new major release of the Elastic Stack — version 6.7 (and also the first release candidate for 7.0!). 

So what exactly was released in version 6.7.

As usual, I’ve put together a brief overview of the main features introduced. One change I’ve applied this time is adding a comment for each feature detailing what license it falls under. I’ve encountered increasing confusion over the issue of licensing so hopefully this will help.

Elasticsearch

Elasticsearch 6.7 includes a few new features but the big news in this version is the graduation of a lot of major features that were released in beta mode in previous versions and that are now GA.

Index Lifecycle Management

A beta in version 6.6, Index Lifecycle Management is a super-useful feature that allows you to manage the lifecycle of your Elasticsearch indices more easily. Using API or the new dedicated page in Kibana, you can set rules that define the different phases that your indices go through — hot, warm, cold and deletion. In version 6.7 the ability to manage frozen indices was added (for long term and memory-efficient storage).  

Index Lifecycle Management is available under the Basic license.

Cross-Cluster Replication

A beta in version 6.5, this now-GA feature in Elasticsearch offers cross-cluster data replication for replicating data across multiple datacenters and across multiple regions. This feature followed the steps of other minor updates to Elasticsearch, specifically soft deletes and sequence numbers, and gives users a much easier way to load data into multiple clusters across data centers.

In version 6.7, the ability to replicate existing indices with soft deletes was added, as well as management and monitoring features in Kibana for gaining insight into the replication process.

Cross-Cluster Replication is only available for paid subscriptions.

SQL

A lot of Elasticsearch users were excited to hear about the new SQL capabilities announced way back in Elasticsearch 6.3. The ability to execute SQL queries on data indexed in Elasticsearch had been on the wishlist of many users, and in version 6.5, additional SQL functions were added as well as the ability to query across indices. All of this goodness, as well as the accompanying JDBC and ODBC drivers, is now GA. Additional SQL statements and functions such as the ability to sort groups by aggregates, were also added in this release.

The SQL interface is available under the Basic license. JDBC and ODBC clients are only available for paid subscriptions.

Elasticsearch index management

A series of improvements have been made to managing Elasticsearch indices in the Index Management UI in Kibana. Tags have been added to the index name to be able to differentiate between the different indices (Frozen, Follower, Rollup). It’s also easier now to freeze and unfreeze indices from the same UI in Kibana.

Index management is available under the Basic license.

Upgrading to 7.0

Version 6.7 is the last major version before 7.0 and as such, includes some new features to help users migrate to 7.0 more easily:

  • The Upgrade Assistant in Kibana now allows users to leave the page when performing a reindex operation.
  • Users using the API to upgrade will be pleased to know that the Deprecation Info and Upgrade Assistant APIs were enhanced.
  • Reindexing data from remote clusters is easier, with the added ability to apply custom SSL parameters and added support for reindexing from IPv6 URLs.

The upgrade assistant UI and API are available under the Basic license.

Kibana

Similar to Elasticsearch, a lot of the features announced in version 6.7 are beta features maturing to GA status. Still, there are some pretty interesting new capabilities included as well.

Maps

This brand new page in Kibana is going to take geospatial analysis in Kibana to an entirely new level. Released in beta mode, Maps supports multiple layers and data sources, the mapping of individual geo points and shapes, global searching for ad-hoc analysis, customization of elements, and more.

Maps is available under the Basic license.


Kibana Maps

Source: Elastic.

Uptime

This is another brand new page in Kibana, allowing you to centrally monitor and gauge the status of your applications using a dedicated UI. The data monitored on this page, such as response times and errors, is forwarded into Elasticsearch with Heartbeat, another shipper belonging to the beats family, that can be installed either within your network or outside it — all you have to do is enter the endpoint URLs you’d like it to ping. To understand how to deploy Heartbeat, check out this article.

Uptime is available under the Basic license.

Logs

Logs was announced as a beta feature in version 6.5 and gives you the option to view your logs in a live “console-like” view. The changes made in version 6.7 allow you to configure default index and field names viewed on the page from within Kibana as opposed to configuring Kibana’s .yml file. An additional view can be accessed per log message, detailing all the fields for the selected log message and helping you gain more insight into the event.

Logs is available under the Basic license.

Infrastructure

Another beta feature going GA, the Infrastructure page in Kibana helps you gain visibility into the different components constructing your infrastructure, such as hosts and containers. You can select an element and drill further to view not only metrics but also relevant log data.

Infrastructure is available under the Basic license.

Canvas

What I call the “Adobe Photoshop” of the world of machine data analytics — Canvas — is now GA. I had the pleasure of covering the technology preview a while back, and am super excited to see how this project has progressed and finally matured.

Canvas is available under the Basic license.

Beats

Not a lot of news for beats lovers in this release as I expect most of the new goodies will be packaged in version 7.0.

Functionbeat

Functionbeat — a serverless beat that can be deployed on AWS Lambda to ship logs from AWS CloudWatch to an Elasticsearch instance of your choice — is now GA. For triggering the function, you can use either CloudWatch, SQS events, and from version 6.7 — Kinesis streams.

New datasets in Auditbeat

The system module in Auditbeat was improved and supports new datasets and data enhancements, such as a login dataset that collects login information, a package dataset that collects information on installed DEB/RPM and Homebrew packages, and the addition of a new entity_id field to datasets.

Endnotes

What about Logstash? The only news here is that there is no news. It seems that the long-awaited Java execution engine (better performance, reduced memory usage) is still in the works and hopefully will go GA in version 7.0.

As always, be careful before upgrading. Some of the features listed are still in beta so keep that in mind before upgrading. Read the breaking changes and release notes carefully as well as the licensing information.

Looking for maintenance-free ELK? Try Logz.io's fully managed ELK as a service.

How to Install the ELK Stack on AWS: A Step-By-Step Guide

$
0
0

The ELK Stack is a great open-source stack for log aggregation and analytics. It stands for Elasticsearch (a NoSQL database and search server), Logstash (a log shipping and parsing service), and Kibana (a web interface that connects users with the Elasticsearch database and enables visualization and search options for system operation users). With a large open-source community, ELK has become quite popular, and it is a pleasure to work with.

In this article, we will guide you through the simple installation process for installing the ELK Stack on Amazon Web Services.

The following instructions will lead you through the steps involved in creating a working sandbox environment. Due to the fact that a production setup is more comprehensive, we decided to elaborate on how each component configuration should be changed to prepare for use in a production environment.

We’ll start by describing the environment, then we’ll walk through how each component is installed, and finish by configuring our sandbox server to send its system logs to Logstash and view them via Kibana.

The AWS Environment

We ran this tutorial on a single AWS Ubuntu 16.04 instance on an m4.large instance using its local storage. We started an EC2 instance in the public subnet of a VPC, and then we set up the security group (firewall) to enable access from anywhere using SSH and TCP 5601 (Kibana). Finally, we added a new elastic IP address and associated it with our running instance in order to connect to the internet.

Production tip: A production installation needs at least three EC2 instances — one per component, each with an attached EBS SSD volume.

Installing Elasticsearch

Elasticsearch is a widely used database and a search server, and it’s the main component of the ELK setup.

Elasticsearch’s benefits include:

  • Easy installation and use
  • A powerful internal search technology (Lucene)
  • A RESTful web interface
  • The ability to work with data in schema-free JSON documents (noSQL)
  • Open source

There are various ways to install Elasticsearch but we will be using DEB packages.   

To begin the process of installing Elasticsearch, add the following repository key:

wget -qO - https://artifacts.elastic.co/GPG-KEY-elasticsearch | sudo apt-key add -

Install the apt-transport-https package:

sudo apt-get install apt-transport-https

Add the following Elasticsearch list to the key:

echo "deb https://artifacts.elastic.co/packages/7.x/apt stable main" | sudo tee -a /etc/apt/sources.list.d/elastic-7.x.list
sudo apt-get update

To install a version of Elasticsearch that contains only features licensed under Apache 2.0, use:

echo "deb https://artifacts.elastic.co/packages/0ss-7.x/apt stable main" | sudo tee -a /etc/apt/sources.list.d/elastic-7.x.list sudo apt-get update

Update your system and install Elasticsearch with:

sudo apt-get update 
sudo apt-get install elasticsearch

Open the Elasticsearch configuration file at: /etc/elasticsearch/elasticsearch.yml, and apply the following configurations:

network.host: "localhost"
http.port: 9200
cluster.initial_master_nodes: ["<PrivateIP"]

Start the Elasticsearch service:

sudo service elasticsearch start

Verify the installation by cURLing:

sudo curl http://localhost:9200

If the output is similar to this, then you will know that Elasticsearch is running properly:

{
 "name" : "ip-172-31-49-60",
 "cluster_name" : "elasticsearch",
 "cluster_uuid" : "yP0uMKA6QmCsXQon-rxawQ",
 "version" : {
   "number" : "7.0.0",
   "build_flavor" : "default",
   "build_type" : "deb",
   "build_hash" : "b7e28a7",
   "build_date" : "2019-04-05T22:55:32.697037Z",
   "build_snapshot" : false,
   "lucene_version" : "8.0.0",
   "minimum_wire_compatibility_version" : "6.7.0",
   "minimum_index_compatibility_version" : "6.0.0-beta1"
 },
 "tagline" : "You Know, for Search"
}

To make the service start on boot run:

sudo update-rc.d elasticsearch defaults 95 10

Production tip: DO NOT open any other ports, like 9200, to the world! There are many bots that search for 9200 and execute groovy scripts to overtake machines. DO NOT bind Elasticsearch to a public IP.

Installing Logstash

Logstash is an open-source tool that collects, parses, and stores logs for future use and makes rapid log analysis possible. Logstash is useful for both aggregating logs from multiple sources, like a cluster of Docker instances, and parsing them from text lines into a structured format such as JSON. In the ELK Stack, Logstash uses Elasticsearch to store and index logs.
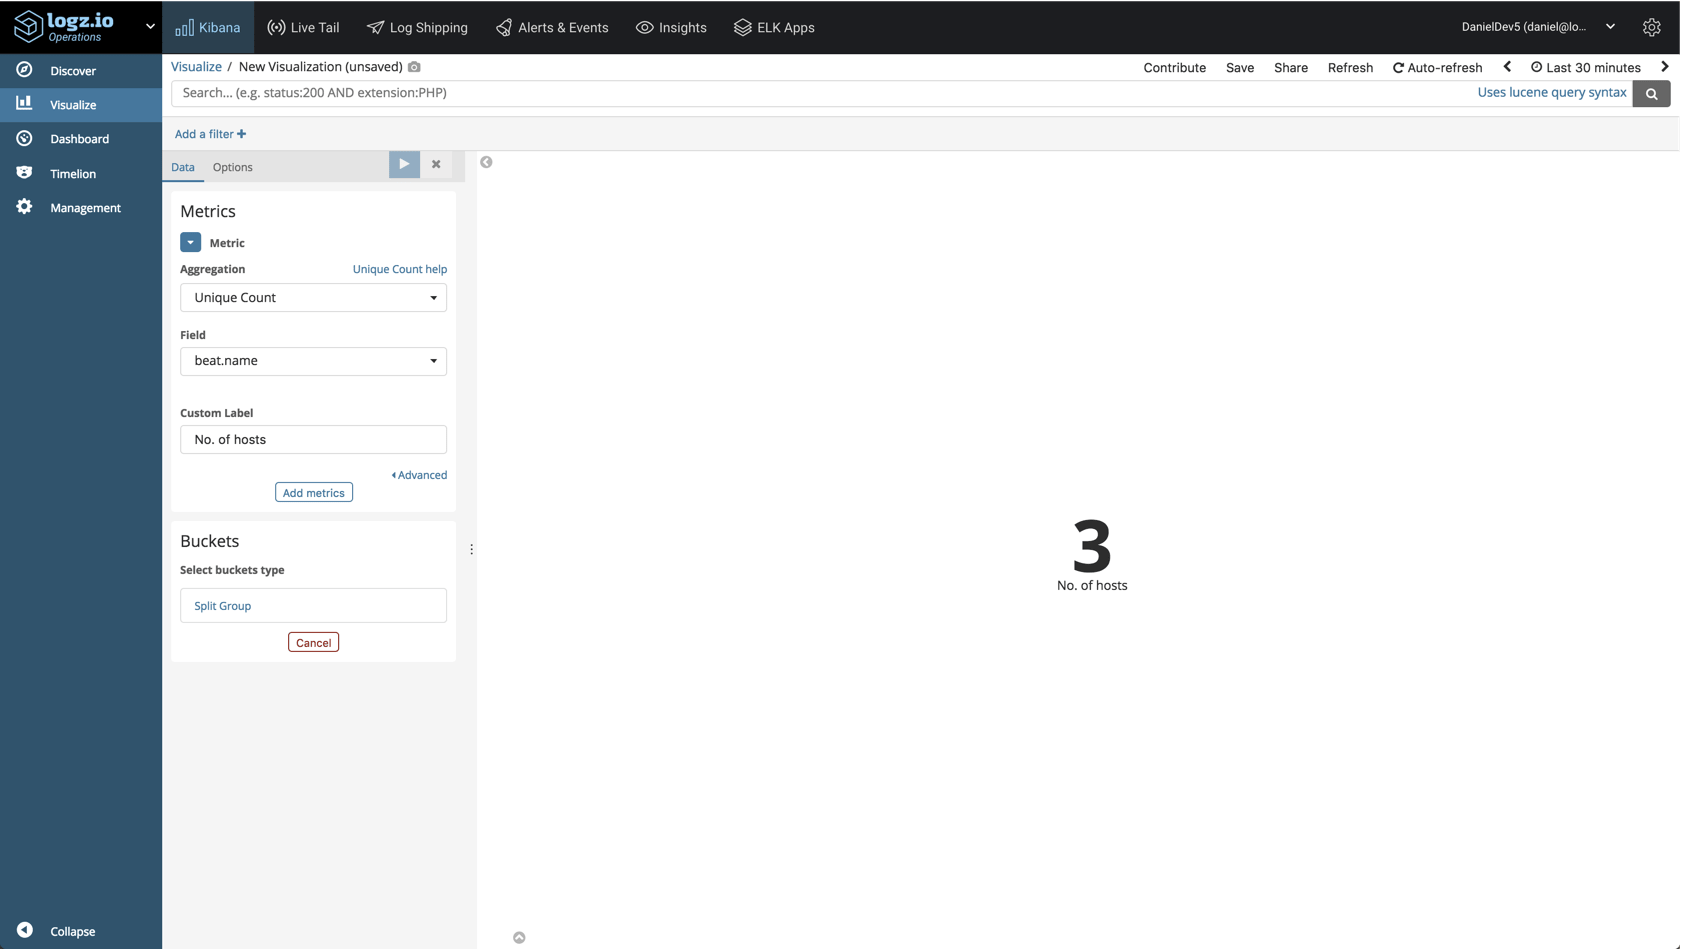
Installing Java

Logstash requires the installation of Java 8 or Java 11:

sudo apt-get install default-jre

Verify that Java is installed:

java -version

If the output of the previous command is similar to this, then you’ll know that you’re heading in the right direction:

openjdk version "1.8.0_191"
OpenJDK Runtime Environment (build 1.8.0_191-8u191-b12-2ubuntu0.16.04.1-b12)
OpenJDK 64-Bit Server VM (build 25.191-b12, mixed mode)

Install Logstash with:

sudo apt-get install logstash

Example pipeline: Collect Apache Access Logs with Logstash

For the purpose of this tutorial, we’ve prepared some sample data containing Apache access logs that is refreshed daily. You can download the data here: https://logz.io/sample-data

Create a Logstash configuration file:

sudo vim /etc/logstash/conf.d/apache-01.conf

Enter the following configuration:

input {
  file {
    path => "/home/ubuntu/apache-daily-access.log"
  start_position => "beginning"
  sincedb_path => "/dev/null"
  }
}

filter {
  grok {
    match => { "message" => "%{COMBINEDAPACHELOG}" }
  }
  date {
    match => [ "timestamp" , "dd/MMM/yyyy:HH:mm:ss Z" ]
  }
  geoip {
    source => "clientip"
  }
}

output {
  elasticsearch { 
  hosts => ["localhost:9200"] 
  }
}

This file is telling Logstash to collect the local /home/ubuntu/apache-daily-access.log file and send it to Elasticsearch for indexing.

The input section specifies which files to collect (path) and what format to expect. The filter section is telling Logstash how to process the data using the grok, date and geoip filters. The output section defines where Logstash is to ship the data to – in this case, a local Elasticsearch.

In this example, we are using localhost for the Elasticsearch hostname. In a real production setup, however, the Elasticsearch hostname would be different because Logstash and Elasticsearch should be hosted on different machines.
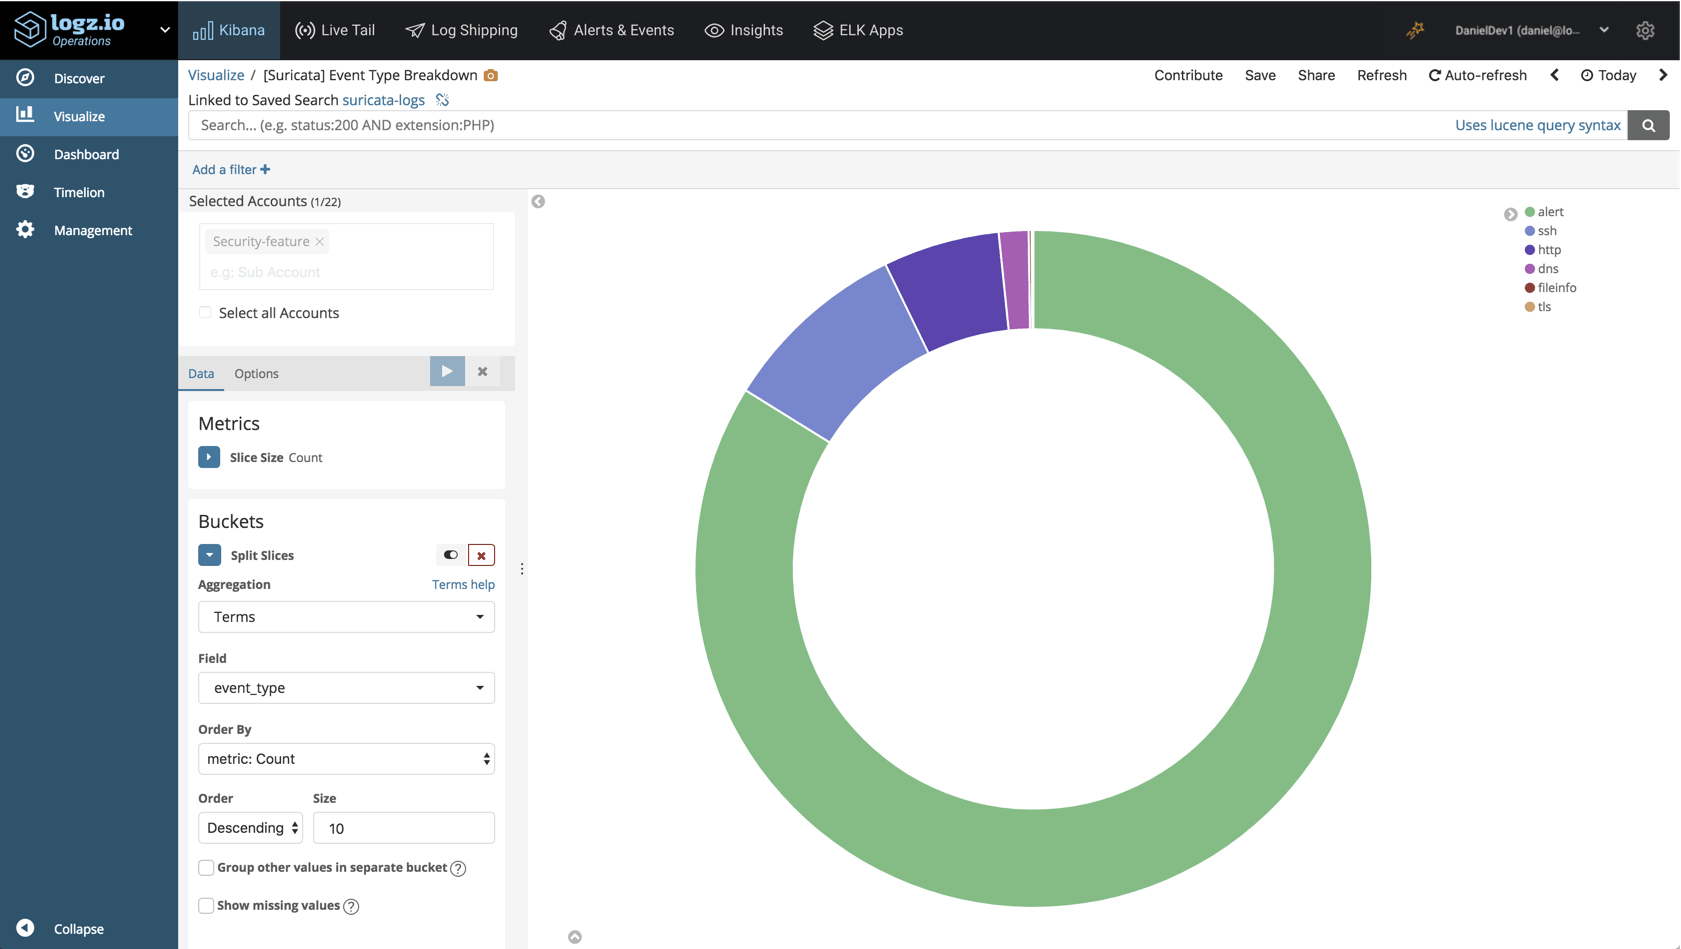
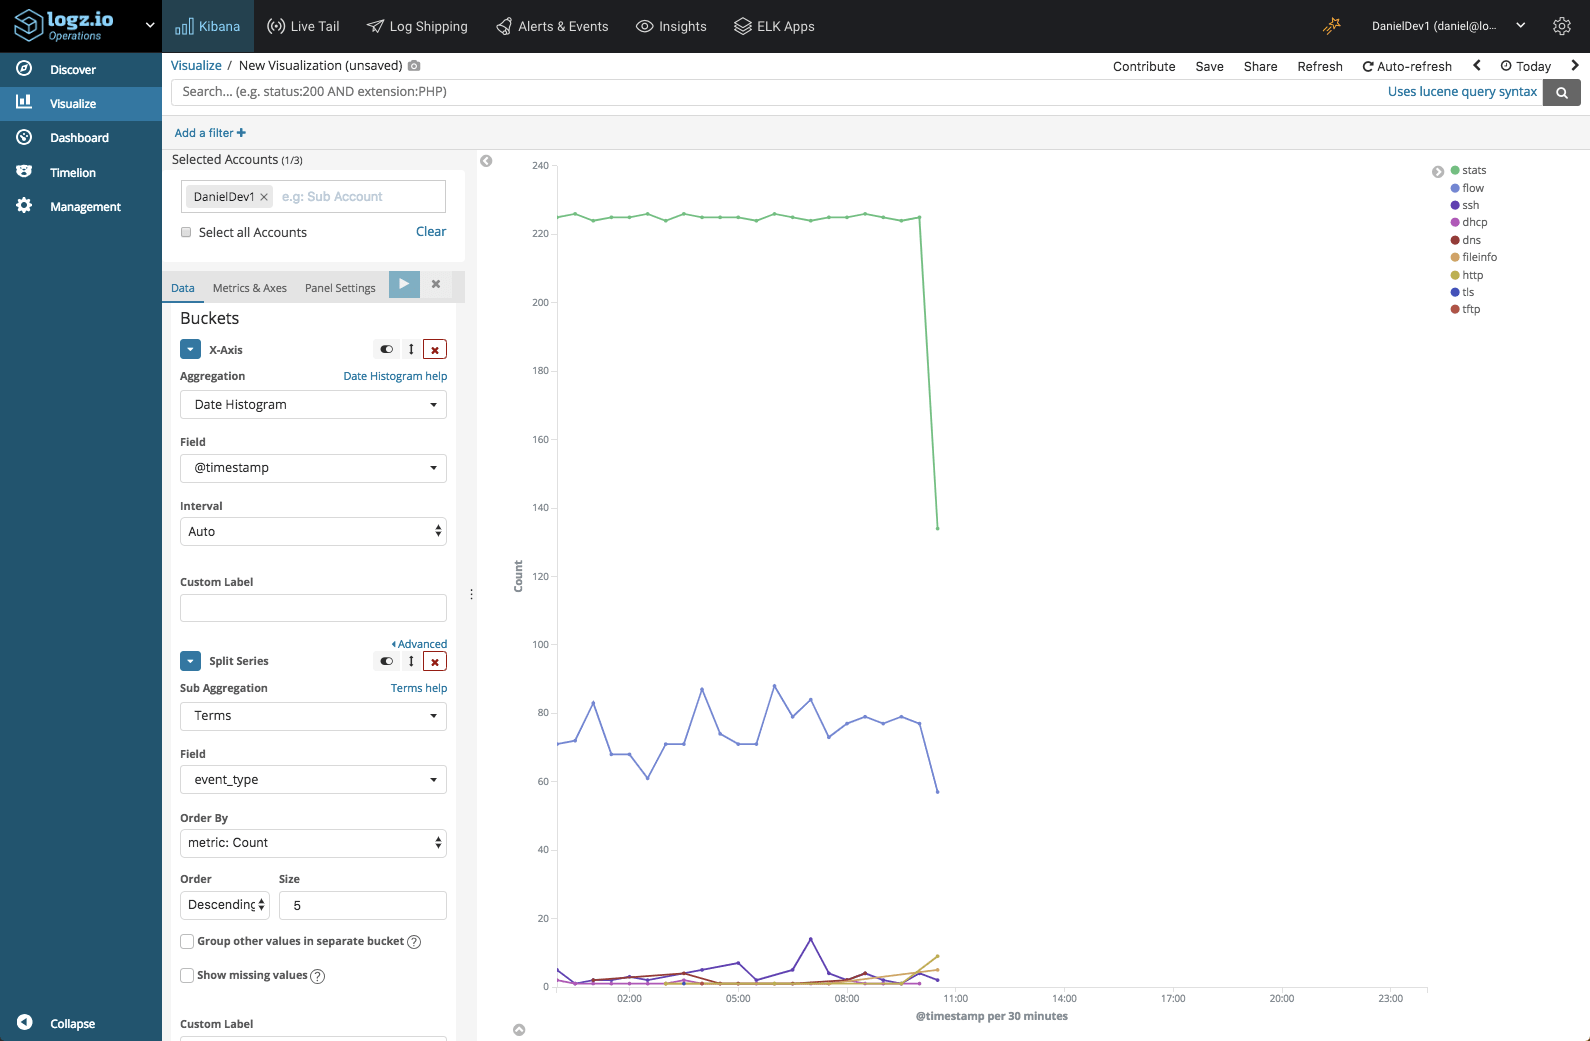
Production tip: Running Logstash and Elasticsearch is a very common pitfall of the ELK stack and often causes servers to fail in production. You can read some more tip on how to install ELK in production.

Finally, start Logstash to read the configuration:

sudo service logstash start

To make sure the data is being indexed, use:

sudo curl -XGET 'localhost:9200/_cat/indices?v&pretty'

You should see your new Logstash index created:

health status index                      uuid                   pri rep docs.count docs.deleted store.size pri.store.size
yellow open   logstash-2019.04.16-000001 rfA5aGYBTP6j27opDwD8VA   1   1          4168            0       230b           230b


You can set up your own ELK stack using this guide or try out our simple ELK as a Service solution.


Installing Kibana

Kibana is an open-source data visualization plugin for Elasticsearch. It provides visualization capabilities on top of the content indexed on an Elasticsearch cluster. Users can create bar, line, and scatter plots; pie charts; and maps on top of large volumes of data.

Among other uses, Kibana makes working with logs super easy and even fun, and its graphical web interface lets beginners execute powerful log searches.

To install Kibana, use this command:

sudo apt-get install kibana

Open the Kibana configuration file and enter the following configurations:

sudo vim /etc/kibana/kibana.yml

server.port: 5601
server.host: "localhost"
elasticsearch.url: "http://localhost:9200"

Start Kibana:

sudo service kibana start

Test:

Point your browser to ‘http://YOUR_ELASTIC_IP:5601’ after Kibana is started (this may take a few minutes).

You should see a page similar to this:

Your next step in Kibana is to define an Elasticsearch index pattern.

What does an “index pattern” mean, and why do we have to configure it? Logstash creates a new Elasticsearch index (database) every day. The names of the indices look like this: logstash-YYYY.MM.DD — for example, “logstash-2019.04.16” for the index we created above on April 16, 2019.

Kibana works on top of these Elasticsearch indices, so it needs to know which one you want to use. Go to Management -> Kibana Index Patterns. Kibana automatically identifies the Logstash index, so all you have to do is define it with ‘logstash-*:


In the next step, we will select the @timestamp timestamp field, and then click the “Create index pattern” button to define the pattern in Kibana.

Production tip: In this tutorial, we are accessing Kibana directly through its application server on port 5601, but in a production environment you might want to put a reverse proxy server, like Nginx, in front of it.

To see your logs, go to the Discover page in Kibana:

As you can see, creating a whole pipeline of log shipping, storing, and viewing is not such a tough task. In the past, storing, and analyzing logs was an arcane art that required the manipulation of huge, unstructured text files. But the future looks much brighter and simpler.

Monitor and Secure your AWS Environment with Logz.io
Viewing all 198 articles
Browse latest View live