Quantcast
Channel: Daniel Berman is Product Evangelist at Logz.io
Viewing all 198 articles
Browse latest View live

Announcing the Logz.io Community

$
0
0

We are happy to announce the official launch of the Logz.io Community — a space for like-minded professionals dealing with the same challenges involved in developing, monitoring and troubleshooting business-critical apps and services.

If you find yourself knee-deep in log data, or building a monitoring dashboard, or trying to figure out which logging library to use for your app, or deliberating which log aggregator to use for your environment (I could go on but will stop here) — this is the right place for you.

Our mission

As human beings, and perhaps contrary to common beliefs, we thrive in the state of human communion — it allows us to communicate, to learn from one another and to develop. As professionals, we look for communal knowledge and expertise to stay up to date with the latest technologies and methodologies and successfully overcome professional obstacles we come across.

These simple facts of life are the reason behind the proliferation of online community groups and professional events. StackOverFlow and Meetup.com are great examples of how community knowledge is accumulated and leveraged by millions of individuals worldwide facing the exact same challenges.

At Logz.io, we have found these facts to be the driving factor behind successful events we have held in the past — whether ELK meetups or customer advisory boards. The most interesting discussions that took place were between the participants themselves, about the day-to-day challenges they faced and the solutions they found for overcoming them.

The Logz.io Community aims at providing members with the tools to learn from peers, share knowledge and skills, and stay up-to-date with the latest monitoring and logging news from Logz.io and from the online community.

Joining the party

The Logz.io Community is an open Slack workspace for Logz.io users and the community as a whole. To join, simply go to: http://community-slack.logz.io/, and enter an email address to receive your invite.

The Logz.io Community has a bunch of interesting channels but I’ll leave the exploration work to you.

As a teaser, here are few interesting channels to check out:

  • #reading-club – latest articles published on the Logz.io blog and other industry-related pieces of content. Wrote a relevant article? This is the place to share with the community!
  • #opensource – updates on Logz.io’s open source projects. PRs, forks, commits — you will be updated
  • #integrations – news and updates on new ways to ship data into Logz.io. Wrote a new shipper? Share the news.
  • #introductions – want to say hello and introduce yourself? This is the place to meet new friends.

Ground rules

Any game has rules, and to make sure this playground is a pleasant place to hang out there are some basic rules of conduct that we ask our members to abide by. Bottom line — be nice, be supportive, collaborate.

The full list of guidelines can be found here: https://github.com/logzio/community/tree/master/conduct-and-terms

The Logz.io Community is currently moderated by yours truly and my colleague, Quintessence Anx.

One last comment for Logz.io users. This community is not a support forum. To receive official support from Logz.io’s amazing support engineers, the regular channels should be used.

Looking forward to seeing you there!

The annoying truth about cliches is that they are based on simple, fact-of-life truths. In the context of the new Logz.io Community, I would like to mention the following two cliches: “There is power in numbers”, and “sharing is caring”.

As members of numerous online communities built for supporting some of the most amazing technological projects, we’ve witnessed firsthand the immense value found by members of these groups in peer-to-peer conversations and relationships. We are looking forward to being part of these professional, and ultimately — very human, interactions.

See you all there!


Diving Deeper into the Rabbit Hole with Alice — Logz.io’s Slack Bot

$
0
0

The adoption of ChatOps — i.e. connecting an organization’s software delivery cycle and day to day operations to chat channels — has grown over the past few years. Facilitating cross-team communication and collaboration, Slack has become the most popular tool for implementing ChatOps-driven work practices.

At Logz.io, ChatOps and Slack are an integral part of our organizational procedures and culture, and we are now happy to inform our users that they can now use a new Logz.io Slack Bot called Alice to join the ChatOps revolution.

Similar to Alice’s adventures in wonderland, this bot allows Logz.io users to dive deeper into the rabbit hole and perform Elasticsearch queries, see the alerts triggered in their environment and get a snapshot of a Kibana visualization and dashboard. Alice is based on Logz.io’s public API and we intend to add support for more and more API methods in the near future.

Note: If you do not have API access, you’ll need to request it to work with Alice.  

Getting Started with Alice

Getting started with Alice is easy. You’ll find her listed in Slack’s app directory (sign into the directory with your workspace credentials):

Install

All you have to do now is hit the green Install button. You’ll be asked to authorize the installation, after which Alice will be installed and added to your workspace. You will then be prompted, in Slack,  to set it up.

configure

Click Yes, and you will be presented with a Logz.io Configuration dialog.

region

There are two details you will need to configure the bot — the AWS region in which your account is deployed (either US or EU), and an API token.

If you’re not sure what AWS region your Logz.io account is deployed in, just check the login URL you use for accessing Logz.io – app.logz.io means your account is deployed in US, app-eu.logz.io means you are in the EU.

To retrieve an API token, click the cogwheel icon in the top-right corner of the Logz.io UI, go to the Tools –> API Tokens, and create a new API token.

API Tokens

Once you save the configuration, the app will be installed and added to your Slack workspace (the settings can be changed at any point in time using the setup command).

You will now be able to issue commands to Alice for interacting with your data and your Logz.io account. You can add Alice to a specific channel (just tag @Alice) or issue commands from the app itself in Slack.

If you ever need to change the name of the bot in your Slack org, for example if you already have an Alice user and want to prevent confusion, just go to the app’s management page and click the edit pencil in the Bot User section.


App Homepage

Use the help command to see a list of all the available commands and their syntax:

Alice Help

Querying Elasticsearch with Alice

Using the search command, you can use the bot to search for specific log messages. To do this, you will need to stick to Lucene syntax. Note that the search command requires enclosing the query with the ‘`’ character.

For example, let’s search for Apache error response codes:

Query

By default, the results displayed show matching logs from the last 15 minutes. Specify a timeframe if you want to be more specific.

For example:

@Alice search `type:apache_access AND response:[400 TO *]` from now to 
now-30m

Viewing a Kibana snapshot

Last year we released Kibana Snapshots, a feature that allows users to easily share snapshots of a Kibana visualization or dashboard to an endpoint of their choice. Using our API, users can programmatically create and send Kibana snapshots.

Alice also supports the creation of snapshots so you can view a specific visualization or dashboard at any time.

First, use the get command to see a list of your Kibana objects. You can select to see a list of searches, visualizations or dashboards.

get dashboards

Choose the dashboard you want to see a snapshot of from the list, and use the snapshot command as follows:

ELB

Note the usage of  a ‘-’ between words in the dashboard name and the usage of the timeframe parameter.

Viewing alerts

You can use the bot to see the most recent alerts triggered in your environment. The get triggered alerts command will result in the last five alerts triggered in the system — their name, severity and when they were triggered.

alert

It’s open source!

Being mission-critical to DevOps and Operations teams means our users need an easy and seamless way to interact with the data they are collecting from their environment. Organizations using Logz.io and Slack now have a tool that enables them to do just that.

As mentioned above, we will be improving Alice by adding support for additional API methods. In the meantime, we welcome your feedback. Alice is based on BotKit and is open source, so feel free to customize it to your needs, change its behavior and send us pull requests.

Enjoy!

Looking for a scalable and easy-to-use ELK solution? Try Logz.io!

Getting Started with Kibana Advanced Searches

$
0
0

Kibana is an extremely versatile analysis tool that allows you to perform a wide variety of search queries to find the data you’re interested in and build beautiful visualizations and dashboards on top of these queries.

In a previous article, we covered some basic querying types supported in Kibana, such as free-text searches, field-level searches and using operators. In some scenarios however, and with specific data sets, basic queries will not be enough. They might result in a disappointing “No results found” message or they might result in a huge dataset that is just as frustrating.

This is where additional query types come in handy.

While often defined as advanced, they are not difficult to master and often involve using a specific character and understanding the syntax. In this article, we’ll be describing some of these searches — wildcards, fuzzy searches, proximity searches, ranges, regex and boosting.

Wildcards

In some cases, you might not be sure how a term is spelled or you might be looking for documents containing variants of a specific term. In these cases, wildcards can come in handy because they allow you to catch a wider range of results.

There are two wildcard expressions you can use in Kibana – asterisk (*) and question mark (?). * matches any character sequence (including the empty one) and ? matches single characters.

For example, I am shipping AWS ELB access logs which contain a field called loadbalancer. A production instance is spelled incorrectly as ‘producation’ and searching for it directly would not return any results. Instead, I will use a wildcard query as follows:

type:elb AND loadbalancer:prod*

I could also use the ? to replace individual characters:

type:elb AND loadbalancer:prod?c?tion

Since these queries are performed across a large number of terms, they can be extremely slow. Never start your query with * or ? and try and be as specific as possible.  

Fuzzy searches

Fuzzy queries searches for terms that are within a defined edit distance that you specify in the query. The default edit distance is 2, but an edit distance of 1 should be enough for catching most spelling mistakes. Similar to why you would use wildcards, fuzzy queries will help you out when you’re not sure what a specific term looks like.

Fuzzy queries in Kibana are used with a tilde (~) after which you specify the edit distance. In the same example above, we can use a fuzzy search to catch the spelling mistake made in our production ELB instance.

Again, without using fuzziness, the query below would come up short:

type:elb AND loadbalancer:productio

But using an edit distance of 2, we can bridge the gap and get some results:

type:elb AND loadbalancer:productio~2

Proximity searches

Whereas fuzzy queries allow us to specify an edit distance for characters in a word, proximity queries allow us to define an edit distance for words appearing in a different order in a specific phrase.

Proximity queries in Kibana are also executed with a tilde (~) following the words you are looking for in quotation marks. As with fuzzy queries, you define the edit distance after the ~.

For example, say you’re looking for a database error but are not sure what the exact message looks like. Using a free-text query will most likely come up empty or display a wide range of irrelevant results, and so a proximity search can come in handy in filtering down results:

"database error"~5

Kibana

Boosting

Boosting in queries allows you to make specific search terms rank higher in importance compared to other terms.

To boost your queries in Kibana, use the ^ character. The default boost value is 1, where 0 and 1 reduce the importance, or weight, you want to apply to search results. You can play around with this value for better results.

error^2 database api^6

Regular expressions

If you’re comfortable with regular expressions, they can be quite an effective tool to use in queries. They can be used, for example, for partial and case-insensitive matching or searching for terms containing special characters.

To embed regular expressions in a Kibana query, you need to wrap them in forward-slashes (“/”).

In this example, I’m looking for IPs in the message field:

message:/[0-9]{1,3}\.[0-9]{1,3}\.[0-9]{1,3}\.[0-9]{1,3}/

Below, I’m searching apache access logs for requests containing a specific search URL:

request:/\/search\/.*/

I recommend reading up on the syntax and the allowed characters in the documentation. Elasticsearch uses its own regex flavor that might be a bit different from what you are used to working with.  

Keep in mind that queries that include regular expressions can take a while since they require a relatively large amount of processing by Elasticsearch. Depending on your query, there may be some effect on performance and so, if possible, try and use a long prefix before the actual regex begins to help narrow down the analyzed data set.

Ranges

Ranges are extremely useful for numeric fields. While you can search for a specific numeric value using a basic field-level search, usually you will want to look for a range of values.

Using Apache access logs again as an example, let’s say we want to look for a range of response error codes:

  • response: [400 TO 500] – searches for all response errors ranging between code 400 and 500, with the specified values included in results.
  • response : [400 TO 500}– searches for all response errors ranging between code 400 and 500, with 500 excluded from the results.
  • response:[400 TO *]– searches for all response errors ranging from code 400 and above.
  • response:>400 – searches for all response errors ranging from code 400 and above, excluding 400 from the results.
  • response:<400 – searches for all response errors ranging from code 400 and below, excluding 400 from the results.
  • response:>=400 searches for all response errors ranging from code 400 and above, including 400 in the results.
  • response:<=400 searches for all response errors ranging from code 400 and below, including 400 in the results.

Bonus – non-existing fields

To wrap up this article, I thought I’d mention two methods to quickly look for documents that either contain a field or do not contain a field. This can be useful if you’re acquainted with the structure of your logs and want to narrow down results quickly to specific log types.

  • _missing_ – searches for all documents that DO NOT contain a specific field, or that contain the field but with a null value.
  • _exists_ – searches for all documents that DO contain a specific field with a non-null value.

As always with learning a new language — mastering Kibana advanced searches is a matter of trial and error and exploring the different ways you can slice and dice your data in Kibana with queries.

I’ll end this article with two tips. First, the better your logs are structured and parsed, the easier the searching will be. Second, before you start using advanced queries, I also recommend understanding how Elasticsearch indexes data and specifically — analyzers and tokenizers.

There are so many different ways of querying data in Kibana — if there is an additional query method you use and find useful, please feel free to share it in the comments below.

Happy querying!

Check out our Additional Features for Kibana.

10 Cloud Migration Best Practices

$
0
0

With the increasing benefits of using the cloud, more and more organizations are migrating over their workloads. The key driver for this migration is the adoption of technology across every business vertical. With technology adoption, the investment in resources increases significantly.

At the start, organizations decided to host their infrastructure in their data center mainly due to flexibility and security reasons. But with the evolution of the cloud, rapidly changing business demands, and evolving technology, more and more organizations want to avoid upfront investment and adopt the flexibilities and agility offered by the cloud. The key driving factors are reduced operational costs, minimized hardware refresh cost, business agility, an adopted service model rather than building things from the ground up, and reduced operational risks.

However, cloud adoption is not a straightforward path. Migration of enterprise legacy applications or rehosting the infrastructure from the data center to the cloud can quickly go south if not planned properly. Even if they can successfully pull this off, they might end up operating the same way. It is important to continuously refine the infrastructure and adopt cloud design principles to leverage the real benefits of the cloud.

This article focuses on best practices that can help organizations make the migration to the cloud more successful.

Identify a Migration Strategy

A migration strategy is the most critical component for an active migration of infrastructure and applications to the cloud. A migration strategy starts with preparation and clear business justification for the migration. Gartner published the 5 “R’s” which organizations can use to map out a migration strategy.

Rehost – The rehost strategy is also known as the “lift and shift” strategy. Typically, this strategy is chosen by an organization that wants to perform a quick migration of their application to the cloud for business use case purposes. Another common reason organizations choose the rehost strategy is to provide skill development time for the team.

Replatform – The re-platform strategy is also known as “lift, thinker, and shift.” As a part of this strategy, the core architecture remains the same. However, this is a quick change that reduces the management and operations overhead and might save on costs. An example of this strategy would be moving the databases to a managed database service provided by the cloud providers or from one application server to another to save on licensing costs.

Repurchase – The repurchase strategy is also known as the “drop and shop.” Here, organizations might decide to entirely shift from one product to another to meet the needs of a business use case and leverage the latest features and capabilities. For example, moving from one CMS platform to another, or leveraging a SaaS solution instead of homegrown products.

Refactoring or Re-Architecting – This is a problematic strategy to choose, but it eventually becomes one of the most rewarding for organizations. Often, when the existing application environment is not able to provide features, scale, and performance organizations choose to refactor or re-architect their entire applications to meet the needs of a business use case which can help improve agility and business prospects.

Retire – This strategy is chosen as part of the discovery phase by organizations as they find that 10%–20% of resources are not used at all and can be quickly gotten rid of when migration to the cloud is complete.

Discovery and Component Elimination

There is no rule that only one of the cloud strategies is as a part of the migration strategy. A key focus should be around the discovery of the resources and applications running in the data center. The discovery phase is not only limits identifying resources, but also the link or dependency between them. Once the discovery is complete, the next step is to determine the what needs to be migrated and what can be retired. Organizations should look at the component elimination part of the re-platform strategy and identify the architecture components which can easily be replaced by services provided by cloud providers.

For example, instead of running the master-slave MySQL database infrastructure, organizations can choose to use a managed database service. Or, instead of running the SMTP server for sending emails, organizations can choose to use the email service provided by the cloud providers. This re-platform approach helps to reduce the actual cloud migration footprint and helps to experience the benefits and agility made available by the cloud providers.

Licensing and Migration Cost

License management is one of the most critical areas for cloud migration. The license management aspects apply to various areas of the environment, i.e., operating system licenses, application server licenses, and third-party tool licenses. As a part of the migration plan, organizations should validate whether the licenses can be moved or converted to cloud-based licenses or not. For operating system licenses, the cloud provider instance cost includes the license cost. However, some cloud providers offer an option to apply the windows licenses at the host level. Third-party tools and companies are still figuring out the best model for license management on both the on-premise and cloud. Usually, in the data center, the same license can be shared by multiple applications as they sit on the same hardware, but in the cloud world, the application is spread across multiple servers. Product companies are continuously trying to refine the license management as it gets complicated when the resources are added and removed based on the traffic load.

As part of the migration plan, the next set of vital questions involves choosing between bring your own license (BYOL) model or using pay-per-use model licenses from the cloud provider or marketplace. Each model has its benefits, and these should be figured out as part of the migration plan to avoid a significant shift in the plan. Lastly, the migration tool cost should be carefully evaluated. The cloud provider provides their own set of services, but any third-party cost should be accounted for too.

Network Management

It is a best practice to design an entire cloud architecture before starting the migration and map the resources to their respective areas or subnets. The cloud provides the capability to create a virtual private cloud or network and allows you to create subnets with the required IP blocks, define IP addresses for the resources, and establish the routing between them. In most cases, for the continuity of the functionality,  the legacy application components should have the same IP address as the components depend on the IP address for the connectivity.

For seamless migration and switchover, the resources are mapped to the same domain name and precise communication is sent to all the stakeholders to avoid any confusion.

Team Technical Expertise

A team’s expertise defines the success of an organization’s cloud migration journey. The end goal for the team remains the same—whether running on the cloud or data center—the effective management of resources to keep applications up and running and meet the business goals.

However, it is the journey that matters. The abstraction introduced by the cloud and its design principles are entirely different from on-premise, and it is essential to train and develop this skill set across teams (operations, development, design) so that they can quickly adapt.

Training and developing this skill set takes time and, to speed up the migration activity, organizations might take on a new team with the required skill set or leverage a managed services provider with migration expertise who will have developed a template and automation around the migration which can quickly address complexities and align with the plan.

Access Management

Enterprises have their centralized security access mechanism to grant access to individuals across the server farm or the application. They allow functional role-based access to the team members. When stepping into the cloud world, the access management is different from the norm and plans should be put in place so that the teams have the right and minimal privileges necessary to do their work. The cloud does provide the capability to link the centralized access management with cloud services so that there are no access issues. Also, access governance policies should be put in place as the part of the migration phase.

Start Small

For the entire migration activity to be successful, it is always advisable to start small. Organizations should choose a small application, come up with a migration plan, and migrate. It helps them to identify gaps so that they can refine their master migration plan. This activity will also aid in making the technical staff more comfortable with cloud services and does mindset shift by allowing the stakeholders to see the benefits of the cloud migration.

Identify Repeated Items and Automate Them

Cloud automation provides us with the ability to build infrastructure as code and automatically deploy the applications without any downtime. The same thought process can be infused during the migration strategy too. During the migration of multiple applications, organizations come across repeatable patterns, and it is recommended to automate them. It will cut down on migration time, provide more consistency, and spread an automation thought process across the teams so that they can see the real benefit of moving to the cloud.

Monitoring and Governance

During the cloud migration or post-migration phase, the environment should be carefully examined and monitored. It is not always the case that an application behaves in the same manner as it did in the data center because architecture components can change. The application, system, network, and audit logs should be captured and carefully examined along with the data provided by the monitoring dashboard to perform a correlation between the various components, and visualize and identify the enhancement areas so that better benefits can be derived. A simple example would be looking at the resource utilization pattern and right-sizing the servers so that the cost of the infrastructure can be brought down.

Be Agile

Organizations should adopt the agile methodology and work in sprints to perform mass migrations in addition to providing continuous learning and improvement to the entire migration process. The agile methodology is not only applicable to organizations themselves, but even to the MSPs partners. Organizations should enable their team to quickly pass on feedback on the things that are working and not working so that necessary corrections are made, and everyone is on the right course.

Endnotes

There are no guarantees in life and no list of best practices will ensure your migration to the cloud will be successful. There are many variables that will determine this outcome, including the commitment from your organization, the expertise of your team, your technical requirements and plenty more. The list above, however, provides a solid framework to start out with.

At the end of the day, you must stay focus on the endgame — reducing operational costs and risks, minimizing hardware cost, and becoming or staying agile. If you’ve made the decision to migrate and are reading this article, you’ve already made the first commitment. Stick to the task at hand.

Live Tailing Parsed Logs in Logz.io

$
0
0

Last year we introduced Live Tail — the ability to see a live feed of all the logs in your system, in real time, within Kibana.

This ability to see a live stream of logs as they are being outputted from the different processes in a monitored environment was a greatly requested feature, and since being introduced we have received some excellent feedback from users that has allowed us to improve the basic functionality of Live Tail. 

We are now happy to inform our users that we have added the ability to see a live stream of parsed data as well. Up until now, users could only see a live tail of the raw data output. Now, they can choose whether to see parsed log messages instead.

Let’s take a closer look.

Live Tail is an easy-to-use and intuitive tool. Opening the Live Tail page in Logz.io, all users have to do to start seeing their data streamed in real time is hit the Play button.  Logz.io then opens up a connection and begins tailing all the logs being shipped into Logz.io in their raw format. 

To use the new functionality and switch to a parsed view, all you have to do is select Parsed data on the left side of the menu bar. A new area is displayed under the menu bar, showing two default fields – the @timestamp and message fields, as well as a + button.

logz.io

Hitting the Play button now, your logs will begin to stream parsed into these two default fields.

parsed data

Depending on the log type, you might want to get a more granular look into some of the log data by seeing additional fields.  To do this, simply click the + button.

A dialog pops up that allows you to add columns to the Live Tail view.

haproxy

Selecting a specific log type and any corresponding field. Clicking Apply adds a new column to the Live Tail view. A new connection is established with each applied change so there’s no need to click Play again.

In the example below, I’ve added the client_ip field to haproxy logs:

clear

You can add as many columns as you like, switch the order in which these columns are displayed and remove columns.

Of course, all of Live Tail’s features are available for parsed data. You can use filtering, searching, highlighting, scrolling and clearing on your parsed data just as you would use these functions on unparsed data.

highlight

As always, we’d love to get your feedback. So if you have any ideas on how to improve Live Tail, please let us know at: info@logz.io

We’ve got some additional goodies on the way, so stay tuned for news and updates!

Get advanced enterprise-grade capabilities built on ELK.

Jenkins in a Nutshell

$
0
0

In many projects, the product development workflow has three main concerns: building, testing, and deployment. Each change to the code means something could accidentally go wrong, so in order to prevent this from happening developers adopt many strategies to diminish incidents and bugs. Jenkins, and other continuous integration tools (CI) are used together with a source version software (such as GIT) to test and quickly evaluate the updated code.

In this article, we will talk about Jenkins, applicable scenarios, and alternatives to automatization testing, deployment, and delivering solutions.

About Jenkins

Jenkins is a popular self-contained, open-source automation server to perform continuous integration and build automation. Its elementary functionality is executing a predefined list of phases or jobs. In other words, every change in a repository triggers a pipeline of jobs that evaluates and executes different tasks to accomplish what has been previously defined.

Each phase is monitored and allows you to stop the entire process and the change will be reported to the user by Jenkins. In large companies, it is common for multiple teams to work on the same project without knowing what the other teams are doing on the same code base. Those changes can create bugs that will only be revealed when both codes are integrated into the same branch. Since Jenkins can run its predefined jobs for every commit, it will be able to detect and notify developers that something is not right and where it is. 

Thousands of add-ons can be integrated with Jenkins, they provide support for different types of build, version control systems, automation, and more. It can be installed through native system packages, Docker, or be run by any machine with a Java environment installed.

Jenkins is often used for building projects; running tests to spot bugs, to analyze static code, and deployment. It also executes repetitive tasks, saves time, and optimizes developing processes.

Beginning with the second version, Jenkins introduced Pipelines, a different way to programmatically define a project build workflow. Before pipelines, the CI description was defined and stored outside the repository—it was designed to evaluate—now, with Pipelines, CI files are present in project source code. The file describes the workflow through a language which can be used to create different jobs in sequence or in parallel.

Below is an example of a pipeline with four jobs (stages) which facilitates debugging when one of them fails (from: from https://jenkins.io/doc/pipeline/examples/).

jenkins

Jenkins use cases

Let’s take a look at some of the main scenarios Jenkins plays a critical part in.

Continuous Integration (CI)

Continuous integration is a practice that forces developers to frequently integrate their code into a central repository. Instead of building out new features to the end without any quality measurement, every change is tested against the central repository in order to anticipate errors.

Every developer commits daily to a shared mainline and every commit triggers an automated process to build and test. If building or testing fails it can be detected and fixed within minutes without compromising the whole structure, workflow, and project. In that way, it is possible to isolate problems, solving them faster and provide higher-quality products.

Continuous Delivery (CD)

Continuous delivery is the ability to make changes of all typessuch as new features, configuration changes, error fixes, experimentsinto production in a safe and efficient manner using short work cycles.

The main goal in continuous delivery is to make deployments predictable as routine activities that can be achieved upon request. To be successful, the code needs to always be in a deployable state even when there is a scenario with lots of developers working and making changes on a daily basis. All of the code progress and changes are delivered in a nonstop way with high quality and low risks. The end result is one or more artifacts that can be deployed to production.

Continuous Deployment (CD)

Continuous deployment, also known as continuous implementation, is an advanced stage of continuous delivery that the automation process does not end at the delivery stage. In this methodology, every change that is validated at the automatic testing stage is later implemented at the production stage.

The fail fast strategy is always of the utmost importance when deploying to production. Since every change is deployed to production, it is possible to identify edge cases and unexpected behaviors that would be very hard to identify with automated tests. To fully take advantage of continuous deployment, it is important to have solid logging technology that allows you to identify the increasing error count on newer versions. In addition, a trustworthy orchestration technology like Kubernetes that will allow the new version to slowly be deployed to users until the full rollout or an incident is detected and the version is canceled.

Automation

As a job executor, Jenkins can be used to automate repetitive tasks like backup/restore databases, turn on or turn off machines, collect statistics about a service and other tasks. Since every job can be scheduled, repetitive tasks can have a desired time interval (like once a day, once a week, every fifth day of the month, and so forth).

Jenkins alternatives

Although Jenkins is a good option for an automated, CI/CD server, there are other options on the market such as Gitlab CI/CD, Circle CI, Travis or Bamboo.

GitLab CI/CD

GitLab is a full-featured software development platform that includes a module called GitLab CI/CD to leverage the ability to build, test, and deploy without external requirements (such as Jenkins). It is a single application that can be used in all stages of the developers’ work cycle on the same project: product, development, QA, security, and operations.

GitLab is a solution that enables teams to cooperate and work from a single step instead of managing thousands of threads across disparate tools. It provides a single data store, one user interface, and one permission model across the developers’ life cycle. This permits teams to collaborate reducing cycle time and focusing on building software more quickly and efficiently.  

Though Gitlab covers the CI/CD cycle thoroughly, it fails to do so for automation tasks since it does not have scheduling options. It can be a very good alternative since it integrates source code versioning and CI into the same tool.

Gitlab comes in a variety of flavors: there is a community, open-source edition that can be deployed locally, and some paid versions with an increasing number of features.

Circle CI

Circle CI is a hosted continuous integration server. After Circle CI is authorized on GitHub or Bitbucket, every code change triggers tests in a clean container or VM. After this, an email is sent every time there is a successful test completed or a failure. Any project with a reporting library provides code test coverage results. Circle CI is simple to configure, has a comprehensive web interface, and can be integrated with multiple source code versioning tools.

Bamboo CI

Bamboo is a solution for continuous integration, deployment, and delivery. Bamboo allows you to create a multi-stage build plan, set up triggers upon commits, and assign agents to builds and deployments. It also allows you to run automated tests in every code change which makes catching bugs easier and faster. Bamboo supports continuous deliveries as well.

Bamboo’s brightest feature is its seamless integration with Atlassian products: Jira Software, Bitbucket, and Fisheye, and can be improved with hundreds of add-ons that are available at Atlassian marketplace.

Travis CI

Travis is another open source solution that also offers a free hosted option for open source projects (paid for enterprise clients). It uses a solution similar to Jenkins Pipelines: you add a file called .travis.yml that describes the project’s own build workflow. It also has parallel jobs builds but it does not have the same size of add-ons available for Jenkins.

Endnotes

Integration solutions are a key step towards reaching delivery reliability. Every developer commits daily to a shared mainline and every commit triggers an automated workflow for building and testing; if building and testing fail it is possible to repair what is wrong quickly and safely and thereby increase productivity in the workflow. When we have a way to find problems and solve them quickly, we release higher-quality products and more stable experiences to the client.

There are lots of options on the market to choose from to help the developers’ workflow. As outlined above, some of these are free solutions and open source, while others are paid. Jenkins is one of the oldest open source tools out there and as such also extremely popular. We at Logz.io are no exception here, and we use Jenkins to run tests, create Docker containers, build code, and push to staging and production.

Easily Configure and Ship Logs with Logz.io ELK as a Service.

Using Audit Logs for Security and Compliance

$
0
0

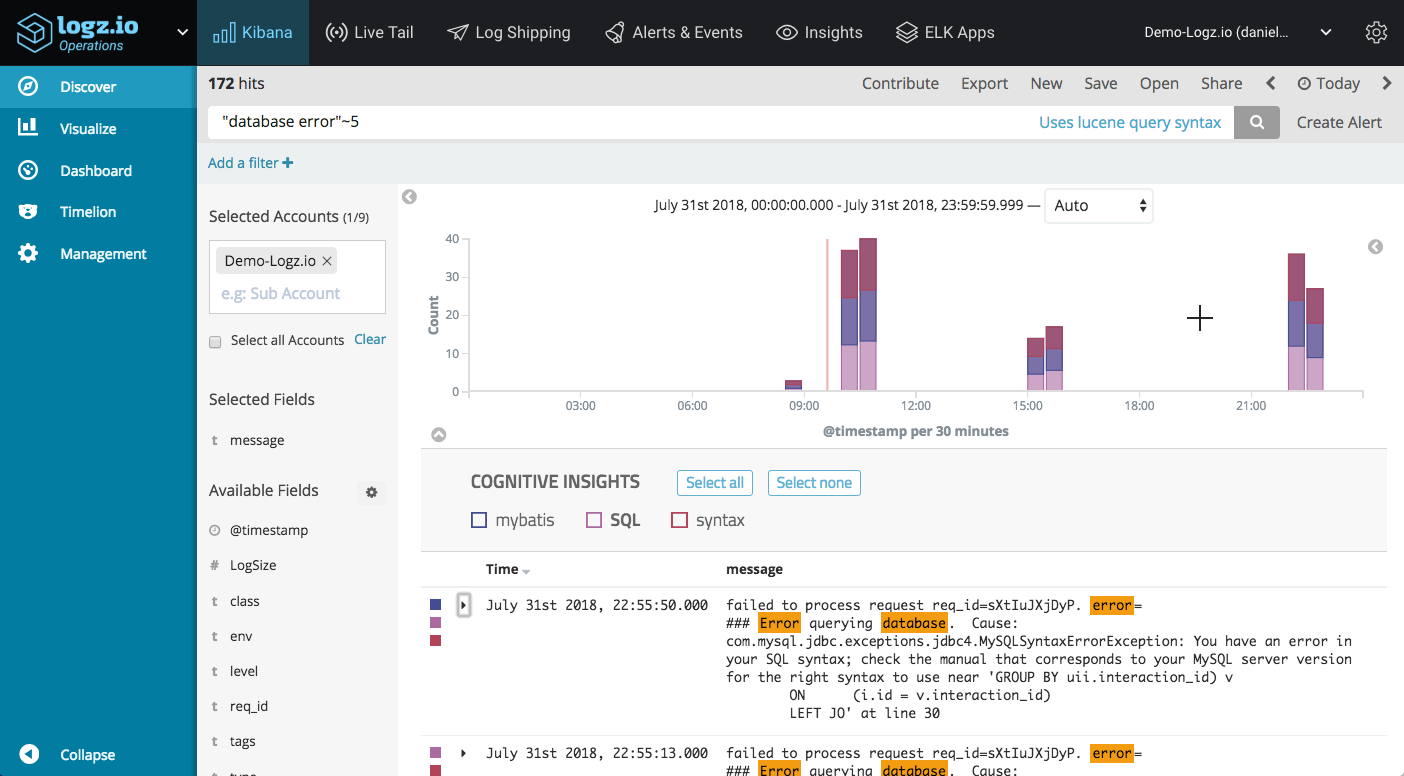
Most software and systems generate audit logs.

They are a means to examine what activities have occurred on the system and are typically used for diagnostic performance and error correction. System Administrators, network engineers, developers, and help desk personnel all use this data to aid them in their jobs and maintain system stability. Audit logs have also taken on new importance for cybersecurity and are often the basis of forensic analysis, security analysis, and criminal prosecution.

Similar to other types of log data, when incorrectly configured, compromised, or corrupted, audit logs are useless. Because of their growing importance, and to extract the most value from them, we’ve put together some useful information on the basics of audit logging.

What are audit logs?

Let’s start with the basics — what exactly are audit logs?

Audit logs vary between applications, devices, systems, and operating systems but are similar in that they capture events which can show “who” did “what” activity and “how” the system behaved. An administrator or developer will want to examine all types of log files to get a complete picture of normal and abnormal events on their network. A log file event will indicate what action was attempted and if it was successful. This is critical to check during routine activities like updates and patching, and also to determine when a system component is failing or incorrectly configured.

For the sake of space and time, we will examine primarily operating system logs, but you’d do well to examine all systems in your environment to get a good understanding of the logs, log configurations, file formats, and event types that you can gather.

Here are common Linux log file names and a short description of their usage:

  • /var/log/messages : General message and system messages
  • /var/log/auth.log : Authentication logs
  • /var/log/kern.log : Kernel logs
  • /var/log/cron.log : Crond logs (cron job)
  • /var/log/maillog : Mail server logs
  • /var/log/qmail/ : Qmail log directory (more files inside this directory)
  • /var/log/httpd/ : Apache access and error logs directory
  • /var/log/lighttpd/ : Lighttpd access and error logs directory
  • /var/log/boot.log : System boot log
  • /var/log/mysqld.log : MySQL database server log file
  • /var/log/secure or /var/log/auth.log : Authentication log
  • /var/log/utmp, /var/log/btmp or /var/log/wtmp : Login records file
  • /var/log/yum.log : Yum command log file

For example, in terms of security analysis you may want to examine user session (login) interaction on a Linux system. Linux session information is stored in different *tmp files.    

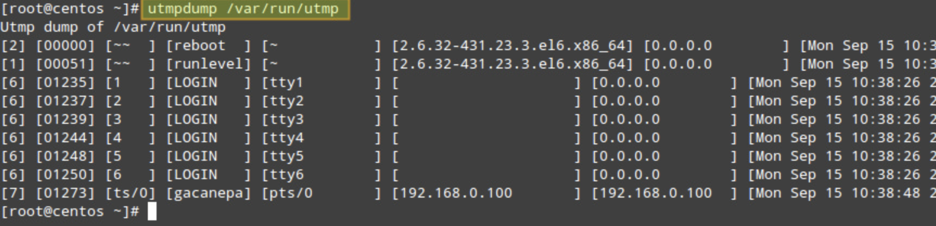
To display the contents of /var/run/utmp, run the following command:

utmpdump /var/run/utmp

display contents

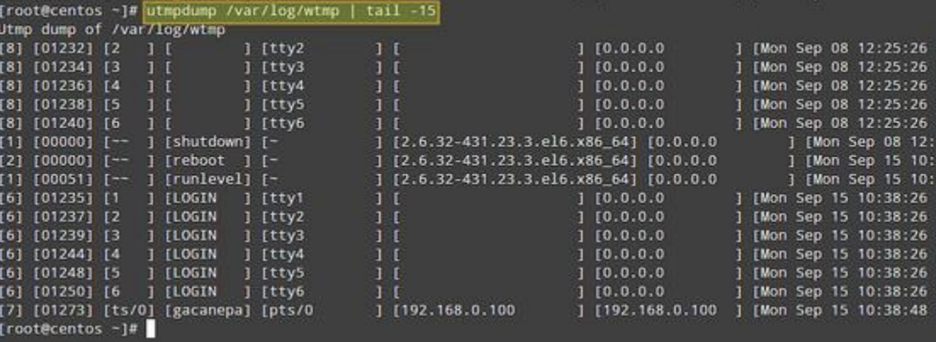
Do the same with /var/log/wtmp:

utmpdump /var/log/wtmp

display contents 2

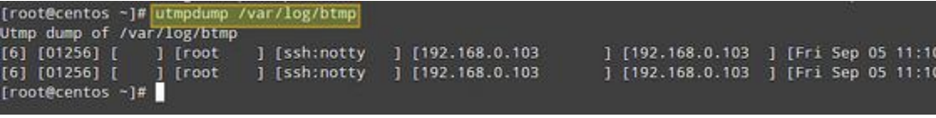
And finally with /var/log/btmp:

utmpdump /var/log/btmp

display contents 3

The output format in these three cases is similar. Note that the event records in the utmp and btmp are arranged chronologically, while in the wtmp, the order is reversed.

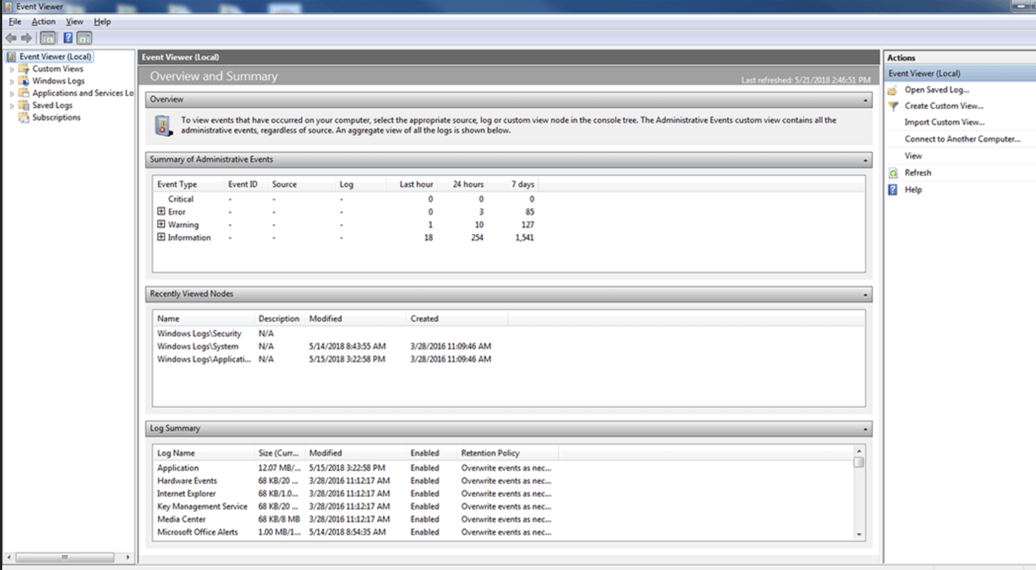
With Microsoft Windows, event management is typically done with the Event viewer application, rather than the command prompt. The screenshots below illustrate the Microsoft Event Viewer interface that allows you to examine logs used for Security, Administration, System, and Setup activities. (with Server 2008/Vista and up, the logs are stored in the %SystemRoot%\system32\winevt\logs directory.)

overview and summary

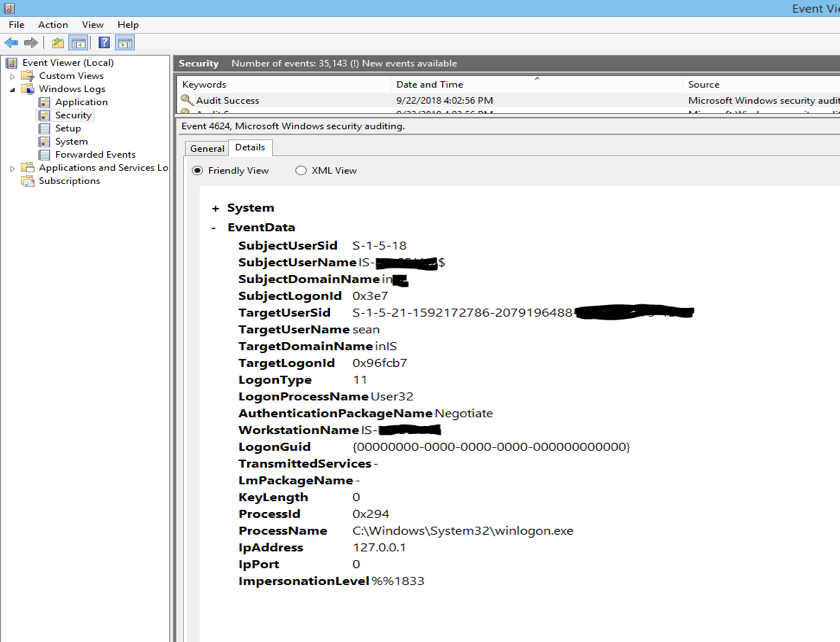
A similar Windows login/session audit log event might look like this:

windows


Some important points to keep in mind:

  • While event logs vary in readability, these types of files gather a lot of potentially sensitive information and should not be made publicly available.
  • Many native log files systems should be configured to ensure security and continuity. Examine these audit log settings to ensure log files are secured and are tuned to your operation needs. This can include changing the sizing of the log files, changing the location of the log files, and adjusting the specific events that are captured in the file.
  • Most native log file systems do not automatically alert the administrator/end user when critical events occur.
  • Because event logs from any operating system can provide detailed information about who, what, and when an event occurred, correlating this information can provide a “story” of activity that has led to performance, security, and application errors.
  • Learning to “read” audit events logs is a skill that can take time, especially if your team needs to learn multiple log system record formats and tools. Challenges in understanding logs can discourage audit log reviews and reduce the value of the logs.

Why audit logging?

Now that we have a better understanding of what audit logs are, let’s review some of the core benefits of collecting this data from your environment, whether it’s a data center, server/workstation, or even application logs.

Promote accountability

Event logs should be configured to help an organization capture security and authentication, and privileged activity information. This should be in support of company policy or best practices to ensure that systems remain stable and users are held accountable for their actions, which are tracked by event logs. 

For example, audit logs can be used in tandem with access controls to identify and provide information about users suspected of improper modification of access privileges or data. To do this effectively, event logs have to be captured and stored regularly and securely to show behavior before and after an event has occurred.

Reconstruction of events

Event logs may also be used to essentially “replay” events in sequence to help understand how a damaging event has occurred. Analysis can distinguish between system, application, or operator errors. By gaining knowledge of system conditions prior to the time of an error is a way to prevent future failures. Additionally, if logs are configured to capture detailed transactions, data can sometimes be reconstructed from logs.

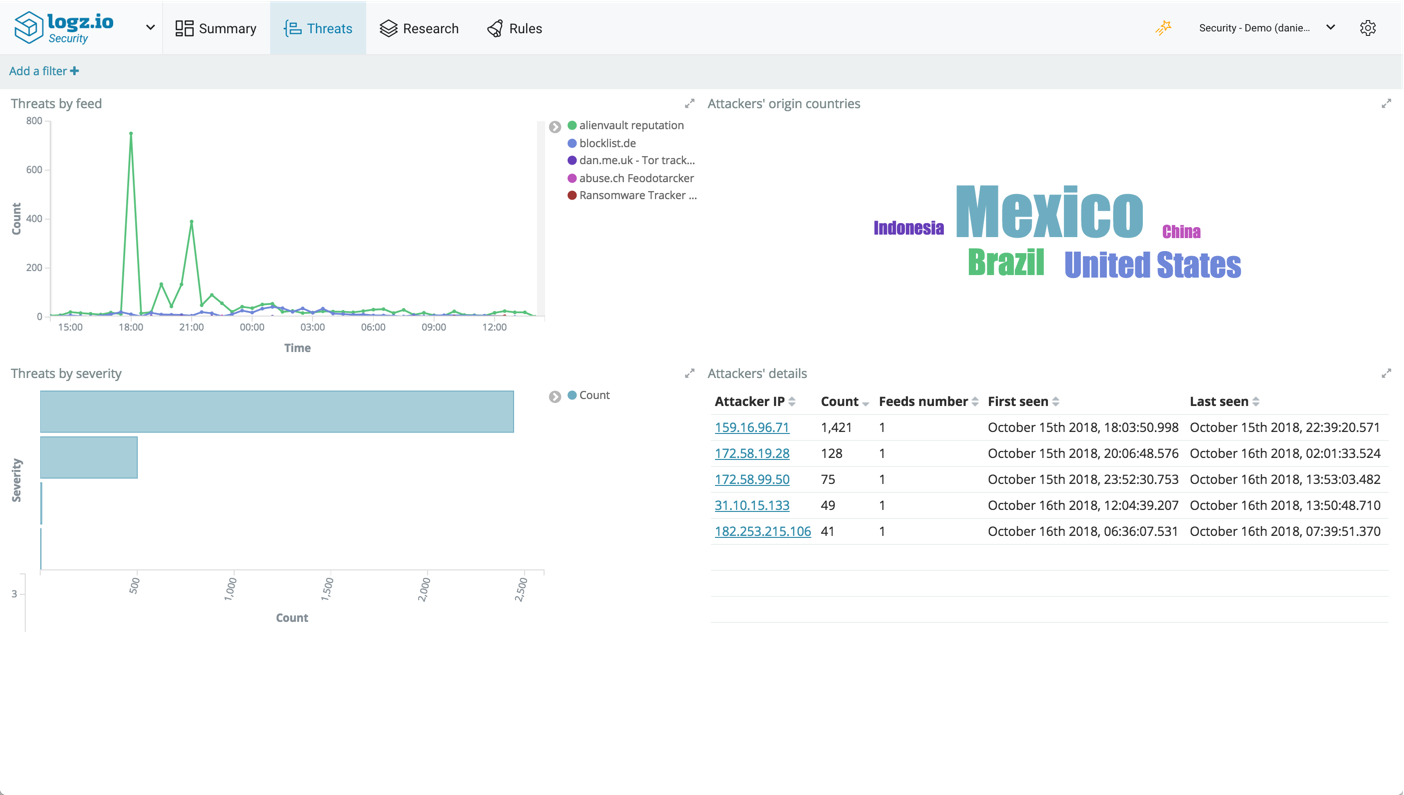
Security and forensics

Because event logs work in concert with logical access controls, actions taken are pinpointed to specific users and devices. This information can be used to see when a user account may have been hacked, and then if user account privileges were escalated to access specific files or directories with sensitive information. Logs could also show who and when specific files were copied, printed, or deleted.

Audit logging requirements

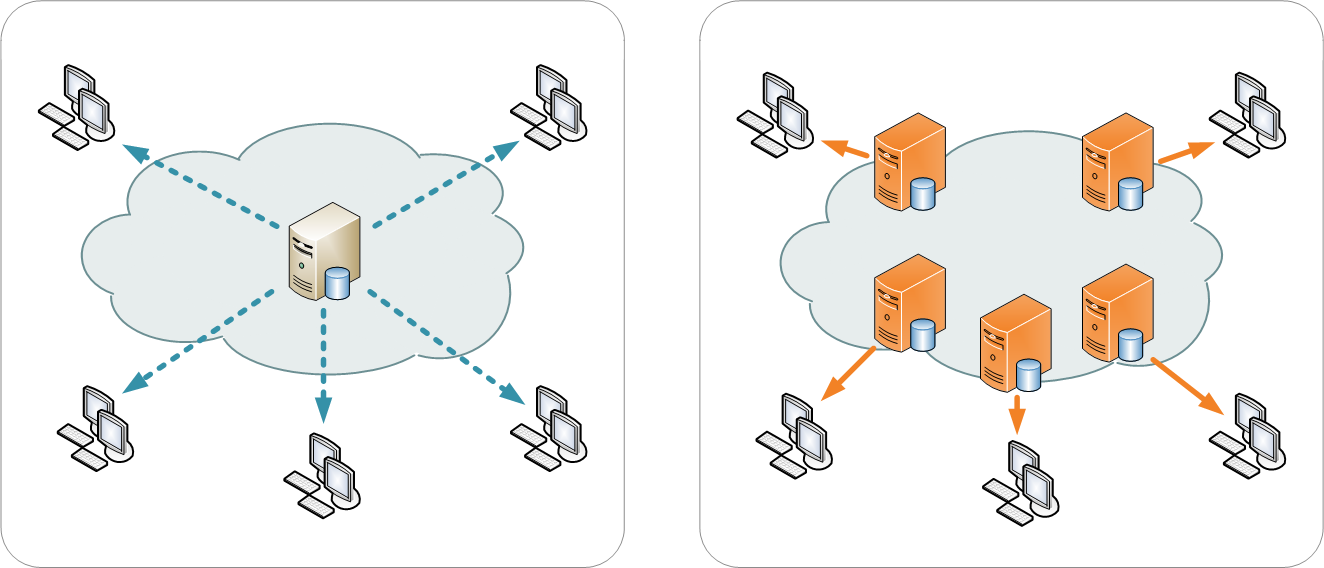
From the information above, it is fairly clear that audit logging is systems based. There are audit logging systems on network devices and within applications and operating systems.  Within logging services on stand-alone systems, there can be further log subtypes for gathering specific types of events, like security events, system events, and specific services.

Modern web-oriented systems are based on auto-scaling components and have blurred the lines between traditional “servers” and the applications that run on them. Audit logging now involves collecting data from a large amount of data sources, which poses a series of challenges necessitating a log management solution — data collection, storage, protection, parsing of the data and its subsequent analysis.

When looking for a solution, some of the key considerations are:

  • Normalization/parsing – to enable efficient analysis of the data, your solution needs to support the normalization of data. Parsing the different audit logs into structured fields allows for easier reading, searching, and analysis.
  • Alerting – getting notified when a user has performed an unauthorized action, for example, is a crucial element of audit logging and facilitates a more proactive approach.  
  • Security – safe routing and storage of the different audit logs to a secure location. Make sure the solution stores the logs in a secure manner that addresses company retention policy. Some products provide data compression and other means to address high volume logs.
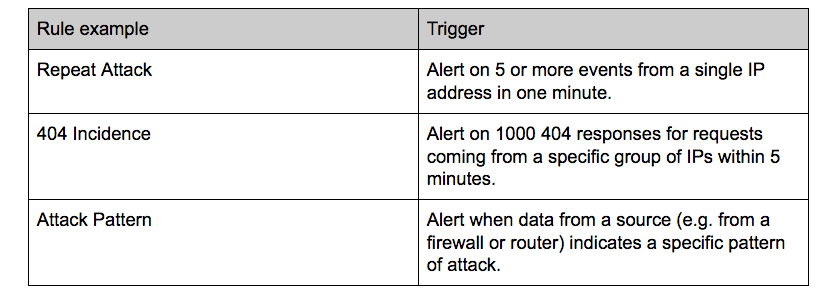
  • Correlation – to be able to effectively connect the dots and identify a sequence of events, the ability to create correlation rules is also important.

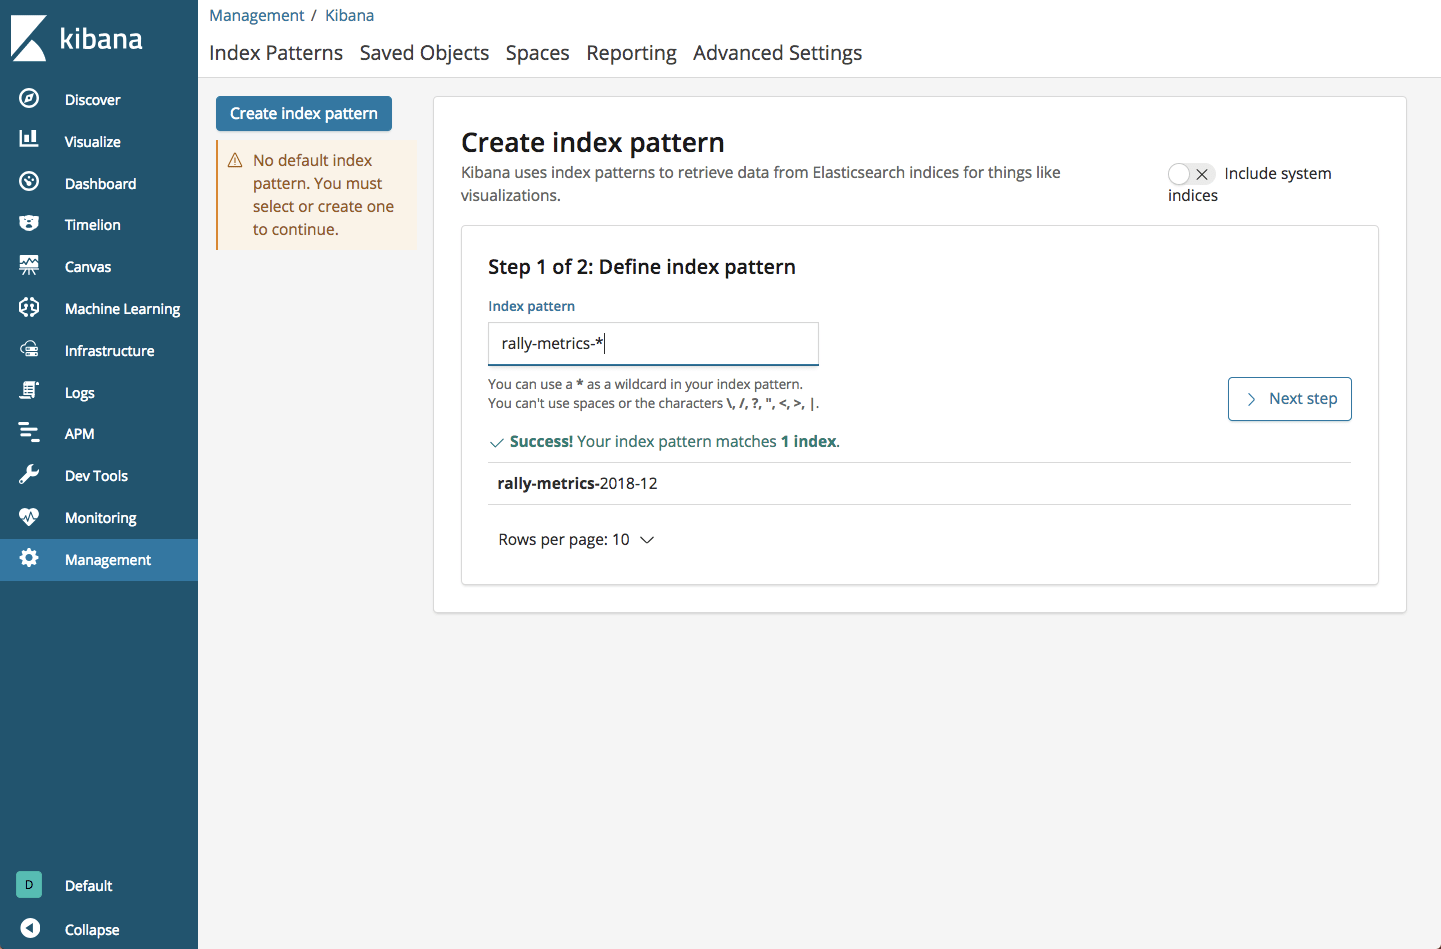
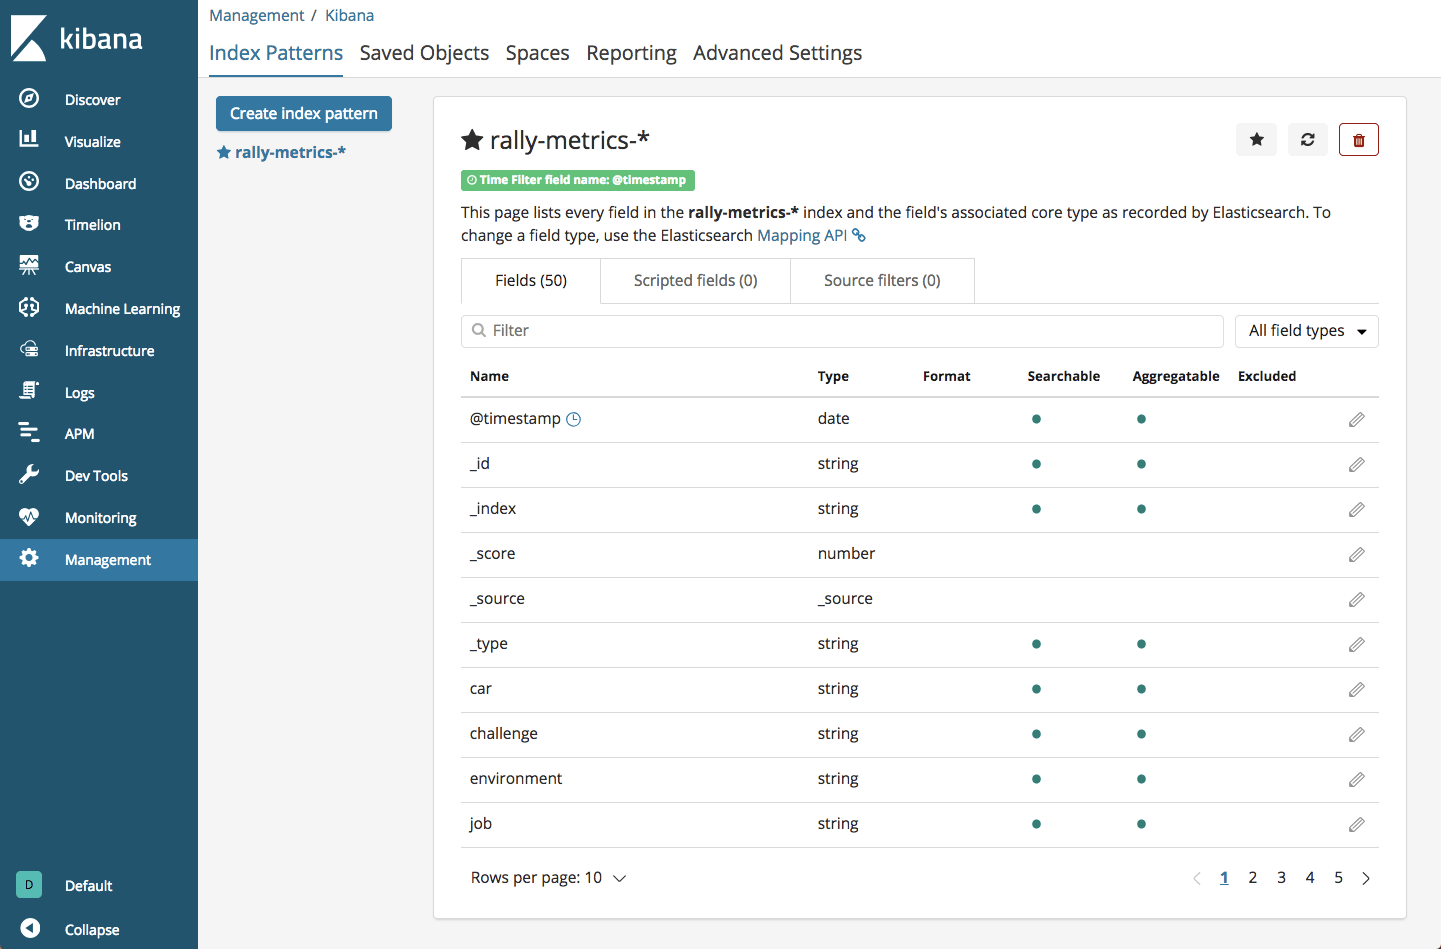
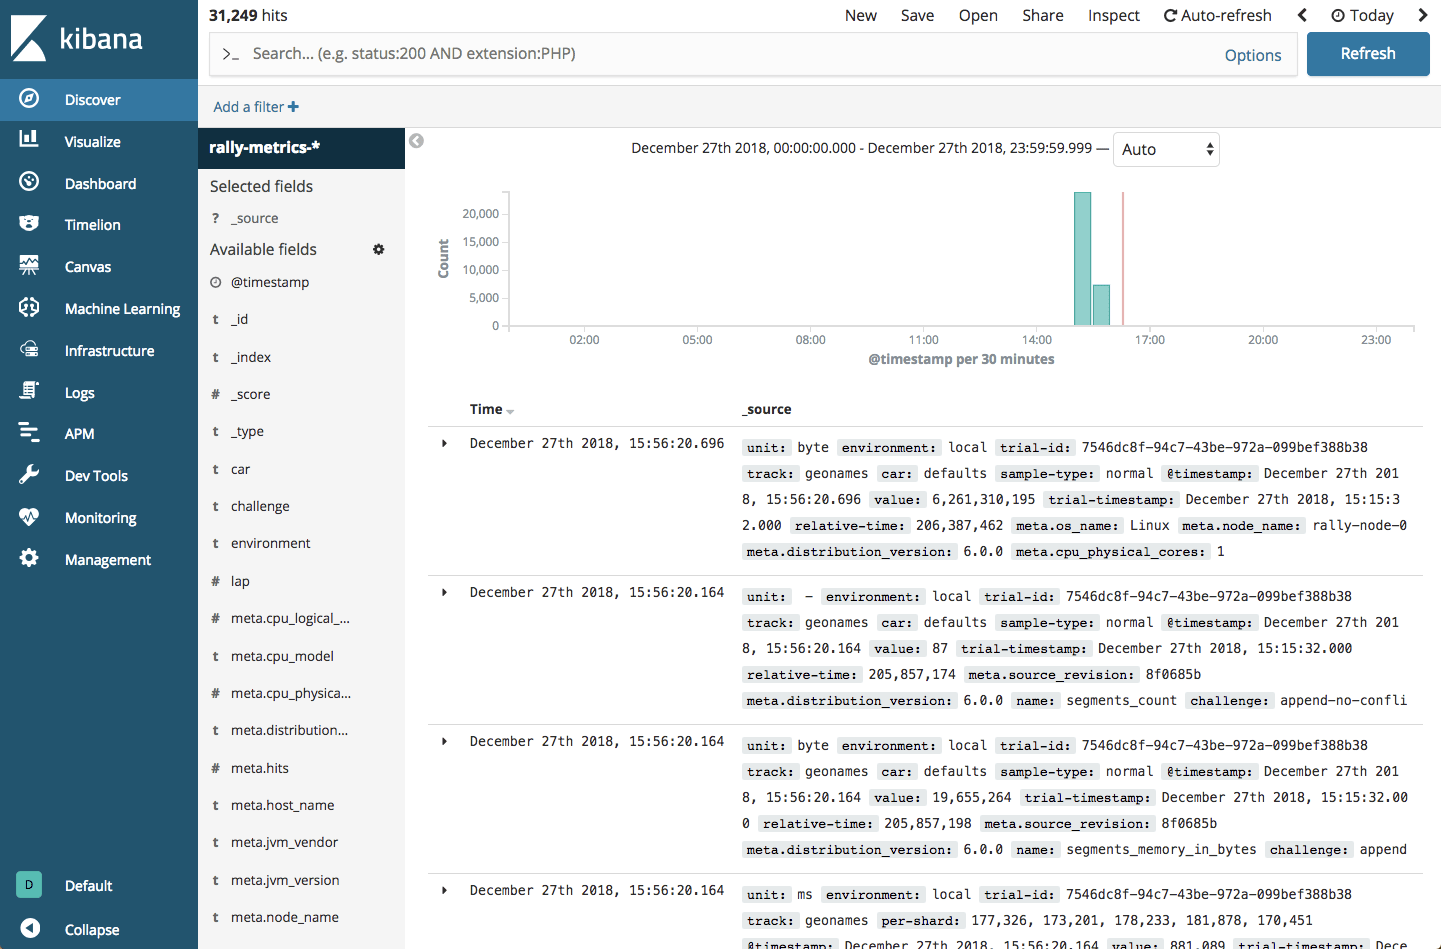
There is a wide array of solutions available in the market that support audit logging and centralized logging as a whole. ELK (Elasticsearch, Logstash and Kibana) is the most common open source solution used, while SIEM systems are more tailored for a security use case.

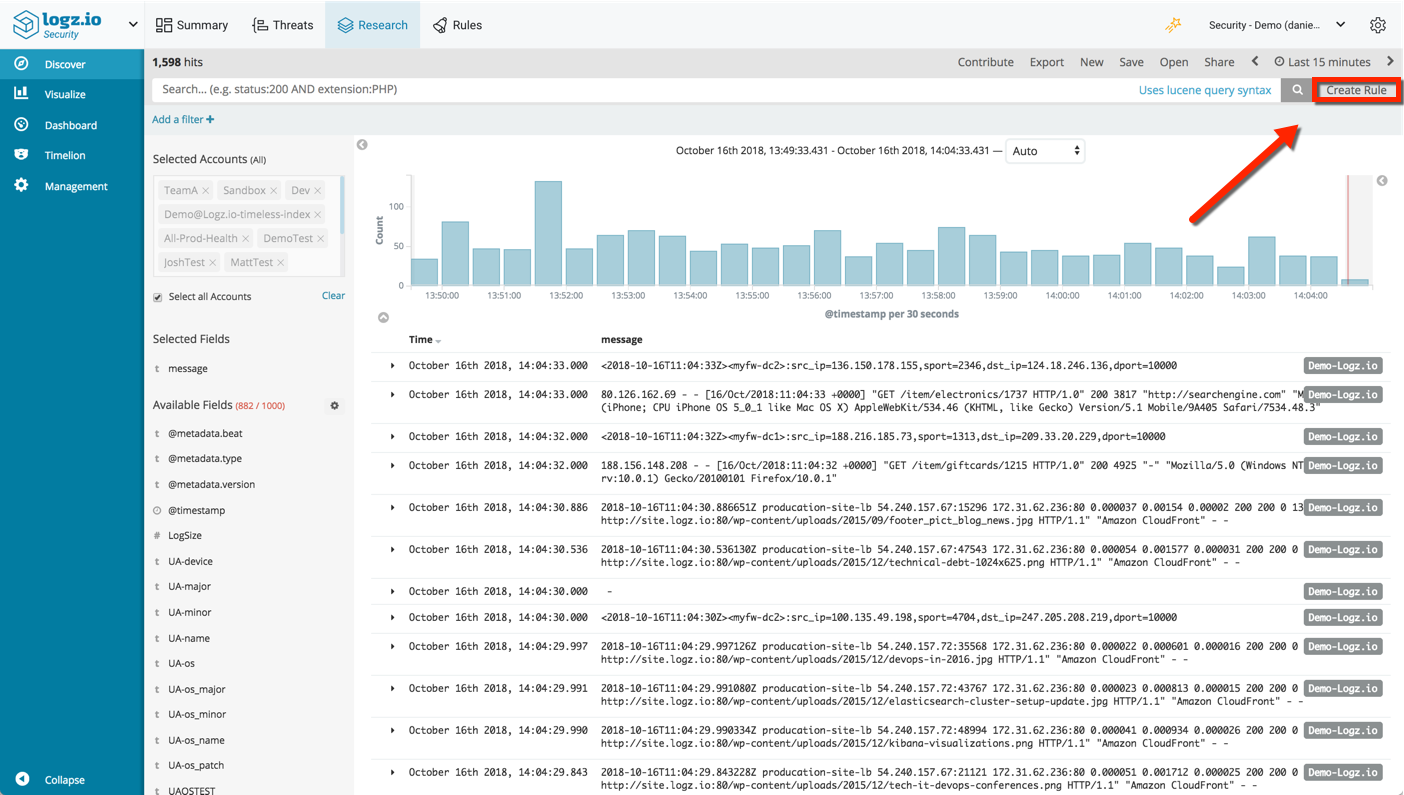
Using audit logging for security and compliance

Simply put, without audit logging, any action by a malicious actor on a system can go totally unnoticed.  

Needless to say, this is a significant risk when trying to protect your environment or recover sensitive information for operations. Yes – audit logs are valuable for detecting and analyzing production issues, but they can also provide the underpinning for a security system.

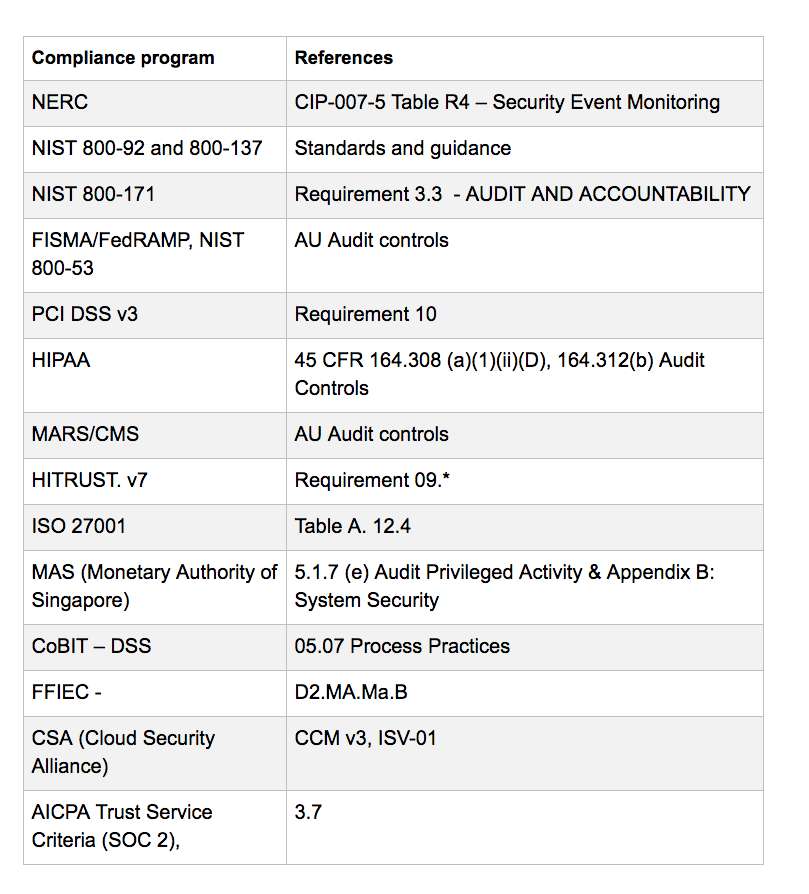
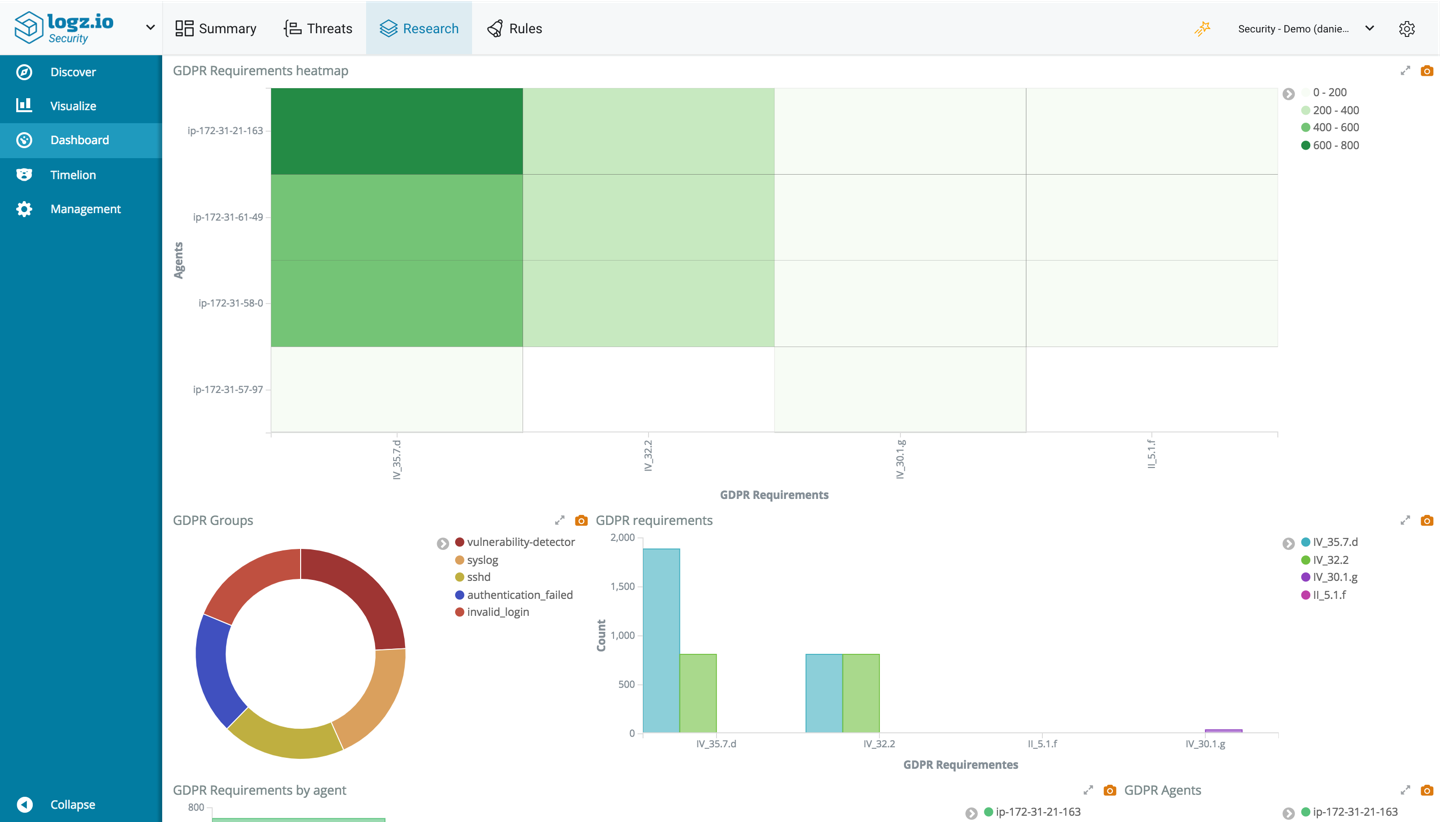
Security compliance programs and certifications reflect industry best practices and focus on high risk, and it is not a coincidence that they include audit logging as an ingredient for compliance.

Below is a list of compliance programs with reference to audit logging components:

chart

Audit logging best practices

The following are recommendations for system settings and configurations that can help you use audit logs for security and compliance.

Log system configuration

Logs are composed of event entries, which capture information related to a specific event that has occurred.

Log format will vary between sources, platforms, or application, but each recorded event should capture at a minimum the following:

  • General information:
    • Timestamp
    • Event, status, and/or error codes
    • Service/command/application name
    • User or system account associated with an event
    • Device used (e.g. source and destination IPs, terminal session ID, web browser, etc.)
  • Operating System (OS) Events

o   Start-up and shut-down of the system

o   Start-up and shut-down of a service

o   Network connection changes or failures

o   Changes to, or attempts to change, system security settings and controls

  • OS Audit Records

o   Log-on attempts (successful or unsuccessful)

o   The function(s) performed after logging on (e.g., reading or updating a critical file, software installation)

o   Account changes (e.g., account creation and deletion, account privilege assignment)

o   Successful/failed use of privileged accounts

  • Application account information

o   Successful and failed application authentication attempts

o   Application account changes (e.g., account creation and deletion, account privilege assignment)

o   Use of application privileges

  • Application Operations

o   Application startup and shutdown

o   Application failures

o   Major application configuration changes

o   Application transactions, for example,

–  e-mail servers recording the sender, recipients, subject name, and attachment names for each e-mail

–  Web servers recording each URL requested and the type of response provided by the server

–  business applications recording which financial records were accessed by each user

Sync the timestamp

Without logs using a common format for the timestamp field, typical correlation between logs and sequential analysis would be almost impossible. It is a compliance requirement for a number of standards that the NTP (time protocol) be synchronized for all devices, servers, applications. This configuration is typically applied globally within an enterprise with a backup source should the primary fail. If you are using a log aggregator/processor such as Logstash, you can make sure the timestamp is applied across all the audit logs as they are processed.

Log file security

Audit logs are also a prime target for attackers who are looking to cover evidence of their activities and to maximize opportunities to compromise data. To prevent malicious actors from hiding their activities, administrators must configure audit logging to enforce strong access control around audit logs and limit the number of user accounts that can modify audit log files.   

Finally, if audit logs are transmitted for remote collection or archive/backup, administrators should ensure the transmission is secure providing encryption in transmission and encryption for backups. This will improve the chances that the logs will be usable, if necessary, for forensic analysis of events.  

Endnotes

Audit logging necessitates understanding the architecture of your system and the different components comprising it.  Understanding how the different building blocks communicate with each other and how they rely on each other is part of understanding how to finetune and protect your system. With the advent of cloud computing, virtualized resources, and devices, modern systems rely on audit logging tools to address a new complexity of audit events.  

Security and compliance requirements for audit logs add additional configuration and operational considerations — such as protection of the log data to enhance the integrity, availability, and confidentiality of records.  The benefit of a log management platform such as Logz.io is providing a centralized solution for log aggregation, processing, storage and analysis to help organizations improve audit log management.

Learn more about Logz.io's secure and compliant ELK solution!

A Deeper Dive into Logz.io Security Analytics

$
0
0

Facing the growing threat of cybercrime, and to answer compliance requirements, more and more organizations are looking at their DevOps and Operations teams to implement security.  The term “security”, however, often triggers negative feelings among engineers. The reason for this is that security is associated with siloed, sequential and complicated processes — all roadblocks to fast development and deployment.

This association is founded in part on traditional security solutions and processes that are extremely ill-suited for modern IT environments. Many legacy SIEM solutions, for example, are complex, rigid and difficult to implement. They do not integrate well with microservices architectures deployed on the cloud which are highly distributed and transient in nature. When implemented, these solutions are found to be highly ineffective, generating a high volume of false positives that cause real issues to go undetected.  

A different kind of security solution is needed. A solution that seamlessly fits into existing operational workflows, is easy to deploy and use, that integrates natively with any data source and that is flexible enough to scale with the volume of data being generated and collected.

That’s where Logz.io Security Analytics announced today comes into the picture. 

Logz.io Security Analytics provides a unified platform for security and operations specifically designed for cloud and DevOps environments. It’s built on top of Logz.io’s enterprise-grade ELK Stack and is extremely easy to set up and integrate with. Advanced security features include preconfigured correlation rules, threat intelligence and anomaly detection that together will help you identify and remediate threats faster.

Integrating with your data sources

Logz.io Security Analytics is based on the same data set used for operations. Meaning, any data you are collecting from your environment, whether web server logs, database logs or firewall logs, can be reused for security without any additional steps required.

To add new data sources, you can use the variety of different integrations available in the Operations interface, under Log Shipping.

installing

Similar to troubleshooting and monitoring, precise parsing is crucial for security analysis as well.

As such, Logz.io supports various ways to make sure your data is normalized properly. Automatic parsing is applied when ingesting specific log types, and you can use the data parsing and field mapping features to ensure your data is massaged the way you need it to be. In case of any parsing issues, 24/7 chat support is available as well.

Once your data is shipped, click Logz.io in the top-left corner and select Security. You will be switched over to Logz.io Security Analytics to begin your security analysis.  

summary

Get notified on security events using correlation rules

As already mentioned, security events are triggered when specific conditions defined in correlation rules are met.

Correlation rules are designed to connect the dots between the different data sources by defining a specific sequence of events that could be indicative of a breach in security. Logz.io Security Analytics packs a large amount of pre-configured correlation rules for different types of attack types and security use cases, including a wide collection of AWS-related rules and other platform-specific rules such as Wazuh, Apache, nginx and others.

These rules are listed on the Rules page, where you can manage and fine-tune their configurations.

rules

Rules can be enabled/disabled, and to find specific rules you can use filtering and searching features.

Configuring rules

Rules contain various definitions and thresholds that determine when an event is triggered and the actions to follow.

edit security

The rule above is based on a query for nginx access logs, containing either a ‘401’ or ‘403’ response. It is configured to trigger an event if more than five events take place within a time period of five minutes and notify me via email.

Creating new security rules is done in Kibana, on the Discover page (accessed via the Research page).  Query for specific log messages and click the Create Rule button in the top-right corner of the page.

rule

Proactive security with threat intelligence

Threat intelligence helps analysts gain an edge on attackers by giving them knowledge, or intelligence, on their adversaries. This intelligence is gained by enriching data using external security resources.   

Logz.io Security Analytics crawls multiple and publicly-available threat feeds such as Blocklist.de and Emerging Threats. The list of IPs listed in these feeds is extracted and correlated with your data. When a correlation is identified with a specific log message, a threat is flagged in your system and the log is enriched with additional security context.

For example, the IP in the HAProxy log below was found on the AlientVault Reputation threat feed:

202.62.17.240:39542 [04/Sep/2018:13:48:08.267] HTTPS-TCP_8091 
HTTPS-TCP_8091/PROD-listener-i-06f60f6c7fad971c2-2 1/0/3720 6465 CD 
30111/4058/4058/115/0 0/0

Logz.io flagged this log as a potential threat and enriched it with the following security context:

  • logzio_security.context – the type of threat identified by Logz.io. In the case above – Malicious Host.
  • logzio_security.ioc.malicious_ip – the IP that was correlated and found as potentially malicious.
  • logzio_security.origin_feeds – the name of the threat feed used for the correlation
  • logzio_security.origin_feeds_num
  • logzio_security.severity – a severity level assigned automatically to the threat

Using any of these fields, you can use Kibana, just as you would troubleshoot any other issue in your development or production environment, to analyze and visualize the different threats identified by Logz.io.

Query similar events by querying Elasticsearch:

logzio_security.context:"Malicious Host"

To make it easier for you however, Logz.io includes a dashboard that gives you a nice overview of all the various threats identified in your environment. This dashboard is available on the Threats page.

mexico

You can monitor the number of threats per threat feed over time, view the most active geographic location generating threats, a severity breakdown and a table with details on each threat.

Just as you would slice and dice the data in Kibana for operational use cases, the same goes for security. Use the same old Kibana tricks for querying and visualizing your data to secure your environment. To sweeten the deal, Logz.io Security Analytics also ships with a series of pre-made dashboards for different security use cases, including for AWS environments and various types of compliance such as GDPR and PCI.  

dashboard

The move towards DevSecOps

Responsible for keeping production up at all times, it only makes sense that DevOps teams are becoming increasingly tasked with keeping production secure as well. After all, a hack can be just as damaging to the business as a bug.

In a business environment with zero-tolerance for downtime, security solutions must be easy-to-use and cost-efficient. Teams responsible for operating an organization’s mission-critical applications and services can’t afford to waste time on deploying and maintaining complex solutions. Neither can they wait for slow security scans and analyses to deploy new code into production.

Logz.io Security Analytics is a security extension to ELK that allows engineers to leverage the stack to apply the same procedures used for monitoring and troubleshooting their environment, for securing it as well. DevOps and Operations teams will be able to easily integrate security into their existing processes using the same toolset they are used to working with.

Logz.io Security Analytics provides a flexible, easy-to-use security solution that seamlessly fits into your DevOps environment

Monitoring and Logging Requirements for Compliance

$
0
0

Addressing compliance requirements for monitoring and logging can be a challenge for any organization no matter how experienced or skilled the people responsible are. Compliance requirements are often not well understood by technical teams and there is not much instruction on how to comply with a compliance program. In this article, we’ll discuss what some of these new compliance programs mean, why they are important, and how you can comply with your logging and monitoring system.

What is a compliance program?

The goal of compliance is to provide stronger security in a verifiable manner. The way they do this is to create standards or regulations that stipulate where an organization must meet a minimum level of strong security practices. To meet these, it may include technical controls; such as logging/ monitoring software, strong configuration control, or administrative controls; such as policy, procedure, and training.

While compliance sets a minimum level of requirements, it is up to the organization to determine the level of control needed. Most commonly, this is done via an assessment of risk or threat in context with the requirement.  If it can be shown that a compliance control requirement is sufficient, then the control should be at least what is required but can vary based on the assessment.

Who is affected by these regulations?

This next section includes a table of some common compliance programs – often referred to by the regulation or security framework associated with it. A regulation may be very broad and impact any business when it focuses on specific types of data (just as a state privacy law protects any citizen’s data regardless of location) or it may focus on a specific sector of the economy (like healthcare or energy utilities).

Many businesses may find they are within the scope of a regulation to a limited degree, such as when a business self-insures its employees, it falls into some HIPAA regulation requirements even though the business has no health-industry orientation. If you’re wondering if you might be impacted by a regulation, the question is typically determined by your legal or security department.

What do the compliance programs say?

The regulation may be how a program is identified, but often it is also a framework or associated document that provides instruction on how a compliance effort is to be implemented and assessed. It is wise to distribute these framework requirements to staff (sometimes in addition to the regulation) in order to explain what is required.

Compliance types

Program/ regulation
Purpose
Scope
Framework
Associated
PCI
Credit card security program
Any business that handles or processes Cardholder data systems
PCI-DSS[I]
States Breach and Privacy legislation[II]
HIPAA – Health Insurance Portability and Accountability Act & HITECH[III] Health Information Technology for Economic and Clinical Health Act
Healthcare data protection and associated health information technology
Any business that stores or processes personal health information or runs electronic health information systems
Privacy and Safeguards Rules[IV]
HITRUST[V]States Breach and Privacy legislation
FISMA – Federal Information Security Management Act
Federal Systems protection
Any federal entity that processes government information
NIST SP 800-53[VI]
CNSSI 1253[VII] – National Security rules
FedRAMP – Federal Risk and Authorization Management Program
Federal Systems protection on Cloud environments
FedRAMP is for implementation of federal systems in a public cloud
FedRAMP Security Assessment Framework[VIII]
NIST 800-53 & Cloud Security Alliance – CSAIQ[IX]
GDPR – General Data Protection Regulation[X]
Protect privacy data of individuals
Any Business that has EU citizen personal data
GDPR Articles 1–99
ISO 27018, ISO 27001
GLBA –Gramm-Leach-Bliley Act
Protections of systems processing customer data
Financial institutions that process customer data
Safeguards Rule[XI]
FCRA, GDPR, States Financial, Breach and Privacy legislation
NERC-CIP[XII] Critical Infrastructure Protection
Protection of Electrical Systems Infrastructure
Utilities, generators, and transmission
Energy Sector Cybersecurity Framework
(C2M2)[XIII]
NIST 800-53, ISO 27001[XIV]
SOX – Sarbanes-Oxley Act[XV]
Protection of accounting data and systems
Any publicly traded entity
PCAOB
CoBIT[XVI]
SOC-2[XVII]


So how does regulation turn into a compliance program? It requires at least two components: 1) a compliance framework to meet the goals of the regulation, and 2) a penalty mechanism for “encouraging” compliance. When you examine those mechanisms, it makes it easier to understand the initiatives.

Why and when do you have to comply?

The penalty mechanism helps to provide the answers to the “why and when do we have to comply” question. In many instances, a compliance program costs more in fines and fees than if the company were to just comply.

For instance, PCI fines range between $5000–$100,000/month[XVIII].. For US State Privacy breach laws (in 48 states) the average fine is $50–$90 per person included in the breach. This does not exclude any other civil litigation that often follows a breach event. HIPAA fines reach up to $1.5M per incident[XIX], and GDPR fines[XX] are up to 20 million Euros or 4 percent of the annual global business, whichever is highest. These high costs make companies pay attention to key aspects of the compliance program – such as adhering to a compliance schedule. The compliance program, once engaged, typically starts a strict timing for audits, and in many cases, the timeframe for fixing or rectifying non-compliance findings. 

The compliance framework is where compliance programs get challenging, and where technical staff may get involved. You’ll want to start by reading the actual text of the framework. Most compliance frameworks are typically publicly available[XXI] so you can read about the requirements for the organization to follow.

Where is the compliance program applied?

The challenge with a framework is that it is usually somewhat “high level” for most technical staff. This can be a point of frustration – most frameworks are not very prescriptive.

There are a few aspects to keep in mind: first, there is often a question of scope, defining where the compliance program is to be applied. While this may be obvious, it can also be strategic when a company can segregate a high-risk function to limit the costs of security.

Second, it is most common to find that “objectives” or security control requirements are 1) categorized into common business operations and key functions (such as Human Resources, Access Control, Physical Security, Computer Operations, Encryption). Then 2) language is used to describe the outcome or components of a “compliant” environment, but without defining the specific control.

Finally, it is becoming more common for objectives to be couched in language that assumes a critical risk determination to be part of the solution to affect the features of the control. Therefore, these are all areas that can be part of a company compliance approach. Some examples of compliance language may help provide some context for the topic of logging or monitoring.

Examples of compliance language for logging/event monitoring

NERC CIP-007-5 Table R4 – Security Event Monitoring

R4. Each Responsible Entity shall implement, in a manner that identifies, assesses, and corrects deficiencies, one or more documented processes that collectively include each of the applicable requirement parts in CIP-007-5 Table R4 – Security Event Monitoring. [Violation Risk Factor: Medium] [Time Horizon: Same Day Operations and Operations Assessment].

M4. Evidence must include each of the documented processes that collectively include each of the applicable requirement parts in CIP-007-5 Table R4 – Security Event Monitoring and additional evidence to demonstrate implementation as described in the Measures column of the table.

ISO 27001 – A.12.4 – Logging and Monitoring

Objective: To record events and generate evidence.

Control 12.4.1 A.12.4.1 Event logging – Event logs recording user activities, exceptions, faults, and information security events shall be produced, kept and regularly reviewed.

Control A.12.4.2 Protection of log information – Logging facilities and log information shall be protected against tampering and unauthorized access.

Control  A.12.4.3 Administrator and operator logs – System administrator and system operator activities shall be logged, and the logs protected and regularly reviewed.

Control A.12.4.4 Clock synchronization –The clocks of all relevant information processing systems within an organization or security domain shall be synchronized to a single reference time source.

PCI DSS (Requirement 10): Track and monitor all access to network resources and cardholder data logging mechanisms and the ability to track user activities are critical for effective forensics and vulnerability management. The presence of logs in all environments allows for thorough tracking and analysis if something goes wrong. Determining the cause of a compromise is very difficult without system activity logs.

10.1 Establish a process for linking all access to system components to each individual user – especially access done with administrative privileges.

10.2 Implement automated audit trails for all system components for reconstructing these events: all individual user accesses to cardholder data; all actions taken by any individual with root or administrative privileges; access to all audit trails; invalid logical access attempts; use of identification and authentication mechanisms; initialization of the audit logs; creation and deletion of system-level objects.

10.3 Record audit trail entries for all system components for each event, including at a minimum: user identification, type of event, date and time, success or failure indication, the origin of the event, and identity or name of affected data, system component or resource.

10.4 Using time synchronization technology, synchronize all critical system clocks and times and implement controls for acquiring, distributing, and storing time.

10.5 Secure audit trails so they cannot be altered.

10.6 Review logs for all system components related to security functions at least daily.

10.7 Retain audit trail history for at least one year; at least three months of history must be immediately available for analysis.

Takeaways

As you can see from the examples above, the compliance requirements do not specify a specific product or solution – it is up to the organization to choose how to address the requirements to achieve compliance. Such solutions should ideally bring auditable outcomes so that an assessor or auditor could verify that the control in place meets the expectations of the compliance program.

A second takeaway is that the topic – logging and monitoring – is fairly similar across compliance programs. Many controls would be the same between compliance programs because the underlying systems and technology risks are so similar.

Finally, there are typically assessment guides provided with many compliance frameworks. With a little research, you will find multiple guidelines and checklists for deploying or assessing compliance with your program. Many are likely to be instructions to auditors and can give you “insight” as to how you might be assessed and what sort of evidence is expected. Advance planning can save you time and effort while illustrating to compliance auditors that your organization is staying ahead of the goals for the program.

Final Recommendations

We have discussed the who, what, why, when, and where of compliance and want to leave you with a couple final recommendations:

1) Consider the scope of the compliance program to ensure that your controls include the system components, facilities, products, and business processes that are included in the compliance program. Avoid focusing too narrowly on the scope of compliance.

2) Interpretation of control requirements can be challenging. One way to address complex technical control configuration is to work towards standard security best practices with all products, tools, and utilities at your enterprise, and consider performing a risk assessment to help deploy the controls most applicable.

Learn how you can use Logz.io for security and compliance.


Footnotes:

[I] PCI – https://www.pcisecuritystandards.org/document_library?category=pcidss&document=pci_dss

[II] State Laws – http://www.ncsl.org/research/telecommunications-and-information-technology/security-breach-notification-laws.aspx

[III] HITRUST – https://www.hhs.gov/hipaa/for-professionals/special-topics/hitech-act-enforcement-interim-final-rule/index.html

[IV] All HIPAA rules – https://www.hhs.gov/hipaa/for-professionals/privacy/laws-regulations/combined-regulation-text/index.html

[V] HiTRUST CSF – https://hitrustalliance.net/

[VI] NIST – https://nvlpubs.nist.gov/nistpubs/specialpublications/nist.sp.800-53r4.pdf

[VII] CNSSI – http://www.dss.mil/documents/CNSSI_No1253.pdf

[VIII] FedRAMP – https://www.fedramp.gov/assets/resources/documents/FedRAMP_Security_Assessment_Framework.pdf

[IX] CSA – https://downloads.cloudsecurityalliance.org/assets/…/CAIQ_-_v3.0.1-12-05-2016.xlsx

[X] GDPR – https://gdpr-info.eu/

[XI] GLBA – https://www.ftc.gov/tips-advice/business-center/guidance/financial-institutions-customer-information-complying

[XII] NERC – https://www.nerc.com/comm/Pages/Reliability-and-Security-Guidelines.aspx

[XIII] C2M2 – https://www.energy.gov/sites/prod/files/2015/01/f19/Energy%20Sector%20Cybersecurity%20Framework%20Implementation%20Guidance_FINAL_01-05-15.pdf

[XIV] ISO – https://www.iso.org/isoiec-27001-information-security.html

[XV]SOX – http://www.soxlaw.com/

[XVI] ISACA- COBIT – https://www.isaca.org/COBIT/Pages/COBIT-5-Framework-product-page.aspx

[XVII] SOC2 – https://www.aicpa.org/interestareas/frc/assuranceadvisoryservices/aicpasoc2report.html

[XVIII] http://www.focusonpci.com/site/index.php/pci-101/pci-noncompliant-consequences.html

[XIX] https://compliancy-group.com/hipaa-fines-directory-year/

[XX] https://www.i-scoop.eu/gdpr/gdpr-fines-guidelines-application-penalties/

[XXI] Not always, for instance, ISO/IEC documents (e.g. ISO 27001) are licensed and you will need to procure or share a copy.


Advanced Mitigation Techniques to Stop DDoS Attacks in Their Tracks

$
0
0

In our last blog post, we learned what the Distributed Denial of Service (DDoS) attack is, and examined the DDoS picture globally. As we walked through some recent and well-known cases, we also surveyed a range of attack types and drilled down to specific examples.

In this article, we’ll study the mitigation techniques you’ll need to resist these attacks. You’ll learn: 1. How to avoid becoming a bot; 2. How to prepare your own network for the possibility of an attack and finally; 3. What to do if your network is under attack.

How to Avoid Becoming a Bot

Educate Users Not to Be Exploited—and to Be Vigilant

Stopping DDoS attacks—or mitigating them—is a multifaceted process. There are aspects of DDoS mitigation that affect end-users as well as system admins and DevOps roles. Why is this? Because of the way DDoS attacks are orchestrated. As we saw in our previous blog on the topic, a DDoS attack typically relies on a botnet—a network of distributed, compromised, end-user machines that coordinate instructions from a script kiddie to launch an amplified attack on a specific target.

Although it’s indirectly related to your network, there are steps most computer end-users can do to avoid becoming a bot in a botnet. Do you serve an IT function for a corporate staff? Make sure your users are not using default passwords for anything. Have your users install and manage a personal firewall and learn how to configure it. They should close ports on their own computers that they don’t specifically need—for either uplink or downlink—and make sure their firewall rules are up to date.

Users should also have anti-virus and anti-malware installed, with the latest updates. Educate them to make periodic hard drive scans, and encourage them to use the real-time and and/or on-access file scan setting.

Keep users off the TOR network. Tor is no longer considered completely anonymous, for one thing. While it does obfuscate connections, TOR users agree to let their computer be taken under control, which makes them perfect candidates for botnets. Even without that it’s possible, while on the TOR network, to download a file or click a link which can install a bot in the background.

Users should also never pirate software  for the same reason! Free stuff comes in executables that appear to be archives, installers, or key generators, but they actually install bots that wait and listen to the network for remote commands.

Of course, users should be knowledgeable and vigilant about the usual vectors of attack. If users, for whatever reason, do need to download stuff, access email attachments, click dodgy links, or surf risky websites, they should make sure they have real-time scanning enabled on their anti-virus and anti-malware. More critically, they should do all of the above from a virtual machine that can be wiped clean and restored at the first sign of trouble.

If a user thinks they might be on a risky website or a phishing site, use the appropriate key commands to close the browser (Option-Command-W on Mac; Alt-f4 on Windows). NEVER click an “X” or a “Close” button directly on the page—any controls on the page could be a ruse to install something or run some other malicious process in the background.

If users suspect they have a bot or some other malware installed, have them install a personal firewall and network monitor like Glasswire and configure your network router to keep a log. Make a note of what you’re connecting to throughout the day.

If You’ve Been Infected—and Become a Bot:

  • Reinstall your machine or restore your VM from a safe snapshot. Make sure to reinstall your anti-virus and anti-malware and do a full scan.
  • Change your passwords.
  • Change your habits. Be wary of all the possible vectors for malware, including:
    • dodgy email attachments;
    • risky websites;
    • download sites and networks like TOR—to name a few.
  • If you must browse to a download site, or something with content that could be risky, install a virtual machine—and browse from there.
  • If you’re downloading something from even “reputable” sites like CNet or Downloads.com, don’t trust anything implicitly. Make sure you scan everything you download.

How to Prepare Your Own Network

So what can you do to prepare your network for the possibility of a DDoS attack?

Patch Systems to Prevent DoS (and Other) Exploits

These include software updates and security patches for routers and other network hardware, firewalls, servers, PCs, or other workstations and all connected devices. Of course, make sure to change the default password on routers and all connected devices. In some jurisdictions, you are now required to change these passwords, while manufacturers are forbidden from using “standard” ones like “password”, “admin” or “123456” out of the box.

Stay current with the latest security news, and update promptly when necessary.

If there’s an auto-update mechanism, consider enabling it.

Separate and Distribute Assets

Separate and distribute assets in a network to make them harder to attack. Here are a few ways to do so:

Use a Content Delivery Network (CDN) for all Content—to Distribute It—Wherever One Can Be Used Conveniently.

DDoS attackers will typically target your content where it usually resides, and this means an external IP address (as opposed to an internal one). It’s why, for example ipconfig /release && ipconfig /renew won’t actually help you much during an attack; your commands in this case work on all adapters to release and renew the IP address internally, but not externally. You would have a particularly difficult situation to remedy if your web content was hosted at a single external IP during an attack.

A content delivery network (CDN) distributes your content and boosts performance in part by minimizing the distance between your websites visitors and the content. CDNs store cached versions of content in multiple locations (points of presence or PoPs); each PoP may contain many caching servers that deliver content to nearby visitors.

CDNs subsequently mitigate the impact of a DDoS attack by avoiding a single point of congestion, when the attacker is trying to focus on a single target.


CDN

Image courtesy of Wikipedia

Popular CDNs include Cloudflare, Rackspace, and Amazon CloudFront, but there are many others as well.

Make Sure that Either Your CDN or Other (Outer) Layer Has Traffic-Scrubbing Capabilities to Identify and Filter Out Resource Consumption Attacks

In DDoS mitigation, one good activity to get out of the way (before you actually have an attack) is identifying “normal” traffic patterns.

Usually, a Security Information and Event Management (SIEM) or Security Analytics system such as Logz.io Security Analytics, is used for this work, to develop rules for the filters by allowing users to study aspects like payload, signatures, origin IP addresses, cookies, HTTP headers, and Javascript footprints.

CDNs can then be configured with these scrubbing filters to prevent huge amounts of fake traffic from causing more than a momentary blip.

Conserve Resources in Use, While Maximizing Available Ones

During an attack, these filters work by passing traffic intended for a target through high-capacity servers and networks to filter out the “bad” traffic.

Types of filtering that support DDoS mitigation include:

Separate the firewall from the router, so there is no single point of attack. Beef up firewalls and routers with compute power and memory where possible also helps. You can turn off logging (for example, on consumer routers and equipment) so that log writes do not eat up resources when traffic accelerates during an attack. As mentioned before, setting up a Response Rate Limiter (RRL) will limit how many responses servers will send to requests. RRLs will also stop/block zombie computers that keep requesting data without acknowledgment requests. This functionality is particularly useful during spoofing attacks.

Another step involves placing an on-premise filtering device in front of the network. However, it’s recommended that DDoS mitigation not rely on on-premise solutions alone, precisely because these limit capacity. Homespun and on-premise anti-DDoS measures work best alongside anti-DDoS emergency response providers like Arbor Networks, Akamai, CloudFlare, or Radware and/or services from cloud providers like Verisign and Voxility.

Ramp Up the Defenses

Finally, there are some general steps you can take to be ready for an attack before it happens. We’ll summarize below.

  • Configure your data center to shut a connection and reboot after an attack.
  • “Change the “TTL” or “Time to Live” to 1 hour. You’ll need to redirect your site once it comes under attack; (the default is three days).
  • Make sure you’ve got backups, and where possible, a means to create offline copies.
  • Stay up to date on security and software updates with any Content Management System (CMS) you may be using.
  • Monitor your site’s availability with a service like UptimeRobot, Pingdom, or Monitis to check your it periodically and alert you (via SMS or email) if your site goes down.

How to Troubleshoot a Possible Attack

You should continually monitor the health of your network as well as your uplink and downlink traffic patterns. You can use the ELK Stack with logz.io for just this purpose.

Below are a few examples of the types of alerts you can configure into your SIEM solution to monitor your network:

table


In this example below, we’re using Logz.io to monitor for the frequency of specific messages (http 200) and errors:

searchforlog

Of course, there’s a lot more you can do with Logz.io Security Analytics, including log aggregation, incident detection and forensic analysis of logs, but alerting is an essential tool in DDoS mitigation.

If you are experiencing traffic issues or a site outage, and think you might be experiencing a DDoS attack, refer to this guide first to rule out other possibilities.

Steps to Take if Your Network Is Under Attack

If you’re troubleshooting passes muster, and your continue to have performance issues, you may be experiencing a DDOS attack. Here’s how to respond:

  1. If you haven’t already, go to your domain hosting service (for example, EasyDNS, Network Solutions, GoDaddy) and change the “Time to Live” or TTL to 1 hour. You can now redirect your site (to a new external IP) within an hour, instead of the default 3 days.
    (You may, in the future, consider the Icelandic hosting service 1984.is, for example, or hover.com for additional security).
  2. Once you are able, consider moving your site to a DDoS mitigation service, like Google’s Project Shield, CloudFlare, CF/Project Gallileo, VirtualRoad, Deflect, and Greenhost.
  3. After you’ve recovered control, decide whether to continue with your DDoS mitigation service, or simply switch to a secure hosting provider.

Summing Up

DDoS mitigation is a complex endeavor with wide-ranging implications. Mitigation is similarly multi-faceted and with many areas to consider, including user education, making your own network attack-resilient, troubleshooting problems that might be the result of an attack, and dealing with an attack in progress.

There’s no one single vector of attack, nor is there a single weakness that makes mitigation for DDoS attacks a one-and-done effort. However, with the guidelines we’ve outlined above, we hope you can address most of them, deal with attacks as they happen, and, most importantly, begin to adopt the mindset necessary to be ready for the challenge when it comes.

Monitoring and alerting is just one tool in your belt for managing the health and security of your network. In addition to the general techniques we’ve covered, which other ones can you think of? Please feel free to leave a comment.

Combat DDoS attacks with Logz.io Security Analytics.

AWS GuardDuty Monitoring with Logz.io Security Analytics and the ELK Stack

$
0
0

Last month, we announced Logz.io Security Analytics — a security app built on top of the ELK Stack, offering out-of-the-box security features such as threat intelligence, correlation, and premade integrations and dashboards. 

In this article, I’d like to show an example of using both the ELK Stack and Logz.io Security Analytics to secure an AWS environment. To do this, we are going to ship GuardDuty data into Logz.io Security Analytics and then construct a security dashboard using Kibana.

What is GuardDuty?

AWS GuardDuty is a security service that monitors your AWS environment and identifies malicious or unauthorized activity. It does this by analyzing the data generated by various AWS data sources, such as VPC Flow Logs or CloudTrail events, and correlating it with thread feeds. The results of this analysis are security findings such as bitcoin mining or unauthorized instance deployments.

Your AWS account is only one component you have to watch in order to secure a modern IT environment and so GuardDuty is only one part of a more complicated security puzzle that we need to decipher. That’s where security analytics solutions come into the picture, helping to connect the dots and provide a more holistic view.

Shipping from GuardDuty into Logz.io

GuardDuty ships data automatically into CloudWatch. To ship this data into Logz.io, we will first create a Kinesis stream and use a Lambda function to consume it and send the data to Logz.io in bulk over HTTPS.

Creating a Kinesis Stream

The first step in the pipeline is to create a new data stream in Kinesis. To do this, open the Kinesis console and hit the Create Kinesis stream button.

kinesis stream

Give the stream a name and enter the number of shards you think you need. For the purpose of this article, starting with one shard will suffice but you can use the provided shard calculator to come up with a more adequate number to suit the expected data flow.

When done, click the Create Kinesis stream button at the bottom of the page.

Create an IAM role

First, let’s create a new IAM role allowing Kinesis to execute our Lamba.  

On the Roles page in the IAM console, click the Create Role button.

Select Lambda from the available entities, and on the next page assign the AWSLambdaKinesisExecutionRole permissions policy to the new role.

Complete the process, give the role a memorable name – you will need this role in the next step.

Create a Lambda shipper

Next, we will create a new Lambda function to collect the GuardDuty events from CloudWatch and ship them to Logz.io via Kinesis.

First, let’s create the Lambda function.

In the AWS Lambda console, choose to create a function from scratch and use the following configurations for the function:

  • Runtime – select Python 2.7
  • Role – select the role you created above.

After clicking the Create Function button, your function is created and your next step is to upload the code itself.

In your terminal, clone the GitHub repo containing the Lambda:

git clone https://github.com/logzio/logzio_aws_serverless.git

Execute the commands below to access the folder and zip the shipper:

cd logzio_aws_serverless/

mkdir dist; cp -r ../shipper dist/ && cp src/lambda_function.py dist/ && cd dist/ && zip logzio-kinesis shipper/* 
lambda_function.py

In the Function Code section, back in the Lambda console, open the Code entry type drop-down menu and select Upload a .zip file.

Upload the zipped shipper, and hit the save button in the top right corner.

Next, in the Environment variables section, add the following variables:

  • FORMAT – json
  • TOKEN – Your Logz.io token. It can be found in your Logz.io app account settings.

URL – enter the Logz.io listener URL. This depends on the region your account is deployed in. For US, use https://listner.logz.io:8071. For the EU, https://listner-eu.logz.io:8071 (to determine which region you are in, simply take a look at the login URL – app.logz.io means the U.S, app-eu.logz.io means the EU.

environment variables

Save the function again.

Create CloudWatch rule

Next, we need to create a CloudWatch rule to ship the GuardDuty data into the Kinesis stream we created.

In the CloudWatch console, select Rules from the menu on the left, and then the Create

rule button.

Under Event Source, select GuardDuty from the Service Name drop-down menu. In the Targets section, select the Kinesis stream you created in the previous step.

create rule

Click Configure Details to move to the next step, which is entering a name and creating the rule.

Define the Lambda trigger

To finish building our data pipeline, we need to create a new trigger for the Lambda function.

From the list of available triggers on the left, select Kinesis and select the Kinesis stream you created in the previous step, and click Add. The rule is added.

Save the function to apply the new design configurations.

daniel demo

A good way to test the pipeline is using GuardDuty’s sample findings feature. This can be used in the Settings section in the GuardDuty console.

Within a few minutes, you will begin to see GuardDuty events in Logz.io.

56 hits

Data shipped to Logz.io is stored in your operations accounts. To identify threats and security analysis, switch over to the Security Analytics interface using the menu in the top-left corner of the page.

security

Building a GuardDuty security dashboard

Logz.io Security Analytics is based on Kibana, and as such gives you all the freedom you need to query the data and visualize it.

Querying can be done on the Research page, where you will find the familiar Kibana Discover page.For example, you can quickly find GuardDuty events with a high severity (severity level 7 and above). These events indicate that an EC2 instance or a set of IAM user credentials is compromised and is actively being used for unauthorized purposes:

type:guardduty AND detail.severity:[7 TO *]

research

Things get more interesting, of course, when we start using Kibana’s visualization capabilities. Kibana provides various options for visualizing data, and it is really up to you to slice and dice the data in a way that allows you to monitor it effectively.

Here are a few examples of visualizations that you can develop on top of GuardDuty data.

Threats trend

Using a line chart visualization, we can see events found by GuardDuty, broken down by their severity:

line

Threats per region

We can use another line chart visualization to view threat per AWS region in which they were identified:

line 2

Threats list

A data table visualization can be created to display a simple but detailed list of the different threats identified by GuardDuty and shipped into Logz.io.

threats

Threat severity by account

To try and identify a particular problematic account, we can create a bar chart visualization that shows each account and its threat severity.

bar

Threats by security group

A pie chart gives us an overview of the threats by security group:

pie

Adding these visualizations, and others, into one comprehensive dashboard, gives you a security dashboard of your AWS environment:

dashboard

Summing it up

GuardDuty correlates between events taking place in your AWS environment and enriches these events to report on suspicious behavior. A small-to-medium sized deployment on AWS will generate thousands of these events and so a more centralized approach is necessary.

Logz.io Security Analytics provides built-in dashboards for GuardDuty, such as the general overview dashboard shown above as well as dashboards focusing on EC2 and VPC events. Integrating with Logz.io is straightforward with the use of the Lambda function above and with the help of Kibana’s analysis features, you’ll be able to investigate and analyze security incidents more efficiently.

In the next post, we will demonstrate using Logz.io correlation rules to identify and alert on a sequence of events happening in your AWS environment.  

Find out how Logz.io Security Analytics helps identify and remediate threats quickly, without inhibiting your DevOps workflow.

Setting Up Application Performance Monitoring with the ELK Stack and Logz.io

$
0
0

Application Performance Monitoring, aka APM, is one of the most common methods used by engineers today to measure the availability, response times and behavior of applications and services.

There are a variety of APM solutions in the market but if you’re familiar with the ELK Stack or are a Logz.io user, this article describes using a relatively new open source-based solution — Elastic APM.

What is Elastic APM?

As its name implies, Elastic APM is an application performance monitoring system which is built on top of the Elastic Stack (Elasticsearch, Logstash, Kibana, Beats). Similar to other APM solutions that you may have heard of, Elastic APM allows you to track key performance-related information such as requests, responses, database transactions, errors, etc.

The Elastic APM solution is comprised of 4 main building blocks, all open source — Elasticsearch for data storage and indexing, Kibana for analyzing and visualizing the data (the APM page in Kibana is provided as part of an X-Pack basic license), and two APM-specific components — the APM server and the APM agent.

APM agents are responsible for collecting the performance data and sending it to the APM server. The different agents are instrumented as a library in our applications. The APM server is responsible for receiving the data, creating documents from it and sending the data forth into Elasticsearch for storage

In this tutorial, I will describe how to set up Elastic APM for a basic node.js app on a single Ubuntu 16.04 machine on AWS. We’ll take a look at getting the data pipeline up and running, some of the visualization features, and for Logz.io users – how to ship the APM data into your Logz.io accounts.

You will need Elasticsearch and Kibana set up beforehand — please refer to our ELK guide for instructions.

Installing the APM Server

As explained above, the APM server collects the performance data tracked by the agents and forwards it to Elasticsearch.

To install the APM server using apt, we will use:

sudo apt-get install apm-server

And, to start the server:

sudo service apm-server start

We can query Elasticsearch to make sure a new apm-server index is created:

curl -XGET 'localhost:9200/_cat/indices?v&pretty'


health status index                           uuid                   pri rep docs.count docs.deleted store.size pri.store.size
green  open   .kibana                         7CdGpSpuTDqSpzDGfV5XmQ   1   0         17            1     58.8kb         58.8kb
yellow open   apm-6.4.3-onboarding-2018.11.12 4XSxUrWnQryD9yRCwPmCRQ   1   1          1            0      5.9kb

Installing the APM agent and instrumenting our node.js app

Our next step is to create a simple demo app, install the APM agent for node.js and instrument it in our app’s index.js file.

First, let’s create the application folder and create a package.json file for tracking dependencies.

sudo mkdir /demoapp
cd /demoapp
npm init

This last command will result in a series of questions and we can just press enter to use the default settings

To install express and add it to our package.json, we’ll use:

npm install express --save-dev

While we’re at it, let’s also install the APM agent:

npm install elastic-apm-node --save

Next, we will create the app’s main file which we call index.js (sometimes this file is called server.js or app.js):

sudo vim index.js

We need to start the APM agent before requiring any other modules in our node.js app, so at the very top of our new file we’ll insert the following snippet:

var apm = require('elastic-apm-node').start({
  serviceName: 'demoapp',
  serverUrl: 'http://localhost:8200'
})

We then paste some basic ‘hello world’ express code:

const express = require('express')
const app = express()
app.get('/', (req, res) => {
 res.send('HEY!')
})
app.listen(3000, () => console.log('Server running on port 3000'))

To start the server, we will use:

node index.js

The output we get shows our node server running as expected:

Server running on port 3000

To simulate some transactions, we can browse to port 3000 on the server we installed the app:

hey

Analyzing in Kibana

So, we’ve installed all the building blocks of our APM solution. It’s time for analyzing the data and visualizing it in Kibana. You can do this just like you’d analyze any other data in Kibana — using querying and visualizations. The APM page described below is another option but is provided with the X-Pack basic license.  

First thing is first though, we need to define the new index in Kibana. Querying Elasticsearch to list indices, we can see that two apm-* indices have been created:

curl -XGET 'localhost:9200/_cat/indices?v&pretty'

health status index                            uuid                   pri rep docs.count docs.deleted store.size pri.store.size
yellow open   apm-6.4.3-transaction-2018.11.13 ikIjni6qSDmgix2K9zC8vQ   1   1          5            0       37kb           37kb
yellow open   apm-6.4.3-onboarding-2018.11.13  -boQQic_S2ePPPtJ3HP83w   1   1          1            0      5.9kb          5.9kb
green  open   .kibana                          m4IxzDFrT9CkiB8EqpD3Kw   1   0         17            1     49.3kb         49.3kb

There are two ways of loading these indices in Kibana — one is via the Index Patterns tab on the Management page in Kibana.

create index pattern

The other way is using the APM page where clicking on Setup Instructions displays a tutorial detailing some of the instructions provided above. This option is a good way to verify that the APM server and agent are working as expected.

At the very bottom of the page there is an option to Load Kibana objects. Using this option will load the index patterns, visualizations, and dashboards.

agents status

Once you’ve defined the index patterns, you will see your transactions data as well as exceptions (if you have any) in the discover tab.

apm

On the APM page, you will see the ‘demoapp’ service we defined in the index.js file listed under Services.

Clicking it open up a dashboard displaying details on requests made to the app (response times and requests per minute).

demo app

You can click on a request to get more details on the request, the response, as well as system and user related info. Again, this APM page is provided as part of a basic license of X-Pack but you can, of course, build your own detailed dashboard in Kibana.

Shipping APM data into Logz.io

For Logz.io users, shipping the performance data above into a Logz.io account is easy and requires adjusting the APM server configuration file at /etc/apm-server/apm-server.yml.

First, we’re going to download the required SSL certificate:

wget 
https://raw.githubusercontent.com/logzio/public-certificates/master/COMODORSADomain
ValidationSecureServerCA.crt

We will then copy it into the correct location:

sudo mkdir -p /etc/pki/tls/certs
sudo cp COMODORSADomainValidationSecureServerCA.crt 
/etc/pki/tls/certs/

We can now edit the APM server configuration file:

sudo vim /etc/apm-server/apm-server.yml

We will then add the following snippets (detailed instructions are available within Logz.io, under Log Shipping → Beats):


fields:
  logzio_codec: json
  token:<yourAccountToken>
fields_under_root: true

output.logstash:
  enabled: true
  hosts: ["listener.logz.io:5015"]
  ssl.certificate_authorities: ['/etc/pki/tls/certs/COMODORSADomainValidationSecureServerCA.crt']

Be sure to keep to YAML syntax and comment out the default Elasticsearch output. Your account token can be found under Settings → General.

Restarting the APM server, you should begin to see the transactions appear in Logz.io:

logzio

Again, using Kibana’s analysis features you can create a bunch of visualizations for monitoring the performance of your apps and services. Here’s a simple data table visualization that gives you a breakdown of service transactions with info on response times:

response times

Summing it up

I only touched upon the core functionality of Elastic APM with a simple node.js app. Monitoring the performance of a full-fledged application, with multiple services, is an entirely different story of course, but Elastic APM should be considered a good open source alternative to other commercial APM tools in the market.

Those accustomed to working with Elasticsearch, Kibana and Beats will find it especially easy to install and handle. Setup is easy and the default Kibana objects make it easy to get started. To those new to the ELK Stack, however, I would first familiarize myself with some basic concepts before diving into Elastic APM.

Logz.io users — we will describe how to use this integration to perform APM in Logz.io in a future article.

Easily monitor your environment with Logz.io's ELK as a service.

What’s New in Elastic Stack 6.5

$
0
0

Elastic Stack 6.5 is out!

Every new version of the Elastic Stack is packed with new features and updates, and as always, I’m happy to dive a bit deeper into the new release to provide our readers with a wrap up of what’s new. 

Interestingly enough, and as reflected in the announcements surrounding this release, this release is all about Kibana. That’s not to say the other components in the stack were left out – to the contrary, and I will cover them all, don’t you worry. But Kibana definitely takes the limelight with some exciting new changes and additions in the UI.

Also worthy of note is that a large number of the new features are either experimental or in beta mode. Some require a paid subscription, others are open source or under X-Pack’s basic license. I tried mentioning the relevant licensing for each feature but the official docs are somewhat confusing. I recommend checking out the official release notes for each of the stack’s components before upgrading.

Elasticsearch

As deserved by being the heart of the stack, I will start with Elasticsearch. This is despite the fact that, as mentioned already, Kibana includes the most meaningful changes.

Elasticsearch 6.5 is based on Apache Lucene 7.5 and includes support for Java (JDK) 11 and G1 Garbage Collector ( G1GC). Below is an overview of the other major changes in this version.

Reduced snapshots

If you rely on Elasticsearch Snapshots for backing up your data you’ll be happy to hear about a new feature that promises to reduce the disk space used by snapshots by 50%!

This new feature allows users to take a “source-only” snapshot that contains only the _source and index metadata. You have all the necessary data required to restore and reindex the data if necessary, and you save on disk space. The one catch is the time to restore — which will be longer and if you need the data to be searchable, it will require a full reindex.

SQL

A lot of Elasticsearch users were excited to hear about the new SQL capabilities announced in Elasticsearch 6.3. The ability to execute SQL queries (X-Pack Basic) on data indexed in Elasticsearch had been on the wishlist of many users, and in version 6.5 additional SQL functions are supported, such as ROUND, TRUNCATE, IN, CONVERT, CONCAT, LEFT, RIGHT, REPEAT, POSITION, LOCATE, REPLACE and INSERT. The ability to query across indices has also been added.

Complementing the existing JDBC driver, Elasticsearch 6.5 now ships with a new ODBC driver which allows further integrability with 3rd party applications. Note, this is an alpha release, and only available as an MSI for Windows.

Cross-cluster replication

Following a number of failover features in recent releases, one can safely claim that Elasticsearch is much more fault-tolerant than what it used to be. In version 6.5, Elasticsearch now offers cross-cluster data replication for replicating data across multiple datacenters. This feature follows the steps of other minor updates to Elasticsearch, specifically soft deletes and sequence numbers, and gives users a much easier way to load data into multiple clusters across datacenters. Keep in mind that this feature is in beta mode and only available for paid subscriptions.

Security

Elasticsearch now supports structured audit logs. This sounds like a given, but the fact is that until this version, Elasticsearch audit logs were not formatted in a particularly friendly fashion. The new audit logs (Linux: /etc/var/log/elasticsearch/elasticsearch_audit.log) are structured as JSON messages, with ordered attributes.

Another security enhancement is support for authorizations realms, enabling an authentication realm to delegate authorization (lookup and assignment of roles) to other realms. This is another feature requiring a paid subscription.

Kibana

Those who are acquainted with Kibana will agree with me that three brand new pages (or apps) is unprecedented, especially in a minor release. Kibana 6.5 ships with new Infrastructure, Logs and Canvas pages, as well as other smaller updates.

Infrastructure page

To those of you using the stack for monitoring your infrastructure, this one promises to be a biggie. Reminding me a lot of other ITIM tools in the market, this new page (X-Pack Basic) in Kibana offers users an easier way to gain visibility into the different components constructing their infrastructure.

Kubernetes pods

Image source: Elastic.

Users can select an element and drill further to view not only metrics but also relevant log data. This feature is still in beta, and only supports server, Docker containers and Kubernetes.

Logs page

If you’re a Logz.io user, you might have heard of Live Tail — the ability to see a live feed of your data coming into the system from all your data sources. Instead of ssh’ing into a machine and using tail -f for tailing specific log files, you can see all your data streaming in from across your system, in real time.

In Kibana 6.5, a new “Logs” page (X-Pack Basic) offers similar capabilities.  The main caveat here is that only “logging indices” (e.g. logstash-*, filebeat-*, etc.) can be used.

Canvas

Canvas is Adobe Photoshop for the world of machine data analytics. I had the pleasure of covering the technology preview here, and am amazed to see how much this project has progressed (love the easy way to add new elements).

Canvas takes a while to load, but once it does…

canvas

A picture is worth a 1000 words, and you can read the post I linked to above to understand what exactly can be done in Canvas. It’s great to see it baked and pre-packaged into Kibana even as a beta.

Spaces

Another game changing feature is Spaces — the ability to organize your Kibana objects in separate workspaces. Spaces can be created via the UI or using dedicated API. This will be especially useful for those using RBAC (requires a subscription) as they could assign users and roles to the different spaces. Users can create as many spaces as you like and easily switch between them.


Add Data

Rollup UI

If you use Elasticsearch Rollups (X-Pack Basic, available since Elasticsearch 6.4) for aggregating historical data, you’ll probably find this new feature a pleasure to work with. Instead of using the API, you can use the new UI to create, start, stop, and remove rollup jobs.

create rollup

Logstash

The main news with this old horse is the Java execution engine which has advanced into beta mode (was announced as experimental in version 6.3). Replacing the old Ruby execution engine, this puppy promises better performance, reduced memory usage and overall — an entirely faster experience. The Java execution engine does not work out of the box right now, so you need to make a small adjustment in your logstash configuration file. Expected GA – version 7.0.

Run, Logstash, run!

Other Logstash news is the GA of an SNMP input plugin (for collecting metrics from network devices over SNMP) and an App Search output plugin for feeding data into Elastic’s App Search service.

Beats

New beats

First off, Functionbeat is a new serverless beat that can be deployed on AWS Lambda to move logs from AWS CloudWatch to an Elasticsearch instance of your choice. For triggering the function, you can use either CloudWatch logs or SQS events. This beat is in beta mode.

Second, Journalbeat is designed for handling the logs collected by journald on Linux distros. This beat is planned to become an input in Filebeat and so is defined as being in experimental mode.

Other notable news in the realm of new beats/modules is Heartbeart (for periodic pings on the status of services) going GA and a new module in Filebeat to support Suricata data.

Config UI

The major news in the world of Beats is the new UI in Kibana (X-Pack Basic) for managing the configuration of your beats. You need to “enroll” your beat from your terminal using a secure token retrieved from Kibana and use a wizard to apply specific configurations (e.g. input, output, etc.). Enabling the beat itself is still done via the terminal of course.


beats

Image source: Elastic.

I’m still not convinced how useful this is, especially in highly complex environments with multiple beats deployed. The switching back and forth between Kibana and the terminal is not especially user-friendly, but this is just a beta so I’m pretty sure we’ll see changed applied in version 7.0.

Endnotes

No doubt, this is a lot of news to digest — and I did not even cover the APM component.

Elastic and the community are doing an amazing job in supporting the development of the stack to support the changes we’re seeing in the industry, especially around modern architecture components such as Kubernetes and Docker. Logging and monitoring continue to be a challenge for even the most skilled engineer.

As always, and especially with minor versions, be careful before upgrading. As I specified above, a large amount of the features listed are either in beta or experimental mode. Keep that in mind before upgrading. Read the breaking changes and release notes carefully.

Enjoy!

Use the ELK you love at the scale you need!

The Tool Sprawl Problem in Monitoring

$
0
0

One of the biggest KPIs in the DevOps space is monitoring. There are so many tools to help any organization to complete their monitoring picture, but no tool does everything and most organizations use many tools to help complete their monitoring solution. Mashing tools together often creates a problem of its own — the tool sprawl problem. 

In modern computing, it’s not how much data you collect and report, or how efficient, or how durable your monitoring solution is. Sure, those are all important considerations, but it’s how effective and useful your monitoring is that makes the difference. It’s how much value to the business it creates, and how well the data can be exploited to identify and resolve critical issues. Monitoring is never a completed effort.

It evolves. It is enhanced by tools and by integrations. Often enough, the journey to improve monitoring is what creates and accentuates the tool sprawl problem. In this article, I’d like to examine how monitoring tool sprawl can become a serious issue for modern, engineering-driven companies.

Monitoring Challenges

The task of monitoring modern IT environments is too complex to properly handle without tools. The days of allowing logs to sit on servers and fishing through them to find answers are long gone. Alerting on an operating system issue and manually clearing out all the noise from old vendor solutions for sysadmins (think HP, Dell, IBM) no longer scales in the world of cloud computing.

Luckily, there are plenty of modern tools to solve modern issues. But like any type of software, every monitoring tool has weaknesses and strengths in their own right. Organizations will often patch together multiple monitoring tools based on their strengths and just deal with the sprawl.

So what are the modern problems to solve and tools to solve them?

Logs

Log data is considered an extremely valuable data source for monitoring and troubleshooting both applications and the infrastructure they are installed on. Most log management tools on the market provide analysis capabilities. Some provide advanced analytics such as machine learning and anomaly detection. Most of these tools now include plugins and integrations with cloud vendors to provide greater insight into cloud-based applications.

The world’s leading open source log management tool is, of course, the ELK Stack — an extremely popular and powerful platform but one that often requires more engineering effort and expertise to scale.

Metrics

Metrics, or time-series data, is another type of telemetry data used for monitoring. Used primarily for APM (Application Performance Monitoring), ITIM (IT Infrastructure Monitoring) and NPM (Network Performance Monitoring), metrics introduce another kind of challenge being more verbose in nature and requiring more elaborate data storage and retention strategies as well as analysis features.

Open source solutions are often comprised of a time series database such as Prometheus, InfluxDB or Graphite with Grafana playing the role of the analysis and visualization layer. Plenty of SaaS vendors offer their own APM and monitoring solutions, including premade dashboards for monitoring specific services or platforms.

Security

The increase in cyber threats means organizations must operate with security in mind. A big part of security is active monitoring and reactive controls. Triggering alarms on root or administrator login is an example, or signaling a Puppet run when a security-controlled configuration is changed via an automated response to a security incident. To be able to build this kind of solution requires a very specific kind of tool, usually falling under the category of SIEM or Security Analytics. Again, there are both open source and proprietary solutions on the market but the skills gap is proving to be as big a challenge as integrating and deploying these solutions.

Compliance

SOC, PCI, HIPAA, SOX, GDPR, ISO, and CODA are just a few regulatory and compliance certifications companies must contend with to remain in business. All of them require some level of auditable data to show that their required checks and controls are being maintained. This means companies must find tools to capture, store, and retrieve data for compliance. Some tools excel at configuring controls or capturing security data but aren’t as strong at capturing application logs and transforming them into formats that mesh well with security logs to have an overlay picture.

Alerting/Reporting

Again, most tools provide canned reports, most also allow you to build your own reports. The key difference is some provider’s reports will be more relevant to an organization than others. An example of where the tool sprawl can become real is an organization with a security team that prefers the tailored security event reports from Alertlogic, an operations team that uses Datadog’s metrics for capacity planning and the developers use the ELK Stack to determine API performance issues. All three tools can create all three reports, but they do not specialize in providing all three. This key difference is what creates a tool sprawl challenge, in this case for reporting and alerting.

Multiple solutions mean what?

After reading the previous section, it is easy to see how companies choose multiple tools and vendors to solve their monitoring needs. In the following section, I’d like to examine some of issues that can result from having multiple monitoring solutions.

Multiple panes of glass

Having security data flow to one tool, systems performance data to another, and application data to a third makes correlation much more difficult. Even if you are able to have data sources feed multiple frontend tools, it still requires additional “stitching” to deliver the data in a meaningful way and the systems still present information differently. This can force the need to build translation jobs between solutions, or lengthy exports and manual correlation in spreadsheets. Nobody wants to do that.

Administration (and cost) is heavier

This means managing permissions through RBAC, customization of data feed sources, plug-in management, and supporting infrastructure must be considered. The resources and cost burden can become extremely heavy pretty quickly when designing for scale, high availability, and storage.

Additional automation

Every agent deployment, server component, data source, and tool configuration requires automation effort. It doesn’t matter whether you use a desired state configuration tool like Puppet, or an orchestrator like Ansible, or even custom scripts to configure your monitoring solution, there will be additional automation required per tool. Each automation will have its own tests, development, versioning, upgrades, and deployment lifecycle. This directly impacts the overhead of your engineering team.

Languages and APIs

Some tools output in JSON, others require transformation into usable formats through regex, grokking, or custom sed/awk style changes. Regardless, each tool has its own flavor of language and way of modeling data to be ingested by downstream components. This includes API calls, which can programmatically publish or pull data to and from the monitoring tools. In fact, having multiple tools that can’t share a data set sometimes require API calls to pull data from one source to another.

To Build or to Buy

We all love using open source software.

It’s free, there’s a community driving the project, and it allows us to avoid vendor lock-in and develop a set of skills we can take from one job to another. Building a monitoring system on top of open source is a choice many organizations make. There are some fantastic open source monitoring projects on the market.

But as a business grows, some monitoring tools begin to become a burden. Engineers end up spending more time maintaining these systems instead of the applications they are developing. When building open source monitoring systems, engineering teams should address and consider the following issues:

  • Design architecture with enough storage for growth, data retention, clustering considerations, performance tuning, failover strategy, or high availability.
  • How difficult is upgrading? How difficult is it to scale up storage and performance with automation or without it?
  • What alerts will be created at a minimum, and how they will send notifications?
  • What metrics should be collected, how should they be collected, and for how long?
  • What log analysis is required and can the tool perform the analysis out of the box, or is there required coding?
  • What reporting is required? Can the tool support dashboards and reports that you need? Will reports require additional development efforts?

Teams that are resource starved may be able to answer all of the above questions but not spend adequate time to implement everything required to have a fully mature monitoring solution(s). If your organization has the time and cycles to spend building an MVP or mature solution on open source tools, building is the right option.

Conversely, an engineering team may have less time to dedicate to building the solution and need more “out of the box” functionality. Specifically, the “designing architecture” considerations can be a large effort, especially for enterprises or customers dealing with a tremendous amount of systems and data. In the case of infrastructure, scaling, storage, and performance concerns, SaaS vendors solve many of these concerns as part of their offering. An additional benefit to SaaS tools is most vendors have cost models that grow with your monitoring needs. So instead of accounting for the scale and cost of built tools, this cost consideration is already built into the SaaS model.

Endnotes

There are a multitude of monitoring solutions on the market, both open source, and proprietary. There are many reasons why an organization will choose multiple tools to complete their monitoring picture, but in doing so, the sprawl creates additional challenges to overcome as detailed above. Weigh the pros and cons carefully before implementing your monitoring strategy.

Logz.io’s goal is to empower engineers to be more effective by providing them with the open source monitoring, troubleshooting and security tools they want to use, with the scalability, add-on features and availability required for monitoring modern IT environments. Offering a unified machine data analytics platform based on the ELK Stack and Grafana, Logz.io seeks to help solve the tool sprawl challenge.

More about this goal and our vision in a future article!

Use one platform for monitoring, troubleshooting and security.

Jenkins Build Monitoring with the ELK Stack and Logz.io

$
0
0

Jenkins is an extremely popular, open-source, continuous integration tool used for running tests, building code, and subsequently pushing to staging and then production. 

In a previous post, I outlined instructions for collecting, analyzing and visualizing Jenkins system logs. Jenkins system logs can be useful to monitor the general health of a Jenkins setup, especially in the case of a multi-node environment and I highly recommend exploring this option as outlined in the above-mentioned article, but in this piece, I will be focusing on Jenkins build logs.

Jenkins build logs contain a complete record of an execution’s output, including the build name, number, execution time, result, and more. If your pipeline is broken, this data can provide a wealth of information to help troubleshoot the root cause. Jenkins supports console logging but in case of a large amount of running jobs, it becomes difficult to keep track of all the activity–so collecting all this data and shipping it into the ELK Stack can help to give you more visibility.

Installing Jenkins

As a first step, and for those just getting started, let’s review how to install and set up a single Jenkins server. If you already have Jenkins up and running, skip right to the next step.

Jenkins can be installed in a variety of different ways, depending on your operating system and environment. In this case, I’ll be installing Jenkins using Ubuntu packages. I also recommend checking out system requirements before beginning the process.

Start by adding the repository key:

sudo wget -q -O - https://pkg.jenkins.io/debian/jenkins-ci.org.key | sudo apt-key add -

Next, add the package repository address to your ‘sources.list’:

sudo echo deb https://pkg.jenkins.io/debian-stable binary/ | sudo tee 
/etc/apt/sources.list.d/jenkins.list

Run update so you can use the new repository:

sudo apt-get update

To install Jenkins and its dependencies (this includes Java 8 also required for running Elasticsearch), use:

sudo apt-get install jenkins

Start the Jenkins server using:

sudo systemctl start jenkins

To open Jenkins, open your browser and enter the following URL:

http://<yourServerIP>:8080

You will then be required to enter an initial admin password available in the default installation directory. For Linux:

cat /var/lib/jenkins/secrets/initialAdminPassword

Follow the rest of the setup steps (installing plugins and creating a new admin user), and you should be all set and ready to go.

welcome to jenkins

Integrating with the ELK Stack

The integration with the  ELK Stack, either your own deployment or Logz.io (as demonstrated below) is done using a fork of a Jenkins plugin called logstash-plugin. The next step describes how to download, build, and install this plugin.

First, clone the plugin:

proxy configuration

git clone https://github.com/idohalevi/logstash-plugin

Next, use maven to build it:

cd logstash-plugin
mvn build

The building process takes a while, so be patient. Tip – if you don’t have Maven installed, you can use this Docker to run the build:

sudo docker run -it --rm --name logstash-plugin -v 
"$(pwd)":/usr/src/mymaven -w /usr/src/mymaven maven:3.3-jdk-8 mvn 
package

The end-result of this process is a logstash.hpi file located within the plugin directory at: logstash-plugin/target

Open Jenkins, and open the Advanced tab on the Manage Jenkins –> Manage Plugins page.

proxy configuration

Upload the logstash.hpi file in the Upload Plugin section. Jenkins will display a success message when done.

list

Select the Restart Jenkins checkbox to apply the changes.

Once Jenkins finished to reinstall, open the Manage Jenkins → Configure System page.

A section called Logstash appears in the middle of the page. Select the Enable sending logs to an indexer checkbox to open the configurations.

jenkins location

If you’re shipping to your own ELK deployment, enter the IP of your Elasticsearch instance and any authentication details if necessary. To ship to Logz.io, open the Indexer type drop-down, and select Logz.io.

Enter the following details:

  • Logz.io host – enter the URL of the Logz.io listener. If you are in the EU region insert https://listner-eu.logz.io:8071. Otherwise, use https://listner.logz.io:8071. You can tell which region you are in by checking the login url. If your environment says app.logz.io then you are in the US, if it says app-eu.logz.io then you are in the EU.
  • Logz.io key – Your Logz.io token. It can be found in your Logz.io app account settings.

logstash

Click Save to apply the configurations.

Verifying the pipeline

Now that we have the plugin installed and configured, it’s time to test that the integration with Logz.io is working and that build logs are actually indexed properly.

To test the pipeline, I will create a simple item in Jenkins that executes a bash script.

I have two options of sending the build logs to Logz.io, either line by line as the logs are generated by the build or in bulk, post-build.

To send the logs to Logz.io line by line, simply select the Send console log to Logstash checkbox in the item’s General section. In this case, however, I’m going to send the logs in bulk post-execution.  

In the Post Build Actions section at the end of the configurations, open the Add post-build action in the drop-down menu, and select Send console log to Logstash. You can then configure how many lines to send to Logz.io. To send all the data, enter ‘-1’.

post build actions

That’s it. Save the configuration, run your build and within a few seconds you should be seeing build console logs in Logz.io.

build console

Analyzing Jenkins build logs in Kibana

Now that the logging pipeline is up and running, it’s time to look into the data with some simple analysis operations in Kibana.

I like adding some fields to the main display area in Kibana to get some visibility into the data. Adding, for example, the ‘buildNum’, ‘projectName’ and ‘result’ fields helps to give us some context.

context

We can use a field-level Kibana query to look for specific builds, say failed builds:

result:FAILURE

failed builds

Things get more interesting when visualizing the data. Using Kibana’s different visualizations you can create a series of simple charts and metric visualizations to get you a nice overview of your Jenkins builds.

Let’s start with a simple metric visualization showing the number of failed vs. successful builds:

number of failures

Or, for example, you can create a pie chart displaying a breakdown of the build results:

pie

Or, for example, you can create a pie chart displaying a breakdown of the build results:

line

Once you’ve got your visualizations lined up, you can add them into one comprehensive dashboard.

dashboard

Bt the way, this dashboard is available in Logz.io’s dashboard and visualization library, ELK Apps so if you’re shipping you can hit the ground running by installing this dashboard instead of building your own from scratch.

Endnotes

If your Jenkins build pipelines are busy, visibility becomes an issue. In a microservices environment, with multiple Jenkins jobs running continuously, monitoring and troubleshooting failed builds is a challenge.

The benefit of using a centralized logging system is the ability to not only collect and store the data in one single location but use best-in-class analysis and visualization tools to drill down to the root cause of failed builds. The Logstash plugin used here is an easy way to integrate a Jenkins deployment with the ELK Stack to enjoy these benefits.

Get important insights from your Jenkins build logs with Logz.io.

Top 10 Logz.io Features and Announcements in 2018

$
0
0

What a year this has been for Logz.io! It’s been an event-packed year for both our users and our community, with a myriad of new capabilities and product features rolled out one after the other. 

We’ve done the best to update you on the major new additions and have also added a What’s New feature within the UI itself to make sure you don’t miss on the new goodies being introduced.

Still, the end of the year is a great opportunity for a recap and in this article, I’d like to highlight the top 10 announcements in 2018. Please note that the list below is not ordered by importance and does not include ALL the news.

#1 – Live Tail 2.0

Replacing tail -f, Live Tail allows you to see your logs streaming into the system in real time. Live Tail was announced in 2017 and has since been widely adopted by our users to troubleshoot issues and measure the impact of new code deployments.

In 2018, we’ve enhanced this feature by adding two new capabilities. First, users can now view the logs in a parsed state as well. Second, they can improve the way these logs are displayed by adding fields and using Kibana-like filters.

live tail

#2 – Alice Slack bot

We are a ChatOps-driven organization and so are many of our users. In 2018, we introduced a new Slack bot called Alice which allows you to query Elasticsearch, view Kibana dashboards, and plenty more right from within your own Slack org.

Alice

Alice is based on Logz.io’s public API and we intend to add support for more and more API methods in the near future.

You can read more about Alice here.

#3 – Security Analytics

Logz.io Security Analytics is a security app that we’ve built on top of the ELK Stack that allows you to apply the same procedures used for monitoring and troubleshooting your environment, for securing it as well.

security analytics

Based on the same data set used for operations, this app includes threat detection, correlations, security dashboards and integrations, and more.

More about Logz.io Security Analytics can be found in this article.

#4 – Apollo and Sawmill

Logz.io is built on top of two of the world’s most popular open source monitoring platforms — the ELK Stack and Grafana. We understand the importance of giving back to the open source community, and in 2018 we open sourced two projects that are used in our architecture — Sawmill and Apollo.

  • Sawmill is a Java Library that enables data processing, enrichments, filtering, /and transformations. After some hard-earned lessons from using Logstash,  Logz.io developed and implemented Sawmill in our data ingestion pipelines to ensure reliable and stable data ingestion.
  • Apollo is a Continuous Deployment tool for deploying containers using Kubernetes, and was developed to help Logz.io continuously deploy components of our ELK-based architecture into production.

#5 Logz.io Community

Other major 2018 news is the Logz.io Community on Slack which we announced in July.

The community, now numbering over 800 members, aims at providing its members with the tools to learn from peers, share knowledge and skills, and stay up-to-date with the latest monitoring and logging news from Logz.io and from the online community.

We’re super-thrilled to see this community slowly grow and would love to see you join the party if you haven’t already. You can register here.

#6 Markers

Markers is a capability added to our AI-powered Insights feature. Both Cognitive Insights and Application Insights help users deal with the “finding a needle in the haystack” challenge by using machine learning and crowdsourcing to surface critical issues that would otherwise have gone unnoticed.  The new Markers feature takes it up a notch by enabling users to understand the context in which these events are taking place.

Users can use a query to signify that an event has taken place and create a marker. This marker can then be plotted on the storyline graph to allows users to more easily identify a correlation between this event and the Insights identified and flagged by Logz.io.

markers

#7 Logz.io Academy and Online Docs

During 2018 we introduced two major resources to help our users make the best out of Logz.io — the Logz.io Academy and online documentation.

The Academy contains courses and webinars that will guide our users on their Logz.io journey. From the basics, through parsing and creating visualizations, users will find useful practical information to help them make the most out of the data shipped to Logz.io.

Our new docs contain technical information on the product’s main features and how to use them, including an extensive API guide which includes examples and detailed usage instructions.

Logz.io Academy

#8 Account Management

We revamped the account management page (Settings → Manage Account) to give users more control and supervision over how much data is being shipped with two new advanced account settings.

Each account now has the option to save account utilization metrics on a set schedule (every 10, 30 or 60 mins). These metrics include the used data volume for the account as well as the expected data volume for the current indexing rate. Once recorded, you can use these metrics to manage your Logz.io environment more actively — create an alert should a certain threshold be exceeded or create a dashboard monitoring your data volumes.

Manage Account

# 9 UI and UX

Kibana is a great tool and over the years we’ve developed a series of features on top of it to ensure our users can easily analyze their data.

2018 included many new usability enhancements, including an upgrade to Kibana 6 (easier search and filtering), a new account selector for filtering the data in the Discover page per subaccount, a What’s New pane for receiving updates on new features, brand new pages for alerts and optimizer configurations, and plenty more.

what's new

#10 Time Series Analytics (Early Availability)

I love ending a meal with a sweet course. At re:Invent we announced the early availability of our Time Series Analytics app.

Built on top of Grafana, this app was designed for collecting, storing and analyzing metrics. Users can now monitor and troubleshoot their applications and the infrastructure they are deployed on using Kibana and Grafana, side-by-side. Dedicated accounts for cost-efficient storage will allow users to store metrics for extended retention periods.

The app is in Early Availability mode, and you can read more about it here.

Endnotes

Logz.io’s goal is to empower engineers to monitor, troubleshoot and secure their applications and services more efficiently by providing a scalable and intelligent machine data analytics platform built on top of open source.

The new features and announcements we made during  2018 is one more step in achieving this goal. Looking forward into 2019, there are a lot of exciting new features on the roadmap and we will be sure to share the news as it becomes available.

We rely on your input to make our platform even better so feel free to drop us a line with ideas, comments, and feedback.

Happy new year!

Experience all of Logz.io's new features for yourself.

How to Stay Ahead of Data Retention Requirements – Part 1

$
0
0

Record keeping tasks such as data retention and disposal are an essential part of business management and regulatory compliance. 

At its core, data retention is about data control—meaning that an organization has taken steps to identify data throughout its organization, and then assess its importance, determine how long it will keep it, and then dispose of it. This topic also forces a discussion about how to access data, and how to protect data, but it is important to clarify that “data retention” from a compliance or regulatory perspective, is mostly about data governance and does not necessarily specify tools or data management tools.

Why retain data?

In today’s world of highly sensitive data categories (e.g. privacy, health, cardholder, financial, tax, etc.) and increasing regulations, organizations are being forced to clarify data management practices and make certain they take retention rules into consideration.

Regardless of whether a business is required to have extensive retention rules, they may find that their customers, vendors, or partners have requirements and include downflow requirements in contracts and agreements that affect your business practices.

Before an audit or an external assessment occurs, it would be prudent to consider best practices and strategies that are most likely to impact your business.

In this series, we will review data retention requirements and challenges as well as some best practices to overcome them.    

Regulatory requirements

Regulations and compliance programs across the business spectrum address data management and data retention. If you are not already facing specific regulatory requirements, then you should consider those regulations that impact your clients and partners.

You won’t have to look far.

For example, in the United States, securities broker-dealers must retain customer account records for at least six years after the account is closed. Financial institutions, casinos and other businesses must retain records required by the Bank Secrecy Act for a period of five years. Additionally, bank records that are not authorized for destruction after a specific period of time must be retained permanently.

Companies outside the financial services industry have similar obligations. Employers subject to the Fair Labor Standards Act must retain payroll records for at least three years, and the Equal Employment Opportunity Commission requires private employers to retain personnel records for one year after the employment ends.

The following table outlines some common regulatory / compliance sources by business category and includes a snippet of retention language from rules or standards.

Regulation-Compliance program
Impact
Businesses
Retention language samples
PCI[I]
Impacts any business that works with credit cards, or credit card processing, to protect cardholder data.
Banks, retail, anyone accepting payment via credit cards, financial transaction processors.
PCI DSS 3.1 – limit protected cardholder data storage to limits specified in company policy, and in alignment with legal or regulatory constraint.
GLBA, FFIEC[II]
Banks and financial institutions must meet minimum standards for data processing security to protect privacy, confidentiality, and availability of information.
Banks, financial institutions, insurance, lenders.
FFIEC – II.C.22 – Policies should define retention periods for security and operational logs. Institutions maintain event logs to understand an incident or cyber event after it occurs.
HIPAA[III]/HITECH
Impacts any business in the healthcare industry to protect the confidentiality of healthcare data.
Hospitals, doctor’s offices, medical services, healthcare billing, health research, Insurance.
§ 164.105 A covered entity must retain the documentation as required for 6 years from the date of its creation or the date when it last was in effect, whichever is later. § 164.512 An adequate plan to destroy the identifiers at the earliest opportunity consistent with conduct of the research, unless there is a health or research justification for retaining the identifiers or such retention is otherwise required by law.
FISMA[IV]/NIST 800-171
Addresses security of all IT systems storing or processing government data.
Federal agencies, state organizations, any contractors to federal government organizations that process / store government data.
NIST 800-53, SI-11 – the organization handles information within the information system; handles output from the information system, retains information within the information system; and retains output from the information system.
State/Government laws on Privacy
Impacts any business that has information that includes personally identifying information.
Any business with data related to the jurisdiction.
Rhode Island – IDENTITY THEFT PROTECTION law (2015)[V]
11-49.3-2. A municipal agency, state agency, or person shall not retain personal information for a period longer than is reasonably required to provide the services requested, to meet the purpose for which it was collected, or in accordance with a written retention policy or as may be required by law. A municipal agency, state agency, or person shall destroy all personal information, regardless of the medium that such information is in, in a secure manner, including, but not limited to, shredding, pulverization, incineration, or erasure.

There is some commonality to all the programs listed above.

First, all these regulations presume that data management is performed as a core function of the organization. Second, compliance with these rules address IT governance and controls towards protecting and maintaining data and processing systems.

A compliance approach for data retention

Applying security controls prescribed by regulations and compliance programs can be challenging.

For instance, failure to retain sensitive data or recall subject data on demand can result in significant fines [vi] and certainly harsh assessment actions. As such, it is important for organization

s to create a comprehensive data retention plan.

Identify your data

Data must be identified within systems. For instance: regulated privacy information, or cardholder data, is associated with systems and networks. Assessment of data should be specific enough to determine when/where the data enters the systems, if it is transformed and possibly captured in logs and databases, and where it is physically and logically located.

The assessment process might generate artifacts such as a Privacy Impact Assessment (PIA) or data flow diagrams that illustrate where/when data is moved or stored. Assessment should include addressing any specific requirements from regulation or contracts for retention periods.

Secure your data

Those systems with identified data should have strong security (addressing Confidentiality, Availability, and Integrity) to provide assurance that data is protected and accessible to appropriate parties.

For sensitive data, such as privacy information or customer data, this might imply strong access controls, logging of access and important transactions, and —very typically—the use of encryption for data in transit or at rest.

Typically, strong security is evidenced with access control procedures, capacity assessment for data retention, encryption processes, and backup and restore procedures.

Deploy security systems

Security management/governance of the systems must be applied and verified. This means the organization setup policies, procedures, and retention schedules to address security and oversight of the sensitive data it possesses. These controls typically include the company-specific methods of managing security, and often relate to service level agreements (SLA) or other imposed quality controls.

For instance, addressing business continuity and disaster recovery typically requires backups of important data. Policy and procedures dictate the retention period of data stored in backups or in log files. Standards specify the type of encryption used by the company in data storage and transit.

Delete retained data

Permanent deletion of the retained data must also be part of any retention policy. This is particularly challenging if data is determined to exist in transaction logs or backed up in multiple systems. One common method to address secure deletion of data is done by encrypting the data when stored, and then deleting the encryption key after a specified retention period. Otherwise, it will be important to prepare for how backups of combined records might be stored and disposed of.  

To verify how these policies or procedures are implemented, the company should document standards, train staff, and test controls, (e.g. backup and restore capabilities) to verify they work as planned.

Summing it up

It is clear that data retention policies are a challenge for organizations. Taking a compliance approach for data retention is becoming increasingly important for businesses but it involves organizational changes.

The next part in this series will specify some of the common challenges with data retention that organizations will have to address as well as some best practices and strategies to tackle them.

Retain only the data you need with Logz.io's Data Optimizers and Timeless Accounts.


[i] PCI Standards Council is a coalition of major brands of credit cards. The Data Security Standard (DSS) provides the exact language of the controls expected. https://www.pcisecuritystandards.org/document_library[ii] Federal Financial Institutions Examination Council (FFIEC) a formal interagency body empowered to prescribe uniform principles, standards, and report forms for banks and credit unions. See https://ithandbook.ffiec.gov/it-booklets.aspx

also

Gramm-Leach-Bliley Act (GLBA) – The act, also known as the Financial Services Modernization Act of 1999, (Pub.L. 106-102, 113 Stat. 1338, enacted November 12, 1999), required the federal banking agencies to establish information security standards for financial institutions.

also

National Credit Union Administration 12 CFR Part 749: Record Preservation Program and Record Retention, Appendix A and B (N/A)

[iii]  Health Insurance Portability and Accountability Act of 1996 (HIPAA) Security Rule. The HIPAA Security Rule establishes national standards to protect individuals’ electronic personal health information that is created, received, used, or maintained by a covered entity. The Security Rule is located at 45 CFR Part 160 and Subparts A and C of Part 164.

https://www.hhs.gov/sites/default/files/ocr/privacy/hipaa/administrative/combined/hipaa-simplification-201303.pdf

[iv] Federal Information Security Management Act (FISMA) points to NIST 800-53 which provides details on security requirements. NIST 800-171 is a subset of 800-53 for the scope of businesses doing business with federal clients and maintaining federal information.  https://csrc.nist.gov/publications/detail/sp/800-53/rev-4/final

[v] Rhode Island Senate Bill 134 (2015) https://legiscan.com/RI/text/S0134/2015

[vi] Particularly for regulations such as HIPAA and programs like PCI. PCI fines range from $5,000 to $100,000 a month.

Violation Amount per violation Violations of an identical provision in a calendar year
Did Not Know $100 – $50,000 $1,500,000
Reasonable Cause $1,000 – $50,000 $1,500,000
Willful Neglect — Corrected $10,000 – $50,000 $1,500,000
Willful Neglect — Not Corrected $50,000 $1,500,000

Source: HHS, Federal Register.gov


Benchmarking Elasticsearch with Rally

$
0
0

If you rely on Elasticsearch for centralized logging, you cannot afford to experience performance issues. Slow queries, or worse — cluster downtime, is not an option. Your Elasticsearch cluster needs to be optimized to deliver fast results. 

The problem is that optimizing Elasticsearch for performance is one of the major challenges facing any team running Elasticsearch at scale. There are so many factors to take into consideration — cluster size, node roles, the number of indices and shard size to name a few. While there are no official rule-of-thumb recommendations for most of these variables, one best practice is to continuously test and benchmark the performance of your cluster.

In a previous article, we wrote about a simple Dockerized benchmarking tool we use to test our Elasticsearch clusters, but in this article, I’d like to cover Rally — a benchmarking tool developed by the folks at Elastic that is a bit more complex and covers a wide range of use cases and configurations.

What is Rally?

Initially announced back in 2016, Rally 1.0 was only released in July 2018 and is the benchmarking tool used by the Elasticsearch development team to run their nightly benchmarking tests.

The beauty about Rally is that it can act not only as a load generator but it can also build, set up and tear down Elasticsearch clusters for you which helps you test in a vanilla environment. You can use Rally to benchmark against an existing Elasticsearch cluster, manage benchmark configurations, run and compare results, and find potential performance issues using what are called telemetry devices (e.g. JIT, GC, perf).

Let’s take a closer look.

Installing Rally

The required steps for installing Rally depend on how you intend to conduct your benchmarking — against an existing Elasticsearch cluster or against a vanilla cluster that will be provisioned as part of the test.

The steps below include all the prerequisites needed for the latter scenario. In any case, I recommend referring to Rally’s documentation before you start for different instructions per OS and scenario.

For setting up and installing Rally on Ubuntu, first install python3 and pip:

sudo apt update
sudo apt-get install gcc python3-pip python3-dev

Then, install git:

sudo apt install git

Since we want Rally to install Elasticsearch, we will need to Install JDK as well:

sudo apt install default-jdk

You’ll need to also set the JAVA_HOME environment variable to point to the JDK you installed:

sudo vim /etc/environment
JAVA_HOME="/usr/lib/jvm/java-8-openjdk-amd64"

Verify with:

source /etc/environment
echo $JAVA_HOME

Last but not least, install Rally with:

sudo pip3 install esrally

Configuring Rally

Before you run Rally, it needs to be configured.

You can configure a set of advanced settings using the –advanced-config flag (more about this later), but if you simply run Rally it will execute a simple configuration that auto detects settings and chooses default settings:

esrally


    ____        ____
   / __ \____ _/ / /_  __
  / /_/ / __ `/ / / / / /
 / _, _/ /_/ / / / /_/ /
/_/ |_|\__,_/_/_/\__, /
                /____/

Running simple configuration. Run the advanced configuration with:

  esrally configure --advanced-config

* Setting up benchmark root directory in /home/ubuntu/.rally/benchmarks
* Setting up benchmark source directory in /home/ubuntu/.rally/benchmarks/src/elasticsearch

Configuration successfully written to /home/ubuntu/.rally/rally.ini. Happy benchmarking!

More info about Rally:

* Type esrally --help
* Read the documentation at https://esrally.readthedocs.io/en/1.0.2/
* Ask a question on the forum at https://discuss.elastic.co/c/elasticsearch/rally

Running a test (aka race)

Before you run your first benchmark test, let’s understand some of the Rally terminology:

esrally list tracks

You should see a list of track names and descriptions, together with the size of the data (compressed and uncompressed) and available challenges you can run.

When running a race, you will need to define the version of Elasticsearch you want to benchmark on as well as the track and challenge name (be sure to run Rally as a non-root user):

  • Race – a benchmarking experiment.
  • Track – a benchmarking scenario.

So you will be running a race using a track.

To see what kind of benchmarking scenarios you have available, use:

esrally --distribution-version=6.5.0 --track=http_logs 
--challenge=append-no-conflicts

Rally will commence the test by first downloading the Elasticsearch version you defined and the relevant data. It will then run the actual benchmark and report the results.

It will take quite a while, so be patient.

At the end of the race, you will see a detailed report displayed via stdout. Here is a sample of some of the metrics included in the report:

------------------------------------------------------
    _______             __   _____
   / ____(_)___  ____ _/ /  / ___/_________  ________
  / /_  / / __ \/ __ `/ /   \__ \/ ___/ __ \/ ___/ _ \
 / __/ / / / / / /_/ / /   ___/ / /__/ /_/ / /  /  __/
/_/   /_/_/ /_/\__,_/_/   /____/\___/\____/_/   \___/
------------------------------------------------------

|   Lap |                               Metric |                   Task |      Value |    Unit |
|------:|-------------------------------------:|-----------------------:|-----------:|--------:|
|   All |                  Total indexing time |                        |    21.3582 |     min |
|   All |          Min indexing time per shard |                        |    3.61242 |     min |
|   All |       Median indexing time per shard |                        |    3.81058 |     min |
|   All |          Max indexing time per shard |                        |    6.00437 |     min |
|   All |                     Total merge time |                        |    21.5519 |     min |
|   All |             Min merge time per shard |                        |    3.86743 |     min |
|   All |          Median merge time per shard |                        |    4.14517 |     min |
|   All |             Max merge time per shard |                        |    5.28807 |     min |
|   All |            Total merge throttle time |                        |   0.117617 |     min |
|   All |    Min merge throttle time per shard |                        |  0.0117333 |     min |
|   All | Median merge throttle time per shard |                        |  0.0140667 |     min |
|   All |    Max merge throttle time per shard |                        |     0.0455 |     min |
|   All |                   Total refresh time |                        |    9.50888 |     min |
|   All |           Min refresh time per shard |                        |     1.7852 |     min |
|   All |        Median refresh time per shard |                        |     1.8887 |     min |
|   All |           Max refresh time per shard |                        |    1.99403 |     min |
|   All |                     Total flush time |                        |    0.03755 |     min |
|   All |             Min flush time per shard |                        | 0.00398333 |     min |
|   All |          Median flush time per shard |                        |    0.00765 |     min |
|   All |             Max flush time per shard |                        |  0.0116333 |     min |
|   All |                     Median CPU usage |                        |       97.9 |       % |
|   All |                   Total Young Gen GC |                        |    157.366 |       s |
|   All |                     Total Old Gen GC |                        |      1.068 |       s |
|   All |                           Store size |                        |   0.835177 |      GB |
|   All |                        Translog size |                        |    1.00106 |      GB |
|   All |                           Index size |                        |    1.83624 |      GB |
|   All |                      Totally written |                        |    6.54809 |      GB |
|   All |               Heap used for segments |                        |    5.49747 |      MB |
|   All |             Heap used for doc values |                        |  0.0361557 |      MB |
|   All |                  Heap used for terms |                        |    5.13023 |      MB |
|   All |                  Heap used for norms |                        |  0.0531006 |      MB |
|   All |                 Heap used for points |                        |  0.0679445 |      MB |
|   All |          Heap used for stored fields |                        |   0.210037 |      MB |
|   All |                        Segment count |                        |         74 |         |
----------------------------------
[INFO] SUCCESS (took 6812 seconds)
----------------------------------

Based on your chosen track (http_logs in our case), Rally shows various metrics indicating how Elasticsearch performed. For example, Rally reports how long it took to index all the documents and perform a merge:

|   All |                  Total indexing time |                        |    21.3582 |     min |
|   All |                     Total merge time |                        |   14.6848 |     min |

The report Rally provides is extremely detailed. You can take a look at all the different metrics made available and what they mean in Rally’s documentation.

Analyzing results in Kibana

As I mentioned above, Rally supports a variety of advanced configurations, including the ability to store benchmark metrics in an Elasticsearch index for analysis in Kibana.

To use this option, you will, of course, need a separate Elasticsearch and Kibana deployment.

To run the advanced configuration routine, use:

esrally configure --advanced-config

A series of configuration settings are displayed. Just run with the default settings, but for Metrics store type, enter 2 for storing on Elasticsearch and then provide connections settings as requested — your Elasticsearch hostname (default is localhost) and port and authentication details if you’re using X-Pack.

Once you run a race, you will see a Rally metrics index:

curl -X GET "localhost:9200/_cat/indices?v"

health status index                 uuid                   pri rep docs.count docs.deleted store.size pri.store.size
yellow open   rally-races-2018-12   CjaNkA5ZSv-NR4kna_6vcg   1   1         16            0     37.5kb         37.5kb
green  open   .kibana_1             _2L8d15cRKSY8mk23tfKlw   1   0          3            0     11.9kb         11.9kb
yellow open   rally-metrics-2018-12 8QCNwy11RcetDfzQDVkJng   1   1      31249            0      3.8mb          3.8mb
yellow open   rally-results-2018-12 kYk8JRleTk-l5k-nwO4cxw   1   1         85            0     27.5kb         27.5kb

We can then define this index in Kibana:

create index pattern

rallly metrix

logs

Endnotes

I just touched the surface of what Rally can do. I ran Rally using one of the provided tracks and a provisioned Elasticsearch cluster, but you can create your own customized tracks, test against remote Elasticsearch clusters, and create tournaments (comparing races for measuring performance improvements).

Rally is not easy to handle and requires a good understanding of the ins and outs of Elasticsearch performance metrics, but the information Rally provides gives you a good understanding of how Elasticsearch is performing under different loads and what is required for optimization.

Before using Rally on your own Elasticsearch clusters, use the instructions here to play around with the tool and become familiar with its operation. Once you feel you’ve gained familiarity with Rally, run it in a sandboxed environment. In any case, do not run Rally against production clusters.  

Experience hosted Elasticsearch that scales as you grow

How to Stay Ahead of Data Retention Requirements – Part 2

$
0
0

In part 1 of this series, we tried to outline what data retention is and why it is needed to overcome increasing requirements for various regulatory standards. As detailed, there are some clear guidelines for organizations to take what we called a “data retention approach for compliance”. 

In this follow up post, outline some specific technological and procedural challenges you might face as well as some practical guidelines and strategies to overcome them.

Data Retention Challenges

There are a number of important challenges with data retention that many organizations will have to address. Some of the common ones are listed here:

  1.  Requirements for different data classifications from various sources can proliferate. Be cautious about accepting categorization from different customers, regulations, and other security programs for alignment with their data classifications (for instance: PII, PHI, and PD are all categories of privacy data from different regulations).
  2. Requirements for retention and disposal should be balanced by your organization’s needs and requirements. You may find requirements from customers are in conflict (e.g. retain nothing longer than 90 days vs. retention should be at least 180 days). An ability to address these different requirements is a resource and management issue.
  3. Identifying sensitive data can be hard. It may feel easier to just protect all your data at a common/higher than required security classification. This may backfire if the costs for encryption, or retention, are difficult to scale.
  4. Your retention schedule says you keep data for a specific period, but you’ve never deleted anything. Remember that audits, regulatory orders, and assessments often review any data you have retained, regardless of retention schedule. This may not concern you, but your customers may have strong feelings otherwise.

Data Retention Strategies

Organizations that operate with minimal personnel and resources might not see much immediate value in data management activities such as data retention.

They may associate “saving” (or not disposing of) data with being sufficient. However, if security, compliance, or legal requirements arise, saving all data may not be sufficient since data governance activities imply the organization tracks its data, protects data based on importance, and has disposed of information that is no longer needed.

Some strategies that can help are:

  1. Assess company data for customer/regulatory categories to find a balanced approach to data classification within your organization. If a data set maintained by your organization is critical for your and your clients’ business, then it may suffice to be classified with a single category. Having fewer categories may be more useful to staff who are expected to take actions based on the classification. If you do classify different data sets as one, provide guidance for staff and assessors on how the approach is consistent.
  2. Businesses that process multiple clients’ data and offer service level agreement (SLA) should consider a single retention schedule for customer data/backups/logs instead of negotiating different schedules for each client.
  3. Carefully identify proprietary or intellectual property. That information may require special protections regardless of retention archive/disposal schedule.
  4. Double check federal and state regulation and industry trade groups for changes to compliance requirements for your/your customer industries. This should be done at least annually to pick up on important changes to retention requirements on topics like privacy data.
  5. Identify data that must be kept for legal compliance (e.g. discovery) requirements to ensure the data is retained appropriately (i.e. you may need to archive rather than dispose of data after a certain retention time).
  6. Examine all data sets in the company to examine possible value and risk to the company. When you find data that has no particular value or risk, you may be able to dispose of it immediately—and that could save your organization requirements for data storage and maintenance.

A few technical pointers

One common data retention best practice is to automate specific actions which help ensure the retention policy. To do that, however, often requires that you electronically classify or segregate data to ensure that the auto-retention processes (autodelete for example) are performing on the correct data set. Therefore, you must work with your data and network staff to implement tactics for improving segregation of sensitive data as well as improving integration with technologies that can help identify sensitive data in your environment.

Rather than trying to implement an enterprise-wide data retention program, it may be advantageous to automate retention for a specific data category or type.

Ensure that any data retained (such as for contractual purposes) is maintained in a searchable/usable fashion. This may result in needing tools to help index or encrypt data on the fly.

The cost of retention of large data sets is not insignificant, and many IT organizations find the costs become a limitation of the retention program. The solution to this is to find and use tools that improve the ability to compress and de-duplicate data wherever possible.

Conclusion

Retention requirements for your business may have direct requirements dictated by your industry or may be inherited through customers or other legal relationships. The goal of your business is to address retention as part of data management by identifying what, where, and how data is stored, classified, and deleted. A major artifact of data management is creating policies and procedures to help guide your staff and help you to select automation that can facilitate data management.  

Retain only the data you need with Logz.io's Data Optimizers and Timeless Accounts.

The Challenge of Log Management in Modern IT Environments

$
0
0

Gaining visibility into modern IT environments is a challenge that an increasing number of organizations are finding difficult to overcome.  

Yes–the advent of cloud computing and virtually “unlimited” storage has made it much easier to solve some of the traditional challenges involved in gaining visibility. However, architecture has evolved into microservices, containers and scheduling infrastructure. Software stacks and the hardware supporting them are becoming more complex, creating additional and different challenges. These changes have directly impacted the complexity of logging and it takes a very specific set of tools and strategies to be able to solve this visibility challenge.

Understanding the challenge

Log data is one of the cornerstone requirements for overcoming this challenge. Yet nearly every application, appliance, and tool today generates an ever-increasing stream of log messages containing a wealth of information on what happened, when and why. These sources are often distributed on-premise, on the cloud or across different clouds.

In today’s world, old school methodologies are no longer viable:

  • Distributed systems, whether based on the traditional server/client model, or containers and cloud services, generate a huge amount of logs that are not only expensive to store, but also query.
  • Effective monitoring must be done in real time. If an application crashes, teams need to be able to be effectively alerted so as to perform a fast troubleshooting process.
  • Logs are generated by devices, applications, servers, and in different formats. If logs are simply shipped as flat files to sit on a file server, it takes significant effort to perform any kind of analysis.
  • Most importantly: cloud-based architecture requires efficient logging, alerts, automation, analysis tools, proactive monitoring, and reporting. Old school logging supports none of this.

Centralized logging concepts

Modern log management must include log analysis capabilities and perform aggregation, processing, storage, and analysis. These components must be designed on top of cloud principles: high availability (HA), scalability, resiliency, and automation.

  • Aggregation – the ability to collect and ship logs from multiple data sources.
  • Processing – the ability to transform log messages into meaningful data for easier analysis.
  • Storage – the ability to store data for extended time periods to allow for monitoring, trend analysis, and security use cases.
  • Analysis – the ability to dissect the data by querying it and creating visualizations and dashboards on top of it.
  • Alerting – the ability to get notified when an event is taking place in real-time  

Cloud principles for a log management solution

Now that we’ve covered the core elements comprising a modern log management system, we will cover the cloud principles that must be considered when trying to build a visibility solution into your environment. This will illustrate the challenges they bring to maintaining the solution.

  • High availability – building for High Availability (HA) means eliminating single points of failure and that failures cause no, or little to no, disruption of service. In cloud environments such as AWS, this means building a log management solution that is deployed on more than one availability zone and possibly more than one region and includes a data replication mechanism using a service such as S3.
  • Scalability – This is critical for most cloud services and the hardest to manage in log management solutions. This is because some services are either bound by storage, indexing, and/or clustering, which requires careful management behind the scenes. Other services, such as forwarders and log shippers are easily scaled to meet demands.
  • Upgrades – Upgrades are common activities in nearly every service. When you are talking several interconnected visibility components with clustering, storage, reindexing, etc., the effort becomes a large project in itself. Resilience – This principle refers not only to the storage layer (uptime and loss prevention) but also to avoiding service disruption. Where this differs from HA, is the ability for the architecture of your solution to continue to operate in the face of updates, migrations, zone failures, or the ability to recover data in the case of deletion/corruption.

Summing it up

It should be apparent that managing a full-scale solution for log management in modern software requires a considerable amount of planning. It doesn’t mean it can’t be done — of course, it can be done. It just means you need to plan carefully and make a knowledgeable decision.

For helping you decide whether to implement your own do-it-yourself log analytics solution or opt for a SaaS provider such as Logz.io, here is a checklist to help you get the most out of your operations.

Your log management solution must:

  • Support cloud-native log aggregation for: containers, container orchestration and cloud services.
  • Support a processing engine which is able to transform logs as necessary (ETL or grokking)
  • Support storage that is cloud-native or auto-replicated between nodes. Ideally, storage can be scaled automatically.
  • Support data retention that is configurable, preferably archivable utilizing cheaper storage tiers.
  • Support advanced analytics such as anomaly detection and machine learning.
  • Support integration into notification tools, such as Slack or Hipchat (sometimes called ChatOps), email.
  • Support custom metrics and dashboards and include pre-built dashboards and integrations with cloud services.
For the full checklist, download the Challenge of Log Management in Modern IT Environments White Paper.
Viewing all 198 articles
Browse latest View live


Latest Images