Quantcast
Channel: Daniel Berman is Product Evangelist at Logz.io
Viewing all 198 articles
Browse latest View live

Docker Stats Monitoring: Taking Dockbeat for a Ride

$
0
0

docker monitoring dockbeat

There is no silver bullet. This is how I always answer those asking about the best logging solution for Docker. A bit pessimistic of me, I know. But what I’m implying with that statement is that there is no perfect method for gaining visibility into containers. Dockerized environments are distributed, dynamic, and multi-layered in nature, so they are extremely difficult to log.

That’s not to say that there are no solutions — to the contrary. From Docker’s logging drivers to logging containers to using data volumes, there are plenty of ways to log Docker, but all have certain limitations or pitfalls. Logz.io users use a dedicated container that acts as a log collector by pulling Docker daemon events, stats, and logs into our ELK Stack (Elasticsearch, Logstash and Kibana).

That’s why I was curious to hear about the first release of Dockbeat (called Dockerbeat prior to Docker’s new repo naming conventions) — the latest addition to Elastic’s family of beats, which is a group of different log collectors developed for different environments and purposes. Dockbeat was contributed by the ELK community and is focused on using the docker stats API to push container resource usage metrics such as memory, IO, and CPU to either Elasticsearch or Logstash.

Below is a short review of how to get Dockbeat up and running as well as a few personal first impressions by me. My environment was a locally installed ELK Stack and Docker on Ubuntu 14.04.

Installing Dockbeat

To get Dockbeat up and running, you can either build the project yourself or use the binary release on the GitHub repository. The former requires some additional setup steps (installing Go and Glide, for starters), and I eventually opted for the latter. It took just a few steps and proved to be pretty painless (an additional method is to run Dockbeat as a container — see the repo’s readme for more details).

You will first need to download the source code and release package from: https://github.com/Ingensi/dockbeat/releases

$ git clone https://github.com/Ingensi/dockbeat.git
$ wget https://github.com/Ingensi/dockbeat/releases/download/v1.0.0/dockbeat-v1.0.0-x86_64

Configuring and Running Dockbeat

Before you start Dockbeat, there is the matter of configurations. Since I used a vanilla installation with Docker and ELK installed locally, I did not need to change a thing in the supplied dockbeat.yml file.

Dockbeat is configured to connect to the default Docker socket:

dockbeat
   socket: ${DOCKER_SOCKET:unix:///var/run/docker.sock}

My local Elasticsearch was already defined in the output section:

### Elasticsearch as output
     elasticsearch
          hosts: [“localhost:9200”]

Of course, if you’re using a remotely installed Elasticsearch or Logstash instance, you will need to change these configurations respectively.

Before you start Dockbeat, you will need to grant execution permissions to the binary file:

$ chmod +x dockbeat-v1.0.0-x86_64

Then, to start Dockbeat, use the following run command:

./dockbeat-v1.0.0-x86_64 -c dockbeat-1.0.0/dockbeat.yml -v -e

Please note: I used the two optional parameters (‘-v’, ‘-e’) to see the output of the run command, but these, of course, are not mandatory.

Dockbeat then runs, and if all goes as expected, you should see the following lines in the debug output:

2016/09/18 09:13:40.851229 beat.go:173: INFO dockbeat successfully setup. Start running.
2016/09/18 09:13:40.851278 dockbeat.go:196: INFO dockbeat%!(EXTRA string=dockbeat is running! Hit CTRL-C to stop it.)
2016/09/18 09:14:47.101231 dockbeat.go:320: INFO dockbeat%!(EXTRA string=Publishing %v events, int=5)
...

It seems like all is working as expected, so my next step is to ping Elasticsearch:

$ curl localhost:9200/_cat/indices

The output displayed displays a cross-section of Elasticsearch indices:

yellow open dockbeat-2016.09.18 5 1 749 0 773.7kb 773.7kb

yellow open .kibana             1 1   1 0   3.1kb   3.1kb

The next step is to define the index pattern in Kibana. After clicking on the Setting tab in Kibana, I entered dockbeat.* in the index name/pattern field and selected the @timestamp filter to create the new index pattern:

configure kibana index pattern

Now, all the metrics collected by Dockbeat and stored by Elasticsearch are listed in the Visualize tab in Kibana:

dockbeat logs elasticsearch

Analyzing Container Statistics

The metrics collected by Dockbeat via the docker stats API are pretty extensive and include container attributes, CPU usage, network statistics, memory statistics, and IO access statistics.

To gain some more visibility into the log messages, I added some of the fields from the menu shown on the left in the above screenshot. I started with the ‘type’ and ‘containerName’ fields and then explored some of the other indexed fields.

Querying options in Kibana are varied  — you can start with a free-text search for a specific string or use a field-level search. Field-level searches allow you to search for specific values within a given field with the following search syntax.

To search for logs for a specific container, I entered the following query in Kibana:

containerName: jolly_yalow

The result:

dockbeat container logs

Free-text search is the simplest query method, but because we are analyzing metrics, it is not the best way to go about analyzing the statistics unless you are looking for a specific container name.

Visualizing Container Stats

Visualizations are one of the biggest advantages of working with ELK, and the sky’s the limit as far as the number of container log visualizations is concerned. You can slice and dice the stats any way you like — it all boils down to what data you want to see.

Building visualizations in Kibana does require a certain amount of expertise, but the result is worthwhile. You can end up with a nice monitoring dashboard for your Docker containers.

Here are a few examples.

Number of Containers

Sometimes it’s easy to lose track of the number of containers we have running. In a production environment, this number can easily reach twenty per host or more. To see a unique count of the running containers, I used the Metric visualization to display a count of the ‘containerName’ field:

number of dockbeat containers

Average CPU/Memory/Network Over Time

Another example is to create a line chart that visualizes the average resource consumption per container over time. The configuration below is for network stats, but the same configuration can be applied to all types of metrics — all you have to do is change the field that is used to aggregate the Y Axis in the chart.

The configuration:

average cpu memory over time

The resulting line chart:

dockbeat line chart

Compiling these visualization into one dashboard is easy — it’s simply a matter of selecting the Dashboard tab and then manually adding the visualizations.

The Bottom Line

Dockbeat was easy to install and get up and running — it worked right out of the box in my local sandbox environment and required no extra configurations! If you’re looking for a lightweight monitoring tool, Dockbeat is a good way to start.

As I said in the introduction, there is no perfect logging solution for Docker. Containers produce other useful output information including Docker daemon events (such as attach, commit, and copy) and Docker logs (where available), and these are not collected by Dockbeat even though they are necessary to get a more holistic monitoring view of a Dockerized environment.

Looking ahead, this seems like the logical next addition for this community beat.

Daniel Berman is Product Evangelist at Logz.io. He is passionate about log analytics, big data, cloud, and family and loves running, Liverpool FC, and writing about disruptive tech stuff.

Installing the Elastic Stack 5.0 Beta

$
0
0

elastic stack 5 beta

After five alpha versions, Elastic recently announced the availability of the first beta version of the long awaited Elastic Stack 5.0 (the new name for ELK). If Elastic feels this version is stable enough to begin beta testing, that’s good enough for me!

Since I was curious to check out the new features in this version and am always happy to test new software, I decided to take her for a ride on an Ubuntu 14.04 deployed on AWS.

Here are the installation steps that I took to get the stack installed as well as a few tips and side notes that might be useful to anyone headed down the same path.

Installing Java

As always, the stack requires that Java be installed. As opposed to previous versions, though, the required Java version here is 8. If you don’t have Java installed, follow these commands:

$ sudo add-apt-repository ppa:webupd8team/java
$ sudo apt-get update
$ sudo apt-get install oracle-java8-installer

After successfully installing Java, verify the version of Java that is installed with the following command:

$ java -version

java version "1.8.0_101"
Java(TM) SE Runtime Environment (build 1.8.0_101-b13)
Java HotSpot(TM) 64-Bit Server VM (build 25.101-b13, mixed mode)

System Configurations

Before we begin the installation process, there are some needed system configurations that are not specified in the official documentation but will cause issues with running Elasticsearch down the road.

First, you need to set the value for the vm.max_map_count (max virtual memory) in /etc/sysctl.conf as follows:

vm.max_map_count=262144

Next, set the number of open files (file descriptors) in your /etc/security/limits.conf file:

*    soft nofile 64000
*    hard nofile 64000

Log out and log back in to apply changes.

Installing Elasticsearch

We will start the process of installing ELK, as usual, with the installation of Elasticsearch.

Please note that, for now, the only way to install the beta version of Elasticsearch 5.0 is by downloading the package from Elastic’s downloads page. Installation via apt or yum is not yet supported.

Download and extract the package:

$ curl -L -O https://artifacts.elastic.co/downloads/elasticsearch/elasticsearch-5.0.0-beta1.tar.gz

$ tar -xvf elasticsearch-5.0.0-beta1.tar.gz

There are some needed network configurations before starting Elasticsearch. In the /config folder, open the elasticsearch.yml file and enter these configurations:

network.host: 0.0.0.0
http.port: 9200

Last but not least, start Elasticsearch:

$ bin/elasticsearch

If all goes well, you should see a number of info messages outputted. These will include information on the loaded modules, configurations, and the Elasticsearch node IP address and port (127.0.0.1:9200).

To make sure that Elasticsearch is working as expected, enter the following query in your browser: http://<ServerIP>:9200

This is the output you should be seeing:

{
  "name" : "o5QSHOT",
  "cluster_name" : "elasticsearch",
  "cluster_uuid" : "23VPUCGzTgu854mFzLU6HQ",
    "version" : {
    "number" : "5.0.0-beta1",
    "build_hash" : "7eb6260",
    "build_date" : "2016-09-20T23:10:37.942Z",
    "build_snapshot" : false,
    "lucene_version" : "6.2.0"
  },
  "tagline" : "You Know, for Search"
 }

Installing Kibana

Next up, Kibana. There are no source packages available for the beta version of Kibana 5, so we will install Kibana using apt.

Download and install the Elastic public signing key:

$ sudo wget -qO - https://artifacts.elastic.co/GPG-KEY-elasticsearch | sudo apt-key add -

Next, add the repository definition to the /etc/apt/sources.list.d/kibana.list file:

$ sudo echo "deb https://artifacts.elastic.co/packages/5.x-prerelease/apt stable main" | sudo tee -a /etc/apt/sources.list.d/kibana.list

Update the system and install Kibana:

$ sudo apt-get update &amp;&amp; sudo apt-get install kibana

Kibana is installed, but there are some additional tweaks that need to be made to the configuration file before accessing it with your browser.

Open the configuration file at: /etc/kibana/kibana.yml.

Define the following directives:

server.port 5601
server.host 0.0.0.0

Restart Kibana to apply configurations:

$ sudo service kibana start

Access Kibana by entering the following URL in your browser: http://<ServerIP>:5601.

configure index pattern elastic stack

If you’ve used previous versions of the stack, Kibana’s new UI stands out immediately. But some things do not change! To be able to begin using Kibana, you need to first configure an index pattern.

Installing Filebeat

The next usual step when installing the ELK Stack would be to install Logstash — the traditional log shipper used for collecting and parsing logs before they are indexed in Elasticsearch. However, due to a number of reasons including reliability and resource consumption, Elastic and the community are gradually creating and moving towards using a collection of lightweight and dedicated log shippers called Beats:

$ curl -L -O https://artifacts.elastic.co/downloads/beats/filebeat/filebeat-5.0.0-beta1-amd64.deb

$ sudo dpkg -i filebeat-5.0.0-beta1-amd64.deb

The default configurations already have Filebeat tracking default system logs as well as a local installation of Elasticsearch defined as the output destination. All that’s left for us to do is start the service:

$ sudo /etc/init.d/filebeat start

Filebeat starts, and you will see a number of messages describing the configurations used.

Opening Kibana again, the next step is to enter an index pattern which I defined as: filebeat.*

enter elastic stack index pattern

Once defined, I select Discover from the menu on the left to view the messages being forwarded by Filebeat.

elastic stack kibana

From this point onwards — it’s up to you!

There’s little doubt that this version of the stack is a big change from older versions. I recommend reading up on the new features in our blog post covering the expected changes in the ELK Stack 5.0 as well as our review of Kibana 5, our overall Kibana tutorial, and our guide to creating Kibana visualizations.

Logz.io is a predictive, cloud-based log management platform that is built on top of the open-source ELK Stack and can be used for log analysis, application monitoring, business intelligence, and more. Start your free trial today!

Daniel Berman is Product Evangelist at Logz.io. He is passionate about log analytics, big data, cloud, and family and loves running, Liverpool FC, and writing about disruptive tech stuff.

Amazon EC2 Container System (ECS) Log Analysis – Part 2

$
0
0

amazon ecs logging part 2

In the previous post in this series, I explained how to log ECS container API actions with CloudTrail and ELK. In this second part of the series, I will describe how to log the Docker containers themselves.

There are various ways of logging Docker containers, each with its own advantages and disadvantages. Of course, the challenge in a Dockerized environment, whether on ECS or in a local Docker environment, is the fact that containers are transient, dynamic, and distributed in nature. Not only that, containers produce various types of outputs, so a logging solution that tracks Docker container output will not necessarily track Docker daemon events, for example.

In the steps below, I will describe two different methods for logging ECS Docker containers — one uses a Docker log collector that pulls container logs, stats, and daemon events into the Logz.io ELK Stack. The second option, uses the aws-logs logging driver to log container logs only to CloudWatch.

Prerequisites

This article assumes that you have an ECS cluster setup in AWS. If you do not have that setup and are just getting started with the service, I highly recommend this getting started with ECS console walk-through — it will take you through the steps for setting up a cluster that will service a simple web application. I also recommend reading up on the ECS service on the AWS documentation site.

Logging to the Logz.io ELK Stack

To pass container logs to the Logz.io ELK Stack using the log collector, we need to create a new task definition that includes a volume definition and passes the Logz.io token as an environment variable.

In the ECS console, select the Task Definitions tab on the left and then click the Create New Task Definition button.

Name the new task definition (e.g., ‘logzio-docker’), and if you have a specific IAM role you wish to attach to the task, enter it in the Task Role field.

Before we configure a new container, we are going to define a new data volume for our task to make sure that the data will persist even after all of the containers that referenced it have stopped.

Under the Volumes section, click Add volume, and enter the following volume:

add volume

Next, enter the following JSON configuration:

{
   "networkMode": "bridge",
   "taskRoleArn": null,
   "containerDefinitions": [
      {
         "volumesFrom": [],
         "memory": null,
         "extraHosts": null,
         "dnsServers": null,
         "disableNetworking": null,
         "dnsSearchDomains": null,
         "portMappings": [],
         "hostname": null,
         "essential": true,
         "entryPoint": null,
         "mountPoints": [
            {
               "containerPath": "/var/run/docker.sock",
               "sourceVolume": "docker-sock",
               "readOnly": true
            }
         ],
         "name": "logzio-docker",
         "ulimits": null,
         "dockerSecurityOptions": null,
         "environment": [
            {
               "name": "LOGZIO_TOKEN",
               "value": "logz-token"
            }
         ],
         "links": null,
         "workingDirectory": null,
         "readonlyRootFilesystem": false,
         "image": "logzio/logzio-docker",
         "command": null,
         "user": null,
         "dockerLabels": null,
         "logConfiguration": null,
         "cpu": 0,
         "privileged": true,
         "memoryReservation": 128
      }
   ],
   "volumes": [
      {
         "host": {
            "sourcePath": "/var/run/docker.sock"
         },
         "name": "docker-sock"
      }
   ],
   "family": "logzio-docker"
}

Make sure that you replace the ‘logz-token’ placeholder with your Logz.io account token before saving the configuration.

Also, please note that some of the container options used in this configurations are optional — change them as you see fit in terms of however it will suit your requirements. If this is your first time, you might want to use the new container wizard (just click Add container on the new task definition page).

The next step is to create (or update) the task and run it in your ECS cluster. If all goes well, you should see a green RUNNING status alongside the task in your cluster view.

All that’s left to do now is to open your Logz.io user interface and begin to analyze the logs:

analyze the logs

Remember, the log collector collects a mixture of logs — Docker daemon events, Docker logs, and Docker stats. Be sure to differentiate the different output types using the type field, as shown in the image above.

Analyzing and visualizing the logs

Great! You’ve shipped the ECS container logs into ELK. What next?

The next step is to begin to analyze the data, a task for which ELK is renowned due to its rich querying options and visualization features. Use Kibana to search container logs for events taking place in your environment, and use the visualizations to create your own monitoring dashboard.

To help you hit the ground running, you can use one of the ELK Apps — a library of free customized Kibana searches, alerts, visualizations, and dashboards — to install a pre-built dashboard for logs collected by the log collector.

Here’s what it looks like:

log collector dashboard

Logging to AWS CloudWatch

Another way you can log ECS containers is by using CloudWatch and Docker’s built-in log drivers. As described in this post, there are a number of drivers for logging Docker containers, each of which allows one to export the stderr and stdout output for containers to a specific logging tool.

Using the aws-logs driver, you can send these container logs to CloudWatch for storage and analysis in third-party monitoring and logging tools. Note, this option does not allow you to aggregate Docker stats and Docker daemon events in the same pipeline.

To log to CloudWatch, you will need to update the logging section of your ECS task definition (set to “null,” usually).

When you edit the task’s JSON configuration, the logging section will look as follows:

"logConfiguration": {
         "logDriver": "awslogs",
         "options": {
            "awslogs-group": "log-group",
            "awslogs-region": "aws-region",
            "awslogs-stream-prefix": "log-stream-prefix"
         }
      },

Make sure to replace the placeholders above with your CloudWatch configurations:

  • log-group – the name of your CloudWatch log group
  • aws-region – the AWS region for CloudWatch
  • log-stream-prefix – the prefix and name of your CloudWatch log stream

Create and run the task in your ECS cluster. Open the log stream in CloudWatch, and you should start to see your container logs:

cloudwatch log stream

Once in CloudWatch, you can tap into any other monitoring and logging system to analyze the logs. You could, for example, ship the logs to an S3 bucket for storage and extraction into the ELK Stack.

For related information, I recommend reading our blog post on shipping S3 logs into the Logz.io ELK Stack as well.

Logz.io is a predictive, cloud-based log management platform that is built on top of the open-source ELK Stack and can be used for log analysis, application monitoring, business intelligence, and more. Start your free trial today!

Daniel Berman is Product Evangelist at Logz.io. He is passionate about log analytics, big data, cloud, and family and loves running, Liverpool FC, and writing about disruptive tech stuff.

Sysdig and ELK: A Match (Potentially) Made in Heaven

$
0
0

elk stack sysdig

Sysdig is a powerful tool for Linux system and container monitoring. Capturing system activity directly from the kernel, Sysdig allows process tracing and analysis and includes both a CLI and UI for user interaction. As the folks at Sysdig themselves put it: “Think about sysdig as strace + tcpdump + htop + iftop + lsof + …awesome sauce.”

Of course, the challenge is how to extract insights from this rich data once it is captured. We’re talking about thousands of messages logged per minute from the various processes that are running. How does one successfully monitor and analyze all of this information?

Sysdig’s cloud solution includes various visualization and analysis features such as dashboards and alerts, but if you opt for the open source Sysdig, you’re going to need to tap into an external data aggregation and analysis tool.

In comes the ELK Stack (Elasticsearch, Logstash, and Kibana).

This post checks out the integration between Sysdig and ELK and details how to set up a local logging pipeline from Sysdig to Logstash to Elasticsearch and Kibana.

My setup: Ubuntu 14.04, Java SDK 1.7, Elasticsearch 2.4, Logstash 2.4, and Kibana 4.5.

Installing Sysdig

There are a number of ways to install Sysdig — either manually, automatically, or in a Docker container. In this case, I used the following automatic installation script:

$ curl -s https://s3.amazonaws.com/download.draios.com/stable/install-sysdig | sudo bash

To verify Sysdig was installed correctly, simply run it with:

$ sudo sysdig

You should be seeing a live tail of all the messages being traced by Sysdig:

While Sysdig does allow you to trace this output to a file, it is virtually impossible to access these log lines easily for analysis and visualization purposes.

Configuring Logstash

The next step is to configure Logstash to pull the Sysdig output and forward it to Elasticsearch for indexing.

To do this, I’m first going to create a new ‘sysdig-logstash.conf’ file:

$ sudo vim /etc/logstash/sysdig-logstash.conf

Then, I’m going to use the following Logstash configuration:

input {
   stdin { }
}

filter {
      grok {
      pattern =&gt; "^%{NUMBER:num:int} %{NUMBER:time:float} %{INT:cpu:int} %{NOTSPACE:procname} %{NOTSPACE:tid} (?&lt;direction&gt;[&lt;&gt;]) %{WORD:event} %{DATA:args}$"
   }

date {
   match =&gt; [ "time", "UNIX" ]
}

   if [args] {
      kv {
         source =&gt; "args"
         remove_field =&gt; "args"
      }
   }
}

output {
   #stdout { codec =&gt; rubydebug }
   elasticsearch {
      }
}

This configuration defines stdin as the input, applies a grok filter to the data, and sets a locally installed Elasticsearch instance as the output. Of course, if you’re using a remote deployment of Elasticsearch, you’ll want to add a “hosts” configuration line in the output section.

After I save the file, I will then enter the following commands to run Sysdig and Logstash with the configuration file above (before you run this command, verify the path to both the binary and configuration files):

$ cd /opt/logstash

$ sysdig -t a "not(proc.name = sysdig)" | bin/logstash -f /etc/logstash/sysdig-logstash.conf

You should see Logstash output with the following message:

Settings: Default pipeline workers: 1
Logstash startup completed

Analyzing and visualizing the data

Our next step is to begin analyzing the data in Kibana, ELK’s user interface.

In a vanilla installation, and if this is the first time you are defining a logstash index, the Settings tab will be displayed, in which the logstash-* index should already be identified by Kibana:

configure kibana index pattern

After creating the new index, and opening the Discover tab in Kibana — you should be seeing all the data traced by Sysdig and outputted to stdin:

sysdig outputs to stdin

To start to understand the potential of using Sysdig with ELK, let’s begin by adding some fields to the log display. I’m going to select the “procname” and “event” fields from the list of available fields on the left:

select event fields in log display

We can now see the different processes being traced and which event they triggered. I recommend reading up on how to interpret Sysdig data before you begin analysis.

Next up — visualizing the data. This is where the fun starts. Kibana is renowned for its visualization features, but the truth is that it’s not always easy to fine-tune the visualizations to reflect exactly what we want to see in them (here’s a useful guide on how to create visualizations in Kibana).

Number of messages

Let’s start with something simple. I’m going to create a simple metric visualization, showing the number of messages being traced by Sysdig in my machine.

To do this, I’m going to select the Visualize tab, select the Metric visualization type, use a new search, and then select Count as the aggregation type:

count visualization type

Top processes

Another easy example is a pie chart that depicts the top processes that are taking place in one’s system. To create this visualization, select the pie chart visualization type and use the following configuration using the ‘procname.raw’ field:

top processes visualization

Not surprisingly, with both Elasticsearch and Logstash running on the same system, Java is ranking first at the top of the list.

And so on. Once you have a series of these visualizations, collect them into one comprehensive dashboard for real-time system monitoring.

Reservations

Before I sign off, here are a few reasons why the title of this post contains the word “potentially.”

Logstash parsing errors

After logging Sysdig output into ELK for a while, I noticed this parsing error being reported:

"error"=&gt;{"type"=&gt;"mapper_parsing_exception", "reason"=&gt;"Field name [.....Y....5.k.../.......e,..D...............] cannot contain '.'"}

This is because some of the fields outputted by Sysdig contain a dot ‘.’ A way around this is to install the Logstash de_dot plugin, a process not described here.

Logstash performance

The amount of data being shipped by Sysdig is quite large, and Logstash is prone to caving under heavy loads. In a sandbox type of environment, you can afford to ignore this. But if you scale the setup upwards a bit, you’re going to need some kind of buffering system.

Analyzed fields

Elasticsearch mapping configurations are recommended to enhance the analysis of Sysdig data in Kibana. Out of the box, many Sysdig fields such as “procname” are reported as analyzed, meaning that they contain analyzed strings. These, in turn, consume a lot of memory and also do not visualize as expected (please note that in the pie chart visualization above, I used the ‘prodname_raw‘ field instead of ‘procname‘).

Summary

Despite these reservations, there’s no doubt that with a bit of fine-tuning and the application of extra configurations, the combination between Sysdig and ELK offers great potential for a powerful solution that monitors systems and containers. With the soaring popularity of ELK and the growing need for effective system and container monitoring, I’m sure a tighter integration between the two is forthcoming.

Anyone picking up the gauntlet?

Logz.io is a predictive, cloud-based log management platform that is built on top of the open-source ELK Stack and can be used for log analysis, application monitoring, business intelligence, and more. Start your free trial today!

Daniel Berman is Product Evangelist at Logz.io. He is passionate about log analytics, big data, cloud, and family and loves running, Liverpool FC, and writing about disruptive tech stuff.

How to Power Your IT Operations With Artificial Intelligence

$
0
0

webinar

Last week we hosted a webinar explaining how our new artificial intelligence technology — Cognitive Insights™ — revolutionizes the way that DevOps and IT Operations teams perform log analysis.

Here’s a short recap of the topics discussed and a link to relevant resources in case you missed it.

The Challenge of Log Analysis

In the webinar, we reviewed the various challenges facing DevOps and IT operations teams when they attempt to analyze logs in a modern environment:
Challenges in log analysis

To sum it up, log analysis today remains a highly complicated and resource-consuming task for even the most skilled team despite that advanced monitoring and logging platforms that are available today.

As explained in the webinar, this is due to the fact that at the end of the day, behind these tools sits a human being who needs to somehow collect the data from the various data sources, connect the dots, and ultimately extract actionable insights to be able to make informed and timely decisions.

Facing an ever-growing amount and diversity of log data, companies are struggling with this “Big Data” challenge.

Why Current Methodologies Are Not Enough

So, how do companies attempt to overcome this “finding a needle in a haystack” challenge?

Most solutions today use anomaly detection via mathematical analysis of the raw data. The problem with this method is that it is highly susceptible to false alerts and a high signal-to-noise ratio. In the webinar, we went through the three main reasons — and showed examples that explain why — that anomaly detection cannot work effectively in modern log analysis:

  • First, not every anomaly is an error. Seasonal peaks are a good example of this — take weekends or Christmas Eve. Any monitoring tool would alert you of an anomaly taking place as traffic picks up, but does this mean your app is failing? Not necessarily.
  • Second, not every error represents itself in an anomaly. Some errors are extremely gradual and occur over time. For example, take resource consumption and memory usage. Chances are, you’ll know that something had been happening only after your server crashes.
  • And third, anomaly detection, as it is performed today, cannot accurately predict or identify errors in applications that are constructed on step functions and exception paths. Because of how most of our code is written today, it’s impossible for a mathematical formula to understand how it’s supposed to execute and when an event is really taking place.

Of course, anomaly detection can work great for very specific metrics — such as monitoring server response time when analyzing user behavior — but it is not a viable solution for monitoring modern applications and IT infrastructure.

What is Cognitive Insights™ and How It Works

In the webinar, we described Cognitive Insights™ as a new AI platform that combines machine learning and human interaction with data. It transforms manual DevOps and IT operations log analysis tasks into an automated scientific processes that uncover otherwise overlooked events and enriches them with actionable data about context, severity, relevance, and next steps.

So, how does it work?

Since we understand that most of the log data is meaningless and that no human or machine can collect and analyze the log data on their or its own, we’ve unified both human and machine into one, patent-pending technology called UMI™ (Unified Machine Intelligence) which is at the core of Cognitive Insights™:

Cognitive Insights - how it works

UMI™ identifies human interactions with log data including discussions on StackOverFlow or Serverfault, Google searches for relevant information, and issues that are posted on GitHub; correlates these interactions with our log data; and then displays these as events or insights, in the Logz.io UI.

In other words, Cognitive Insights™ focuses on human interactions with the data instead of just the data itself. Imagine troubleshooting issues in production together with hundreds and thousands of other engineers in the room. That’s precisely what this feature is all about — helping you to harness the rich and ever-growing amount of knowledge that is available on the Web to discover and resolve issues quickly and easily.

More Information

To help understand Cognitive Insights™, the webinar includes a brief demonstration of the technology, the recording of which is available below, together with additional resources:

Logz.io is a predictive, cloud-based log management platform that is built on top of the open-source ELK Stack and can be used for log analysis, application monitoring, business intelligence, and more. Start your free trial today!

Daniel Berman is Product Evangelist at Logz.io. He is passionate about log analytics, big data, cloud, and family and loves running, Liverpool FC, and writing about disruptive tech stuff.

AWS re:Invent 2016: 10 Sessions You Must Not Miss

$
0
0

aws reinvent 2016 sessions

Autumn in Las Vegas means one thing — it’s time for AWS re:Invent. One of the largest global technological events in the world and the most important event in the world of cloud computing, re:Invent this year promises to be even bigger than in previous years.

The size of this event can be overwhelming, both physically (be sure to drink a lot of water!) and content-wise. With around 20,000 attendees, eight tracks, and 192 breakout sessions, it’s not easy, to say the least, to find one’s bearings. In addition to the keynotes, product announcements, and sponsor events, there are some excellent breakout sessions for learning about the latest developments in the industry.

But how to choose where to be? Below, I’ve listed the top ten sessions — in no particular order — that we think are worth a ticket to re:Invent in their own right, together with some useful background and practical information to guide you.

Because of the variety on offer, it was extremely difficult to build this list. Being a big data and log analysis company, Logz.io has a natural inclination towards architectural and Big Data sessions, but we also added some “must see” sessions from other fields.

Enjoy!

#1 – From Resilience to Ubiquity – #NetflixEverywhere Global Architecture (ARC204)

Speaker: Coburn Watson, Director of Performance and Reliability, Netflix
Track: Architecture
Level: Introductory
When: Tuesday, Nov 29, 9:30 AM – 10:30 AM

Why we like this session: Netflix has extensive experience in building a fault-resilient and available global service, and the company has not been shy about sharing its engineering goodness with the community. Learning from the Netflix’s war stories and architectural journey promises to be highly illuminating!

Abstract: “Building and evolving a pervasive, global service requires a multi-disciplined approach that balances requirements with service availability, latency, data replication, compute capacity, and efficiency. In this session, we’ll follow the Netflix journey of failure, innovation, and ubiquity. We’ll review the many facets of globalization and then delve deep into the architectural patterns that enable seamless, multi-region traffic management; reliable, fast data propagation; and efficient service infrastructure. The patterns presented will be broadly applicable to internet services with global aspirations.”

#2 – Amazon CloudWatch Logs and AWS Lambda: A Match Made in Heaven (DEV301)

Speaker: Bob Wilkinson, General Manager, AWS CloudWatch
Track: DevOps & Tools
Level: Advanced
When: Thursday, Dec 1, 11:00 AM – 12:00 PM

Why we like this session: The combination between AWS Lambda and CloudWatch in the scenarios included in the session are what peaked our interest. Providing an ELK (Elasticsearch, Logstash and Kibana) solution ourselves, we’re also extremely intrigued to hear about building Elasticsearch clusters on AWS, and using CloudWatch together with Lambda and S3.

Abstract: “In this session, we cover three common scenarios that include Amazon CloudWatch Logs and AWS Lambda. First, you learn how to build an Elasticsearch cluster from historical data using Amazon S3, Lambda, and CloudWatch Logs. Next, you learn how to add details to CloudWatch alarm notifications using Amazon SNS and Lambda. Finally, we show you how to bring Elastic Load Balancing logs to CloudWatch Logs using S3 bucket triggers from Lambda.”

#3- Introduction to Container Management on AWS (CON303)

Speaker: Brandon Chavis, Solutions Architect, AWS
Track: Containers Mini Con
Level: Advanced
When: Thursday, Dec 1, 2:00 PM – 3:00 PM

Why we like this session: It’s the rise of the Container Era! Containers are one of the hottest topics in the world of DevOps. We’re looking forward to hearing about the analysis and comparison between AWS ECS, Docker, Kubernetes, and Mesos.

Abstract: “Managing and scaling hundreds of containers is a challenging task. A container management solution takes care of these challenges for you, allowing you to focus on developing your application. In this session, we cover the role and tasks of a container management solution and we analyze how four common container management solutions — Amazon EC2 Container Service, Docker for AWS, Kubernetes, and Apache Mesos — stack against each other. We also see how you can easily get started with each of these solutions on AWS.”

#4 – Metering Big Data at AWS: From 0 to 100 Million Records in 1 Second (ARC308)

Speaker: Diego Macadar, Software Development Manager, AWS
Track: Architecture
Level: Advanced
When: Wednesday, Nov 30, 2:00 PM – 3:00 PM

Why we like this session: The numbers to be presented in this session are what attracted our attention. Learning how AWS maintains its huge processing pipeline while dealing with scaling and accuracy promises to be extremely educational.

Abstract: “Learn how AWS processes millions of records per second to support accurate metering across AWS and our customers. This session shows how we migrated from traditional frameworks to AWS managed services to support a large processing pipeline. You will gain insights on how we used AWS services to build a reliable, scalable, and fast processing system using Amazon Kinesis, Amazon S3, and Amazon EMR. Along the way we dive deep into use cases that deal with scaling and accuracy constraints. Attend this session to see AWS’s end-to-end solution that supports metering at AWS.”

#5- Securing Container-Based Applications (CON402)

Speakers:
Michael Capicotto, Solutions Architect, AWS
Henrik Johansson, Security Solutions Architect, AWS
Track: Containers Mini Con
Level: Expert
When: Thursday, Dec 1, 12:30 PM – 1:30 PM

Why we like this session: Security and Docker — two words that are not uttered lightly. There is plenty of debate in the community on whether Docker is ready for the enterprise world, and security is often used as the reason why it is not. It’ll be interesting to hear how AWS helps with the security concerns.

Abstract: “Containers have had an incredibly large adoption rate since Docker was launched, especially from the developer community, as it provides an easy way to package, ship, and run applications. Securing your container-based application is now becoming a critical issue as applications move from development into production. In this session, you learn ways to implement storing secrets, distributing AWS privileges using IAM roles, protecting your container-based applications with vulnerability scans of container images, and incorporating automated checks into your continuous delivery workflow.”

#6 – Evolving a Responsive and Resilient Architecture to Analyze Billions of Metrics (ARC311)

Speakers:
Jim Tran, Enterprise SA, AWS
Thomas Lockney, Engineering Manager, Nike
Owyn Richen, Sr. Director Platform Delivery, Nike
Track: Architecture
Level: Advanced
When: Thursday, Dec 1, 5:30 PM – 6:30 PM

Why we like this session: Nike and Big Data, need I say more? Even if you are more of an Adidas type of guy or gal, this session promises plenty of valuable tips on building a stable, flexible, and robust architecture that can successfully handle billions of metrics a day.

Abstract: “Nike+ is at the core of the Nike digital product ecosystem, providing services to enhance your athletic experience through quantified activity tracking and gamification. As one of the first movers at Nike to migrate out of the datacenter to AWS, they share the evolution in building a reactive platform on AWS to handle large, complex data sets. They provide a deep technical view of how they process billions of metrics a day in their quantified-self platform, supporting millions of customers worldwide. You’ll leave with ideas and tools to help your organization scale in the cloud. Come learn from experts who have built an elastic platform using Java, Scala, and Akka, leveraging the power of many AWS technologies like Amazon EC2, ElastiCache, Amazon SQS, Amazon SNS, DynamoDB, Amazon ES, Lambda, Amazon S3, and a few others that helped them (and can help you) get there quickly.”

#7 – Architecting Next Generation SaaS Applications on AWS (ARC301)

Speaker: Tod Golding, Partner Solutions Architect, AWS
Track: Architecture
Level: Advanced
When: Wednesday, Nov 30, 11:30 AM – 12:30 PM

Why we like this session (and the next one as well): As a company that has built its SaaS product on AWS, we highly recommend this session for companies either currently in the process of planning their SaaS platform or those working on existing SaaS applications deployed on AWS.

We will definitely be there!

Abstract: “AWS provides a broad array of services, tools, and constructs that can be used to design, operate, and deliver SaaS applications. In this session, Tod Golding, the AWS Partner Solutions Architect, shares the wisdom and lessons learned from working with dozens of customers and partners building SaaS solutions on AWS. We discuss key architectural strategies and patterns that are used to deliver multi-tenant SaaS models on AWS and dive into the full spectrum of SaaS design and architecture considerations, including tenant isolation models, tenant identity management, serverless SaaS, and multi-tenant storage strategies. This session connects the dots between general SaaS best practices and what it means to realize these patterns on AWS, weighing the architectural tradeoffs of each model and assessing its influence on the agility, manageability, and cost profile of your SaaS solution.”

#8 – Optimizing SaaS Solutions on AWS (ARC408)

Speaker: Tod Golding, Partner Solutions Architect, AWS
Track: Architecture
Level: Expert
When: Thursday, Dec 1, 2:00 PM – 3:00 PM

Why we like this session: The same as above, but this is bit more advanced, with more detailed and technical information on dealing with performance optimization strategies.

Abstract: “OK, so you have your SaaS application up and running on AWS and now the real fun begins. The adoption of SaaS and a shared multi-tenant infrastructure brings with it a unique set of challenges that require developers to find new and creative ways to optimize their SaaS applications. For many engineers, this means tackling a whole new realm of questions. How do you optimize tenant experience by tiers? How do you perform real-time performance tuning or centralized tenant policy management? How do you collect and aggregate tenant analytics? How do you implement scalable policy-driven configuration of tenant experience? These and many other challenging topics will be covered in this technical deep dive. Tod Golding, an AWS Solutions Architect specializing in helping AWS partners build SaaS systems, will explore a collection of strategies that can be leveraged to increase the performance, flexibility, and agility of SaaS environments. You will learn how to identify areas where services, tools, and design strategies can be combined to enrich the agility of your SaaS architecture.”

#9 – Serverless Architectural Patterns and Best Practices (ARC402)

Speakers:
Drew Dennis, Solutions Architect, AWS
Maitreya Ranganath, Solutions Architect, AWS
Ajoy Kumar, Architect, BMC Software
Track: Architecture
Level: Expert
When: Wednesday, Nov 30, 5:00 PM – 6:00 PM

Why we like this session: “Serverless” is all the rage these days, with more and more services and methodologies emerging on a daily basis. To help to understand why “serverless” is becoming so popular, we would like to hear about the different frameworks and patterns used.

Abstract: “As serverless architectures become more popular, AWS customers need a framework of patterns to help them deploy their workloads without managing servers or operating systems. This session introduces and describes four re-usable serverless patterns for web apps, stream processing, batch processing, and automation. For each, we provide a TCO analysis and comparison with its server-based counterpart. We also discuss the considerations and nuances associated with each pattern and have customers share similar experiences. The target audience is architects, system operators, and anyone looking for a better understanding of how serverless architectures can help them save money and improve their agility.”

#10 – Cloud Monitoring – Understanding, Preparing, and Troubleshooting Dynamic Apps on AWS (ARC303)

Speaker: Lee Atchison, Principal Cloud Architect, New Relic
Track: Architecture
Level: Advanced
When: Wednesday, Nov 30, 2:00 PM – 3:00 PM

Why we like this session: Cloud monitoring has become a huge challenge with the advent of more and more dynamic services. New Relic offer an interesting solution for resource utilization monitoring, and as a company offering tools for cloud monitoring ourselves, we’d love to hear about New Relic’s experience in this field.

Abstract: “Applications running in a typical data center are static entities. Dynamic scaling and resource allocation are the norm in AWS. Technologies such as Amazon EC2, Docker, AWS Lambda, and Auto Scaling make tracking resources and resource utilization a challenge. The days of static server monitoring are over.

In this session, we examine trends we’ve observed across thousands of customers using dynamic resource allocation and discuss why dynamic infrastructure fundamentally changes your monitoring strategy. We discuss some of the best practices we’ve learned by working with New Relic customers to build, manage, and troubleshoot applications and dynamic cloud services.”

Some Final Tips

Some sessions are expected to be completely full. You can reserve a seat, so be sure to visit the conference site and reserve your seat as early as possible.

You do not want to miss any activity with the GA prefix — these include the welcome reception, keynote, pub crawls, and other special events.

If you find the time, you might also want to make yourself available for some of the partner theater sessions (PTS). These are short and light engagements in which selected AWS partners show off their wares.

Be sure to rest up between sessions. re:Invent can be a tiring event, so we recommend taking breaks and consuming plenty of liquid (and not the alcoholic kind).


Meet Logz.io at AWS re:Invent

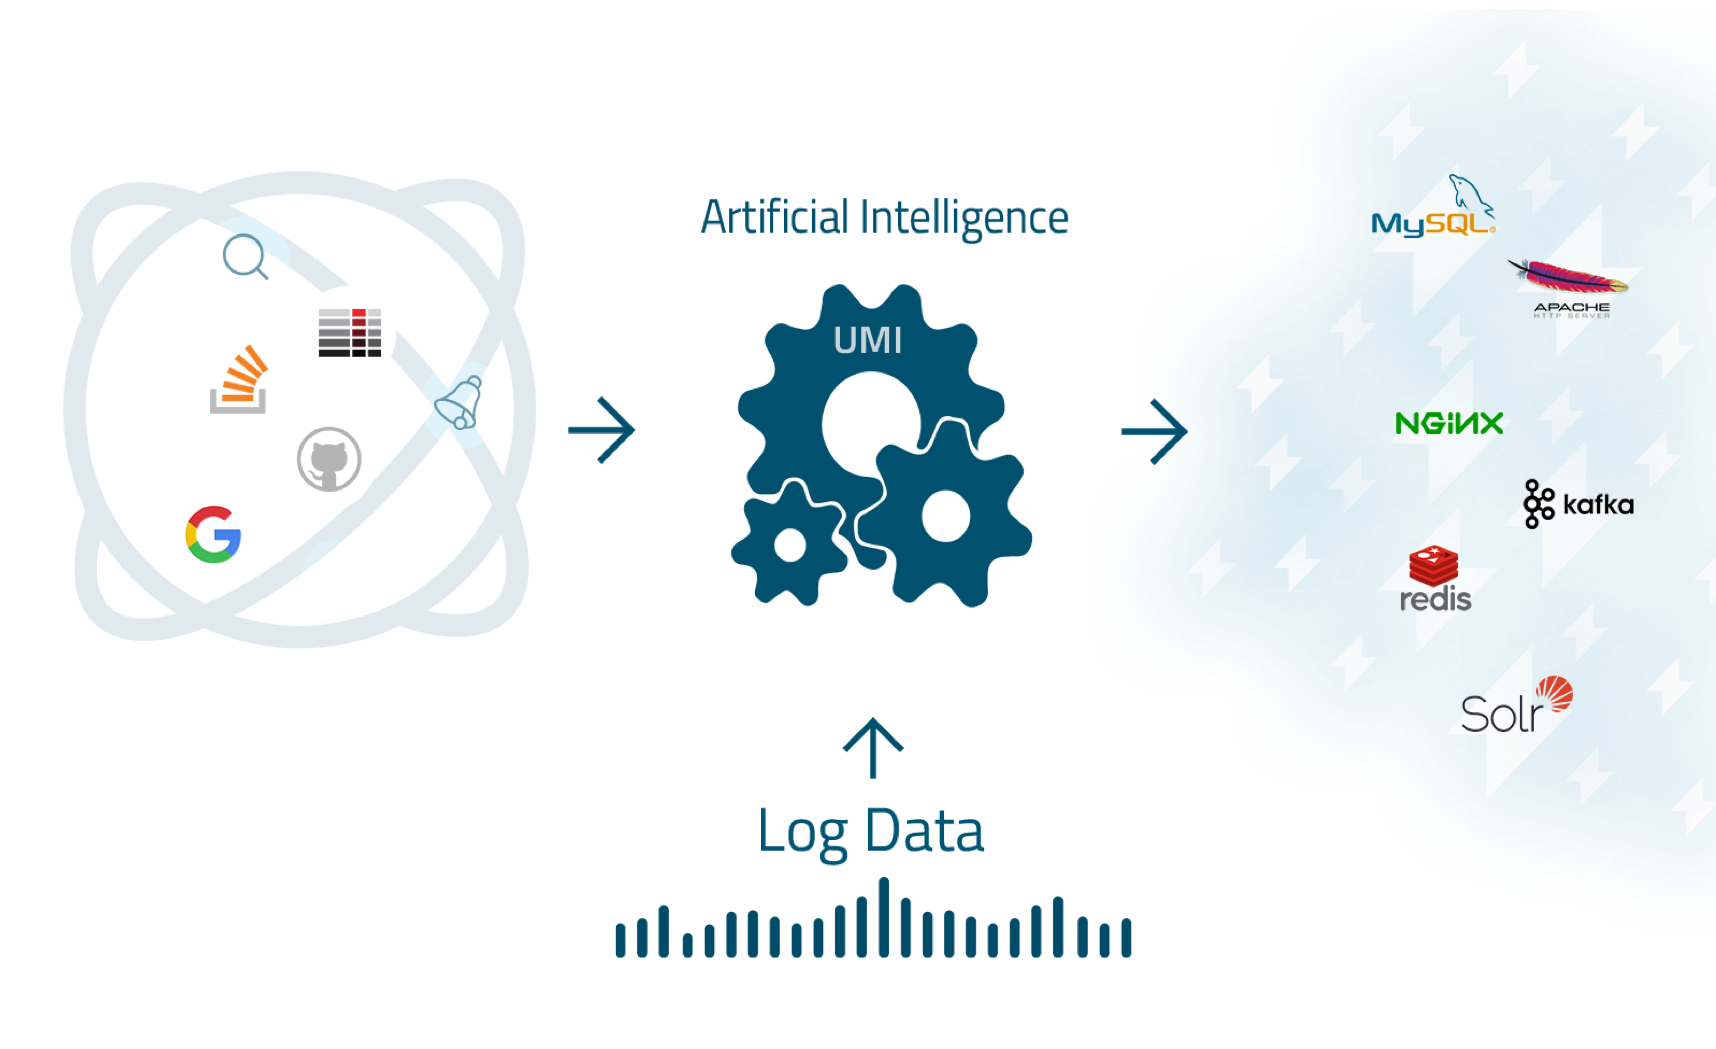
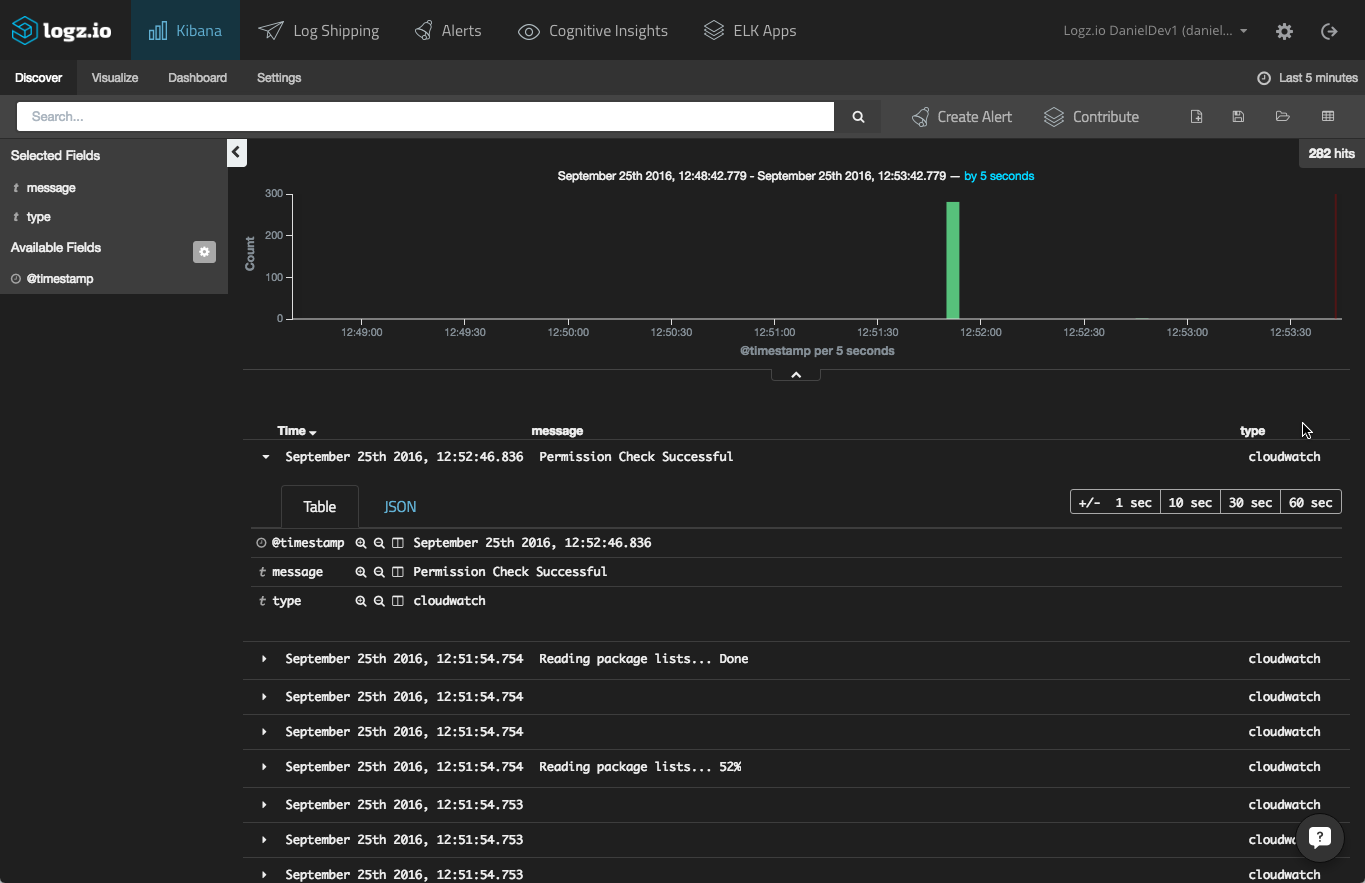
Logz.io is a Silver sponsor of re:Invent, and we will be on the floor at Booth #1019. So, in between sessions, be sure to pay us a visit and learn all about our log analysis platform that offers the open source ELK Stack as a cloud service powered by artificial intelligence. You can reserve a demo slot by clicking here OR here if you’re interested.

Daniel Berman is Product Evangelist at Logz.io. He is passionate about log analytics, big data, cloud, and family and loves running, Liverpool FC, and writing about disruptive tech stuff.

Elasticsearch Mapping: The Basics, Two Types, and a Few Examples

$
0
0

Within a search engine, mapping defines how a document is indexed and how its fields are indexed and stored. We can compare mapping to a database schema in how it describes the fields and properties that documents hold, the datatype of each field (e.g., string, integer, or date), and how those fields should be indexed and stored by Lucene. It is very important to define the mapping after we create an index — an inappropriate preliminary definition and mapping may result in the wrong search results.

In a previous article, we ran an elaborate comparison of the two search engine market leaders, Elasticsearch and Apache Solr. Here, we will delve deep into the Elasticsearch mappings using a stable Elasticsearch v2.4 configuration. We will discuss the basics, the different field types, and then give examples for both static and dynamic mapping.

About Mapping

Mapping is intended to to define the structure and field types as required based on the answers to certain questions. For example:

  • Which string fields should be full text and which should be numbers or dates (and in which formats)?
  • When should you use the _all field, which concatenates multiple fields to a single string and helps with analyzing and indexing?
  • What custom rules should be set to update new field types automatically as they are added (e.g., the dynamic mapping type, which we will discuss further later on)?

Each index has one or more mapping types that are used to divide documents into logical groups. Basically, a type in Elasticsearch represents a class of similar documents and it has a name such as “customer” or “item.” Lucene has no concept of document data types, so the type name of each document is stored in a metadata field of a document called _type. When we search for documents within a particular type, Elasticsearch simply uses a filter on the _type field to restrict the search.

In addition, mappings is the layer that Elasticsearch uses to map complex JSON documents into the simple flat documents that Lucene expects to receive. Each mapping type has fields or properties defined by meta-fields and various data types.

Data-Type Fields

When we create mapping, each mapping type will be a combination of multiple fields or lists with various types. For example, a “user” type may contain fields for title, first name, last name, and gender whereas an “address” type might contain fields for city, state, and zip code.

Elasticsearch supports a number of different data types for the fields in a document:

Core data types: String, Date, Numeric (long, integer, short, byte, double, and float), Boolean, Binary

Complex data types:
Array: Array support does not require a dedicated type
Object: Object for single JSON objects
Nested: Nested for arrays of JSON objects

Geo data types:
Geo-point: Geo_point for latitude/longitude points
Geo-Shape: Geo_shape for complex shapes such as polygons

Specialized data types:
IPv4: ip for IPv4 addresses
Completion: completion to provide autocomplete suggestions
Token count: token_count to count the number of tokens in a string
Attachment: Mapper-attachments plugin which supports indexing attachments in formats such as Microsoft Office, Open Document, ePub, and HTML, into an attachment datatype

Note: In versions 2.0 to 2.3, dots are not permitted in field names. Elasticsearch 2.4.0 adds a system property called mapper.allow_dots_in_name that disables the check for dots in field names.

Meta Fields

Meta fields are used to customize how a document’s associated metadata is treated. Each document has associated metadata such as the _index, mapping _type, and _id meta-fields. The behavior of some of these meta-fields can be customized when a mapping type is created.

Identity meta-fields

_index: The index to which the document belongs.
_uid: A composite field consisting of the _type and the _id.
_type: The document’s mapping type.
_id: The document’s ID.

Document source meta-fields

_source: The original JSON representing the body of the document.
_size:The size of the _source field in bytes, provided by the mapper-size plugin.

Indexing meta-fields

_all: A catch-all field that indexes the values of all other fields.
_field_names: All fields in the document that contain non-null values.
_timestamp: A timestamp associated with the document, either specified manually or auto-generated.
_ttl: How long a document should live before it is automatically deleted.

Routing meta-fields

_parent: Used to create a parent-child relationship between two mapping types.
_routing: A custom routing value that routes a document to a particular shard.

Other meta-field

_meta: Application specific metadata.

An Example

To create a mapping, you will need the Put Mapping API that will help you to set a specific mapping definition for a specific type, or you can add multiple mappings when you create an index.

An example of mapping creation using the Mapping API:

PUT 'Server_URL/Index_Name/_mapping/Mapping_Name'
{
            "type_1" : {
                        "properties" : {
                                    "field1" : {"type" : "string"}
                        }
            }
}

In the above code:

  • Index_Name: Provides the index name to be created
  • Mapping_Name: Provides the mapping name
  • type_1 : Defines the mapping type
  • Properties: Defines the various properties and document fields
  • {“type”}: Defines the data type of the property or field

Below is an example of mapping creation using an index API:

PUT /index_name

{
  "mappings":{
            "type_1":{
                        "_all" : {"enabled" : true},
                        "properties":{
                                    "field_1":{ "type":"string"},
                                    "field_2":{ "type":"long"}
                        }
            },
            "type_2":{
                        "properties":{
                                    "field_3":{ "type":"string"},
                                    "field_4":{ "type":"date"}
                        }
            }
  }
}

In the above code:

  • Index_Name: The name of the index to be created
  • type_1: Defines the mapping type
  • _all: The configuration metafield parameter. If “true,” it will concatenate all strings and search values
  • Properties: Defines the various properties and document fields
  • {“type”}: Defines the data type of the property or field

Two Mapping Types

Elasticsearch supports two types of mappings: “Static Mapping” and “Dynamic Mapping.” We use Static Mapping to define the index and data types. However, we still need ongoing flexibility so that documents can store extra attributes. To handle such cases, Elasticsearch comes with the dynamic mapping option that was mentioned at the beginning of this article.

Static Mapping

In a normal scenario, we know well in advance which kind of data will be stored in the document, so we can easily define the fields and their types when creating the index. Below is an example in which we are going to index employee data into an index named “company” under the type “employeeInfo.”

Sample document data:

{
"name" : {"first" :"Alice","last":"John"},
"age" : 26,
"joiningDate" : "2015-10-15"
}

Example :

PUT /company

{
  "mappings":{
            "employeeinfo":{
                        "_all" : {"enabled" : true},
                        "properties":{
                                    "name":{
                                                "type":"object",
                                                "properties":{
                                                            "field_1":{
                                                                       "type":"string"
                                                           },
                                                           "field_2":{
                                                                      "type":"string"
                                                           }
                                               }
                                    },
                                    "age":{
                                                "type":"long"
                                    },
                                    "joiningDate":{
                                                "type":"date"
                                    }
                        }
            }
 }
}

In the above API:

  • employeeinfo: Defines the mapping type name
  • _all: The configuration metafield parameter. If “true,” it will concatenate all strings and search values
  • Properties: Defines various properties and document fields
  • {“type”}: Defines the data type of the property or field

Dynamic Mapping

Thanks to dynamic mapping, when you just index the document, you do not always need to configure the field names and types. Instead, these will be added automatically by Elasticsearch using any predefined custom rules have been defined. New fields can be added both to the top-level mapping type and to inner objects and nested fields. In addition, dynamic mapping rules can be configured to customize the existing mapping.

Custom rules help to identify the right data types for unknown fields, such as mapping true/false in JSON to boolean, while integer in JSON maps to long in Elasticsearch. Rules can be configured using dynamic field mapping or a dynamic template. When Elasticsearch encounters an unknown field in a document, it uses dynamic mapping to determine the data type of the field and automatically adds the new field to the type mapping.

However, there will be cases when this will not be your preferred option. Perhaps you do not know what fields will be added to your documents later, but you do want them to be indexed automatically. Perhaps you just want to ignore them. Or, especially if you are using Elasticsearch as a primary data store, maybe you want unknown fields to have an exception to alert you of the problem. Fortunately, you can control this behavior with the dynamic setting, which accepts the following options:

  • true: Add new fields dynamically — this is the default
  • false: Ignore new fields
  • strict: Throw an exception if an unknown field is encountered

Example:

PUT /index_name

{
            "mappings": {
            "my_type": {
            "dynamic": "strict",
                        "properties": {
                               "title":  { "type":"string"},
                               "stash":  {
                                     "type": "object",
                                     "dynamic":  true
                                     }
                        }
            }
            }
}

In the above API:

  • index_name – creates an index with this name
  • my_type – defines the mapping type name
  • “dynamic”: “strict” – the “my_type” object will throw an exception if an unknown field is encountered
  • “dynamic”:  true – the “stash” object will create new fields dynamically
  • _all – the configuration metafield parameter. If “true,” it will concatenate all strings and search values
  • properties – defines the various properties and document fields
  • {“type”} – defines the data type of the property or field

With dynamic mapping, you can add new searchable fields into the stash object:

Example:

PUT /my_index/my_type/1

{
   "title": "This doc adds a new field",
   "stash": { "new_field": "Success!" }
}

But trying to do the same at the top level will fail:

PUT /my_index/my_type/1

{
   "title": "This throws a StrictDynamicMappingException",
   "new_field": "Fail!"
}

What’s New in Elasticsearch 5.0 for Mapping?

Elasticsearch 2.X had a “string” data type for full-text search and keyword identifiers. Full-text search is basically used to discover relevant text in documents, while keyword identifiers are used for sorting, aggregating, and filtering the documents. In Elasticsearch 2.x, we cannot explicitly tell the Elasticsearch engine which fields are used for full-text search and which are used for sorting, aggregating, and filtering the documents.

Elasticsearch 5.X — see our full post on the full ELK Stack 5.0 as well as our Complete Guide to the ELK Stack — comes with two new data types called “text” and “keyword,” replacing the “string” data type in the earlier version.

  • “Text”: Full-text and relevancy search in documents
  • “Keyword”: Exact-value search for sorting, aggregation and filtering documents

Text fields support the full analysis chain while keyword fields will support only a limited analysis — just enough to normalize values with lower casing and similar transformations. Keyword fields support document values for memory-friendly sorting and aggregations while text fields have field data disabled by default to prevent the loading of massive amounts of data into the memory by mistake.

Note: The “string” field type continue to work during the 5.x series, but it will likely be removed in 6.0.

When to Use “Text” or “Keyword” Data Type

Ending this article with a practical tip, here is a rule of thumb for mapping in Elasticsearch:

  • “Text” data types — Use when you require full-text search for particular fields such as the bodies of e-mails or product descriptions
  • “Keyword” data types — Use when you require an exact-value search, particularly when filtering (“Find me all products where status is available”), sorting, or using aggregations. Keyword fields are only searchable by their exact value. Use keyword data types when you have fields like email addresses, hostnames, status codes, zip codes, or tags.

Summary

Mapping in Elasticsearch can seem daunting at times, especially if you’re just starting out with ELK. At Logz.io, this is part of the service we provide our users. But if you’re using your own Elasticsearch deployment, pay careful attention to the details. We hope this article will help you to understand the basics.

Logz.io is a predictive, cloud-based log management platform that is built on top of the open-source ELK Stack and can be used for log analysis, application monitoring, business intelligence, and more. Start your free trial today!

Daniel Berman is Product Evangelist at Logz.io. He is passionate about log analytics, big data, cloud, and family and loves running, Liverpool FC, and writing about disruptive tech stuff.

Logging Docker Containers with AWS CloudWatch

$
0
0

docker logging aws cloudwatch

One of the ways to log Docker containers is to use the logging drivers added by Docker last year. These drivers log the stdout and stderr output of a Docker container to a destination of your choice — depending on which driver you are using — and enable you to build a centralized log management system (the default behavior is to use the json-file driver, saving container logs to a JSON file).

The awslogs driver allows you to log your containers to AWS CloudWatch, which is useful if you are already using other AWS services and would like to store and access the log data on the cloud. Once in CloudWatch, you can hook up the logs with an external logging system for future monitoring and analysis.

This post describes how to set up the integration between Docker and AWS and then establish a pipeline of logs from CloudWatch into the ELK Stack (Elasticsearch, Logstash, and Kibana) offered by Logz.io.

Setting Up AWS

Before you even touch Docker, you need to make sure that we have AWS configured correctly. This means that we need a user with an attached policy that allows for the writing of events to CloudWatch, and we need to create a new logging group and stream in CloudWatch.

Creating an AWS User

First, create a new user in the IAM console (or select an existing one). Make note of the user’s security credentials (access key ID and access key secret) — they are needed to configure the Docker daemon in the next step. If this is a new user, simply add a new access key.

Second, you will need to define a new policy and attach it to the user that you have just created. So in the same IAM console, select Policies from the menu on the left, and create the next policy which enables writing logs to CloudWatch:

{
 "Version": "2012-10-17",
 "Statement": [
    {
       "Action": [
          "logs:CreateLogStream",
          "logs:PutLogEvents"
       ],
       "Effect": "Allow",
       "Resource": "*"
    }
 ]
}

Save the policy, and assign it to the user.

Preparing CloudWatch

Open the CloudWatch console, select Logs from the menu on the left, and then open the Actions menu to create a new log group:

create new log group in aws cloudwatch

Within this new log group, create a new log stream. Make note of both the log group and log stream names — you will use them when running the container.

Configuring Docker

The next step is to configure the Docker daemon (and not the Docker engine) to use your AWS user credentials.

As specified in the Docker documentation, there are a number of ways to do this such as shared credentials in ~/.aws/credentials and using EC2 instance policies (if Docker is running on an AWS EC2 instance). But this example will opt for a third option — using an upstart job.

Create a new override file for the Docker service in the /etc/init folder:

$ sudo vim /etc/init/docker.override

Define your AWS user credentials as environment variables:

env AWS_ACCESS_KEY_ID=<aws_access_key_id>
env AWS_SECRET_ACCESS_KEY=<aws_secret_access_key>

Save the file, and restart the Docker daemon:

$ sudo docker service restart

Note that in this case Docker is installed on an Ubuntu 14.04 machine. If you are using a later version of Ubuntu, you will need to use systemd.

Using the awslogs Driver

Now that Docker has the correct permissions to write to CloudWatch, it’s time to test the first leg of the logging pipeline.

Use the run command with the –awslogs driver parameters:

$ docker run -it --log-driver="awslogs" --log-opt awslogs-region="us-east-1" --log-opt awslogs-group="log-group" --log-opt awslogs-stream="log-stream" ubuntu:14.04 bash

If you’d rather use docker-compose, create a new docker-compose.yml file with this logging configuration:

version: "2"
services:
   web:
      image: ubuntu:14.04
         logging:
            driver: "awslogs"
            options:
               awslogs-region: "us-east-1"
               awslogs-group: "log-group"
               awslogs-stream: "log-stream"

Open up the log stream in CloudWatch. You should see container logs:

cloudwatch log stream

Shipping to ELK for Analysis

So, you’ve got your container logs in CloudWatch. What now? If you need monitoring and analysis, the next obvious step would be to ship the data into a centralized logging system.

The next section will describe how to set up a pipeline of logs into the Logz.io AI-powered ELK Stack using S3 batch export. Two requirements by AWS need to be noted here:

  • The Amazon S3 bucket must reside in the same region as the log data that you want to export
  • You have to make sure that your AWS user has permissions to access the S3 bucket

Exporting to S3

CloudWatch supports batch export to S3, which in this context means that you can export batches of archived Docker logs to an S3 bucket for further ingestion and analysis in other systems.

To export the Docker logs to S3, open the Logs page in CloudWatch. Then, select the log group you wish to export, click the Actions menu, and select Export data to Amazon S3:

export cloudwatch data to aws s3

In the dialog that is displayed, configure the export by selecting a time frame and an S3 bucket to which to export. Click Export data when you’re done, and the logs will be exported to S3.

Importing Into Logz.io

Setting up the integration with Logz.io is easy. In the user interface, go to Log Shipping → AWS → S3 Bucket.

Click “Add S3 Bucket,” and configure the settings for the S3 bucket containing the Docker logs with the name of the bucket, the prefix path to the bucket (excluding the name of the bucket), the AWS access key details (ID + secret), the AWS region, and the type of logs:

add s3 bucket

Hit the “Save” button, and your S3 bucket is configured. Head on over to the Visualize tab in the user interface. After a moment or two, the container logs should be displayed:

display container logs in kibana

Using Logstash

If you are using your own ELK Stack, you can configure Logstash to import and parse the S3 logs using the S3 input plugin.

An example configuration would look something like this:

input {
   s3 {
      bucket => "dockertest"
      credentials => [ "my-aws-key", "my-aws-token" ]
      region_endpoint => "us-east-1"
      # keep track of the last processed file
      sincedb_path => "./last-s3-file"
      codec => "json"
      type => "cloudwatch"
  }
}

filter {}

output {
   elasticsearch_http {
      host => "server-ip"
      port => "9200"
   }
}

A Final Note

There are other methods of pulling the data from CloudWatch into S3 — using Kinesis and Lambda, for example. If you’re looking for an automated process, this might be the better option to explore — I will cover it in the next post on the subject.

Also, if you’re looking for a more comprehensive solution for logging Docker environments using ELK, I recommend reading about the Logz.io Docker log collector.

Logz.io is an AI-powered log analysis platform that offers the open source ELK Stack as a cloud service with machine learning technology and can be used for log analysis, IT infrastructure and application monitoring, business intelligence, and more. Start your free trial today!

Daniel Berman is Product Evangelist at Logz.io. He is passionate about log analytics, big data, cloud, and family and loves running, Liverpool FC, and writing about disruptive tech stuff.

Playing Around with Metricbeat and Elastic Stack 5.0

$
0
0

metricbeat elastic stack

After a long wait, the greatly anticipated release of Elastic Stack 5.0 — the new name for the ELK Stack — was announced. (You can see our guide on installing the Elastic Stack beta here.)

In the next couple of weeks, we will start to take a closer look at some of the new features.

Since I’ve already covered a number of ways to monitor system metrics with ELK, I wanted to begin with trying out Metricbeat — a revamped version of Topbeat.

As its name implies, Metricbeat collects a variety of metrics from your server (i.e., operating system and services) and ships them to an output destination of your choice. These destinations can be ELK components such as Elasticsearch or Logstash or other data processing platforms such as Redis or Kafka.

Setting up the EMK Stack (Elasticsearch, Metricbeat, and Kibana)

We’ll start by installing the components we’re going to use to construct the logging pipeline — Elasticsearch to store and index the data, Metricbeat to collect and forward the metrics, and Kibana to analyze them (Logstash has begun its retreat from the stack, something we will discuss in a future article).

If you already have these components installed, feel free to slip to the next step.

Installing Java

First, we need Java 8:

$ sudo add-apt-repository ppa:webupd8team/java
$ sudo apt-get update
$ sudo apt-get install oracle-java8-installer

You can verify using this command:

$ java -version

java version "1.8.0_111"

Java(TM) SE Runtime Environment (build 1.8.0_111-b14)

Java HotSpot(TM) 64-Bit Server VM (build 25.111-b14, mixed mode)

Installing Elasticsearch and Kibana

Next up, we’re going to download and install the public signing key for Elasticsearch:

$ wget -qO - https://artifacts.elastic.co/GPG-KEY-elasticsearch | sudo apt-key add -

Save the repository definition to ‘/etc/apt/sources.list.d/elastic-5.x.list’:

$ echo "deb https://artifacts.elastic.co/packages/5.x/apt stable main" | sudo tee -a /etc/apt/sources.list.d/elastic-5.x.list

Update the system, and install Elasticsearch:

$ sudo apt-get update &amp;&amp; sudo apt-get install elasticsearch

Run Elasticsearch using:

$ sudo service elasticsearch start

You can make sure Elasticsearch is running using the following cURL:

$ curl “http://localhost:9200”

You should be seeing an output similar to this:

{

 "name" : "GLOA3NX",

 "cluster_name" : "elasticsearch",

 "cluster_uuid" : "C4gM3wLFR9e4br_NQ0ksKQ",

 "version" : {

   "number" : "5.0.0",

   "build_hash" : "253032b",

   "build_date" : "2016-10-26T05:11:34.737Z",

   "build_snapshot" : false,

   "lucene_version" : "6.2.0"

 },

 "tagline" : "You Know, for Search"

}

Next up, we’re going to install Kibana with:

$ sudo apt-get install kibana

To verify Kibana is connected properly to Elasticsearch, open up the Kibana configuration file at: /etc/kibana/kibana.yml, and make sure you have the following configuration defined:

server.port: 5601

elasticsearch.url: "http://localhost:9200"

And, start Kibana with:

$ sudo service kibana start

Installing Metricbeat

Our final installation step is installing Metricbeat. To do this, you will first need to download and install the Elasticsearch public signing key.

$ wget -qO - https://artifacts.elastic.co/GPG-KEY-elasticsearch | sudo apt-key add -

Next, save the repository definition to /etc/apt/sources.list.d/elastic-5.x.list:

$ echo "deb https://artifacts.elastic.co/packages/5.x/apt stable main" | sudo tee -a /etc/apt/sources.list.d/elastic-5.x.list

Then, update your system and install Metricbeat:

$ sudo apt-get update &amp;&amp; sudo apt-get install metricbeat

Configuring the pipeline

Now that we’ve got all the components in place, it’s time to build the pipeline. So our next step involves configuring Metricbeat — defining what data to collect and where to ship it to.

Open the configuration file at /etc/metricbeat/metricbeat.yml.

In the Modules configuration section, you define which system metrics and which service you want to track. Each module collects various metricsets from different services (e.g. Apache, MySQL). These modules, and their corresponding metricsets, need to be defined separately. Take a look at the supported modules here.

By default, Metricbeat is configured to use the system module which collects server metrics, such as CPU and memory usage, network IO stats, and so on.

In my case, I’m going to uncomment some of the metrics commented out in the system module, and add the apache module for tracking my web server.

At the end, the configuration of this section looks as follows:

- module: system
 metricsets:
   - cpu
   - load
   - core
   - diskio
   - filesystem
   - fsstat
   - memory
   - network
   - process
 enabled: true
 period: 10s
 processes: ['.*']

- module: apache
  metricsets: ["status"]
  enabled: true
  period: 1s
  hosts: ["http://127.0.0.1"]

Next, you’ll need to configure the output, or in other words where you’d like to send all the data.

Since I’m using a locally installed Elasticsearch, the default configurations will do me just fine. If you’re using a remotely installed Elasticsearch, make sure you update the IP address and port.

output.elasticsearch:
  hosts: ["localhost:9200"]

If you’d like to output to another destination, that’s fine. You can ship to multiple destinations or comment out the Elasticsearch output configuration to add an alternative output. One such option is Logstash, which can be used to execute additional manipulations on the data and as a buffering layer in front of Elasticsearch.

Once done, start Metricbeat with:

$ sudo service metricbeat start

You should get the following output:

016/11/02 11:38:35.026027 beat.go:264: INFO Home path: [/usr/share/metricbeat] Config path: [/etc/metricbeat] Data path: [/var/lib/metricbeat] Logs path: [/var/log/metricbeat]

2016/11/02 11:38:35.026072 beat.go:174: INFO Setup Beat: metricbeat; Version: 5.0.0

2016/11/02 11:38:35.026192 output.go:167: INFO Loading template enabled. Reading template file: /etc/metricbeat/metricbeat.template.json

2016/11/02 11:38:35.026292 logp.go:219: INFO Metrics logging every 30s

2016/11/02 11:38:35.028538 output.go:178: INFO Loading template enabled for Elasticsearch 2.x. Reading template file: /etc/metricbeat/metricbeat.template-es2x.json

2016/11/02 11:38:35.030666 client.go:107: INFO Elasticsearch url: http://localhost:9200

2016/11/02 11:38:35.030741 outputs.go:106: INFO Activated elasticsearch as output plugin.

2016/11/02 11:38:35.030840 publish.go:291: INFO Publisher name: ip-172-31-25-148

2016/11/02 11:38:35.030948 async.go:63: INFO Flush Interval set to: 1s

2016/11/02 11:38:35.030968 async.go:64: INFO Max Bulk Size set to: 50

2016/11/02 11:38:35.031054 metricbeat.go:25: INFO Register [ModuleFactory:[system], MetricSetFactory:[apache/status, haproxy/info, haproxy/stat, mongodb/status, mysql/status, nginx/stubstatus, postgresql/activity, postgresql/bgwriter, postgresql/database, redis/info, redis/keyspace, system/core, system/cpu, system/diskio, system/filesystem, system/fsstat, system/load, system/memory, system/network, system/process, zookeeper/mntr]]

Config OK

Not getting any errors is great, and another way to verify all is running as expected is to query Elasticsearch for created indices:

$ curl http://localhost:9200/_cat/indices?v

health status index                 uuid                   pri rep docs.count docs.deleted store.size pri.store.size
yellow open   metricbeat-2016.11.02 gdQIYsr9QRaAw3oJQGgVTA   5   1        924            0    843.7kb        843.7kb

Analyzing the data in Kibana

Our last and final step is to understand how to analyze and visualize the data to be able to extract some insight from the logged metrics.

To do this, we first need to define a new index pattern for the Metricbeat data.

In Kibana (http://localhost:5601), open the Management page and define the Metricbeat index in the Index Patterns tab (if this is the first time you’re analyzing data to Kibana, this page will be displayed by default):

configure index pattern kibana

Select @timestamp as the time-field name and create the new index pattern.

Opening the Discover page, you should see all the Metricbeat data being collected and indexed.

metricbeat data in log file

If you recall, we are monitoring two types of metrics: system metrics and Apache metrics. To be able to differentiate the two streams of data, a good place to start is by adding some fields to the logging display area.

Start by adding the “metricset.module” and “metricset.name” fields.

metricset module and name

Visualizing the data

Kibana is notorious for its visualization capabilities. As an example, let’s create a simple visualization that displays CPU usage over time.

To do this, open the Visualize page and select the Line Chart visualization type.

We’re going to compare, over time, the user and kernel space. Here is the configuration and the end-result:

user and kernal configuration

Now, luckily for us Elastic created an easy way to get started with building visualizations of the data by providing us with a way to download a Metricbeat dashboard. This will save us the time of figuring out how to build visualizations, a task that can be fun but can also consume quite a lot of time if you’re new to Kibana.

Note: If you’re using Logz.io, you’ll find a pre-made Metricbeat dashboard in ELK Apps — our library of pre-made visualizations, dashboards, alerts and searches for various data types.

To use the dashboard, cd into the Metricbeat installation folder and execute the installation script:

$ cd /usr/share/metricbeat/

$ ./scripts/import_dashboards

After the script downloads all the dashboards, all you have to do is open up the Dashboard page, select Open, and select which dashboard you’d like to use.

metricbeat dashboard kibana

In Summary

Playing around with new technology in a sandbox environment is always fun and worry-free. Deploying in production is an entirely different ball game, and it’s no wonder we meet ELK users still using Elasticsearch 1.x.

Still, Elastic Stack 5.0 is a major improvement from the previous version, both from a user experience perspective and a performance/stability perspective.

Logz.io is an AI-powered log analysis platform that offers the open source ELK Stack as a cloud service with machine learning technology and can be used for log analysis, IT infrastructure and application monitoring, business intelligence, and more. Start your free trial today!

Daniel Berman is Product Evangelist at Logz.io. He is passionate about log analytics, big data, cloud, and family and loves running, Liverpool FC, and writing about disruptive tech stuff.

Integrating Logz.io with PagerDuty & Using Aggregations for Alerts

$
0
0

pagerduty using aggregation for alerts

One of the most popular features Logz.io provides its users with is the built-in alerting mechanism. Coupled with the rich indexing and querying capabilities that are part and parcel of Elasticsearch and Kibana, Logz.io Alerts is a powerful tool to have on your side in day-to-day operations.

This article will introduce you to some of the latest updates to the feature applied over the past few weeks, namely — the ability to trigger alerts on field aggregations and the new integration with PagerDuty.

Integrating with PagerDuty

For starters, I’m going to describe how to integrate Logz.io with PagerDuty. The result of the steps described below is an ability to get alerted when specific conditions that you define are triggered in your ELK Stack environment via PagerDuty.

Retrieving a PagerDuty Service Key

We will start with a crucial element required for integrating Logz.io with PagerDuty — the service key. PagerDuty service keys are basically integration API keys that are required for integrating with PagerDuty services.

To retrieve a service key, first log into PagerDuty and go to Configuration | Services.

You now have the choice of either using an existing service or creating a new one. As a best practice and for the sake of order and segregation of services, I recommend creating a new service for integrating with Logz.io.

To do this, click Add New Service (if you want to add the Logz.io integration to an existing service, select it from the list of services, go to Integrations, and click New Integration).

add a service pagerduty

Name the new service, and in the Integration Settings section select the Use our API directly option.

There are some additional settings to services, such as escalation policy and incident timeouts, but for now you can do with the default settings.

To create the service, name the new integration, and hit the Add Service button at the bottom of the page.

pagerduty add service

The service is added, and under Integrations you will be able to see the service key needed to integrate with Logz.io.

Creating a New Endpoint

Logz.io allows hooking into any paging or messaging app that uses webhooks. In this blog post we described how to hook into Slack to get notified on events. Now, you can easily integrate with PagerDuty as well.

You can create new endpoints, and edit existing endpoints, from defined alerts, but we will start fresh by creating a new endpoint from the Alert Endpoints page under Alerts.

create alert endpoint

Clicking the Create Endpoint link opens the Create Endpoint dialog.

create endpoint dialogue

Here, you have the choice to select what kind of endpoint you want to add. As mentioned already, you can create a new custom endpoint in which all you have to do is define the REST API and webhook used, but in our case we’re going to select the built-in integration with PagerDuty.

use pagerduty integration

Name the new endpoint and give it a description (optional). Then, enter the PagerDuty service key we created in the first step above.

When done, click Save. The new PagerDuty endpoint is added.

save pagerduty endpoint

Creating a New Alert

It now starts to get interesting. Let’s take a closer look at how to create a new alert and the different alert types we can use in Logz.io.

In the example below, I’m analyzing Apache access logs, and have used a filtered query to have Kibana show only Apache log messages containing an error response starting from ‘400’ onwards, and only for requests from the United States.

apache log messages in kibana

To create an alert for this specific query, all I have to do is hit the Create Alert button next to the query field.

create alert

As you can see, the exact query, together with the filter I used, is defined as the query. If we wanted, we could edit this query by editing the syntax within the Query box. If our syntax includes an error, we will be notified so there’s no way of making any mistakes. A best practice we recommend is to double-check the exact query you’re using for the alert — either in the Discover tab or even by trying the query for building a visualization.

Now, you can decide what type of aggregation to use as the alert condition. A simple example is to use a count aggregation — meaning that an alert will be triggered should the query be found a defined number of times in Elasticsearch.

You can then configure the exact condition and threshold to use. In the example above, we’re instructing Logz.io to trigger an alert should the query be found more than 5 times and within a time period of the last hour.

On the next page of the wizard, enter a name and description for the alert, and select a severity.

create new alert wizard

On the final page of the wizard, you can suppress alerts for a specific time period. This acts as a kind of “snoozing” mechanism, to make sure you don’t get bombarded by a large quantity of alerts once the first alert is triggered.

This is also the place where we decide how we want to be notified. Since we went to all that trouble of configuring a new PagerDuty endpoint, I’m going to select the drop-down menu and select it from the list of available endpoints (as mentioned, you could also create a new endpoint directly from this wizard as well).

notification endpoint

Hitting Create Alert, the new alert is then added to the other alerts I have defined in the system.

add alert to other alerts

On this page, you can view your alerts, edit them and disable them if you like. In any case. From this point onwards, should the conditions you defined be fulfilled, Logz.io will trigger an alert. In PagerDuty, these are called incidents, and they will appear under the Incidents tab, on the service page.

pagerduty service tab

Using aggregations for alerts

In Elasticsearch, metric aggregations help track and calculate metrics across fields in log messages. For example, say you’d like to monitor memory usage for your servers. Using the max aggregation, you can easily track the maximum relevant value in your logs across all the values extracted from the aggregated documents.

Logz.io now supports creating alerts using aggregations: max, min, avg, and sum. Let’s see how this works.

In the example below, I’m monitoring server metrics using Metricbeat. Continuing the theme used above, I’m going to create an alert using an average aggregation on the ‘system.memory.total’ field.

monitoring server metrics

I’m asking the Logz.io alerting engine to trigger an alert should the aggregated average value exceed ‘1000000’ during the last 12 hours (Logz.io checks if conditions are met once every 60 seconds).

This is what the incident looks like in PagerDuty.

incident detail

The details of the alert specify the conditions that triggered the alert in JSON format. In this case:

  1. The field upon which the aggregation was performed
  2. The result aggregation value
  3. Severity level
  4. Alert description
  5. Link to the alert in the Logz.io UI

Grouping aggregations in alerts

Another interesting option when creating an alert is to group together aggregations according to a specific field. Under certain circumstances, when the conditions for triggering an alert are similar across a specific field, grouping can save you the time configuring multiple alerts.

Say, for example, you’re monitoring the average amount of used memory in your environment.

In the example below, we’re going to define an alert that will only trigger if the aggregated average for the ‘system.memory.used.bytes’ field equals or surpasses ‘2000000000’ for the last hour (free tip: a good way to decide what specific threshold to use is to first build a visualization for monitoring expected behavior).

In addition, we’re asking Logz.io to group together the aggregations per host (using the ‘beat.hostname’ field).

group aggregations per host

Taking a look this time at the alert details in PagerDuty, we can see that the aggregations are calculated and grouped according to the IP of the server.

[{
  "beat.hostname" : "ip-172-31-25-148",
  "system.memory.used.bytes" : "8030429184.00"
}
{
  "beat.hostname" : "ip-172-31-21-11",
  "system.memory.used.bytes" : "4636509696.00"
}]

So, instead of configuring two different alerts using a different query for each host, we grouped the aggregations together in the same alert. Again, this feature will be especially useful when the conditions for triggering an alert are identical for multiple values of a specific field.

A Summary

Since being introduced last year, and following both our growing understanding of how Alerts are being used and direct feedback received from our users, this feature has evolved to become an extremely powerful alerting mechanism for monitoring modern IT environments and troubleshooting events in real-time.

We have some great stuff in the pipeline, including some new integrations for other alerting and messaging applications. Stay tuned for news!

Logz.io is an AI-powered log analysis platform that offers the open source ELK Stack as a cloud service with machine learning technology and can be used for log analysis, IT infrastructure and application monitoring, business intelligence, and more. Start your free trial today!

Daniel Berman is Product Evangelist at Logz.io. He is passionate about log analytics, big data, cloud, and family and loves running, Liverpool FC, and writing about disruptive tech stuff.

Reporting From the Front of AWS re:Invent 2016

$
0
0

reinvent 2016

LAS VEGAS, Nevada — AWS CEO Andy Jassy really enjoyed the keynote he gave yesterday at AWS re:Invent. Thirty-two thousand attendees watched him jab Oracle founder Larry Ellison while he spoke about Amazon providing its users with visibility and vision. Then — as a picture of Ellison showed up on the large screen on stage — Jassy mentioned that Amazon Web Services also gives the “ability to see through hand-waving and bombast.”

There was plenty of fanfare during the keynote, including an actual 45-foot semi-trailer riding onto the stage — called Snowmobile, the truck will transfer up to 100PB of data at a time to Amazon’s data center — but there were also some extremely interesting announcements about new services.

aws reinvent 2016

(For more reasons that Ellison might want to be less excitable, read our DevOps Pulse 2016 study. Among other industry findings, it shows that AWS rules the cloud — and Oracle is not even close.)

So, here’s a short recap of the major news that has come out of AWS re:Invent so far, just in case you happened to miss out on the live streaming of the event.

New Instances and Computation Services

Jassy announced a series of new instance types and services to complement and enhance Amazon’s computation offerings, including new T, R, I, and C family instances as well as a new instance family for FPGA instances. All new instances offer enhanced memory, throughput, and processing.

Also announced were Elastic GPUs for EC2, which will allow users to allow attaching GPUs to any of the instance types.

Other interesting news in the computation field included the introduction of a new Amazon service called Lightsail, a service that will easily create a VPS (virtual private server). Users will be able to get a VPS up and running in just a few steps while — behind the scenes — AWS will take care of launching the VM, attaching the SSD, and then configuring the IAM and security groups. (Of course, it will be interesting to see how companies that offer similar VPS hosting services such as DigitalOcean will react.)

Databases

The big news on Amazon’s Aurora database service is that it is now fully compatible with PostgreSQL. Jeff Barr covers the specifics in this blog post, but from a business perspective, this move will make AWS extremely appealing to enterprise companies that are dissuaded by Oracle and Microsoft’s prices.

Big Data Analysis

A long-awaited announcement in the realm of analysis is a new service called Athena.

This serverless service allows for the interactive and direct querying of S3 using standard SQL. There’s no cluster to handle and no management overhead — users can just query the data without worrying about the infrastructure.

Users will pay per query, but the query results get stored in an S3 bucket — meaning that people will need to pay additional charges for the S3 usage.

Machine Learning and AI

Judging from both Andy Jassy’s keynote and Werner Vogel’s post from yesterday, it seems that Amazon has taken to heart claims that they are lagging behind their competitors in the fields of machine understanding and artificial intelligence. Both made a point of highlighting Amazon’s legacy work and commitment in these fields before introducing the new services.

With more and more cloud providers offering machine learning tools and artificial intelligence as part of their standard enterprise cloud offerings as well as the emergence of a new and growing ecosystem around this field, I was expecting Amazon to make plenty of big announcements during the keynote. Indeed, there was plenty of news — but you can be the judge of how much of it was significant.

During the keynote, Jassy introduced a machine understanding toolkit for developers that consists of three complementing AI services:

  • Rekognition is a managed, deep-learning service for analyzing images and objects. These objects can be passed either in batch or in real-time to the service via SDK or API, both of which are integrated with S3 and Lambda.
  • Lex takes the technology that powers Alexa — Amazon’s voice-activated virtual assistant — and allows developers to use it to build apps using conversational interfaces with voice and text.
  • Polly is Amazon’s new TTS (text to speech) service that takes streams of text and produces a speech output.

“It’s all about having the right tools to build with,” Jassy told the audience at re:Invent. With these three services, developers have a solid toolkit to use when building the next generation of cloud applications.

IoT

Extending AWS onto Internet of Things devices is essentially what Greengrass, the last new service announced during the keynote, is all about.

Built on top of both AWS IoT and AWS Lambda, Greengrass will enable developers to write Lambda functions that run on the device. Greengrass will run these functions locally on the device but will also interact with AWS on the cloud for management purposes.

In sum, plenty of interesting news came out yesterday from re:Invent, with AWS now offering many new services in fields that have seen huge growth over the past year including Big Data, AI, machine understanding, and IoT.

I wonder what Werner Vogels will have in store for us for today.

Daniel Berman is Product Evangelist at Logz.io. He is passionate about log analytics, big data, cloud, and family and loves running, Liverpool FC, and writing about disruptive tech stuff.

Using Kibana Timelion for Time Series Analysis

$
0
0

kibana timelion

First introduced by Elastic a year ago, Kibana’s Timelion is another step in closing the gap between Kibana and Grafana. Both these visualization tools have their own strengths and weaknesses (see this comparison), but one aspect that Kibana falls short is in time series analysis and visualization.

This is precisely where Timelion comes in.

Timelion enables you to combine independent data sources within the same visualization. Using a relatively straight-forward syntax, you can execute advanced mathematical calculations, such as dividing and subtracting metrics, calculating derivatives and moving averages, and of course visualizing the results of these calculations.

In total, there are about fifty different functions (some still experimental) you can use to slice and dice the data set you’re analyzing. This article will provide you with the basic of getting started with Timelion and its function syntax.

Installing Timelion

Start with Kibana 5.0. Since Timelion is built into Kibana, there’s no need in taking any additional installation and setup steps. All you need is data!

Since I presume most of the readers are not yet on the latest version of Kibana, here’s how to install Timelion on older versions.

Access the Kibana installation directory:

$ cd /opt/kibana

Execute:

$ sudo ./bin/kibana plugin -i elastic/timelion

Then, restart Kibana and refresh your browser. Kibana should appear as a separate tab.

Since I’ve already got Elastic Stack 5.0 — the new name for the ELK Stack — setup on my dev machine, the remaining sections will be showing off Kibana 5.0. Specifically, I’ll be demonstrating analysis of system and Apache metrics collected by Metricbeat.

Timelion Expressions

Like every querying syntax, Timelion has it’s own language for defining functions.

For example, each expression needs to start with a dot ‘.’ As you begin experimenting, you will slowly begin to understand the nuances between each expression. Timelion’s helpful auto-completion feature will help you build the expression as you go along (Timelion also has a built in tutorial and docs to help get you started.)

timelion expressions

Opening Timelion for the first time, you’ll see that the function box at the top of the page already includes a default expression:

.es(*)

This expression is basically telling Timelion to show everything in the default Elasticsearch index. If you’d like to restrict Timelion to data within a specific index, you can specify the index within the function:

.es(index=metricbeat-*)

timelion specific index data

In any case, you must start every Timelion expression with a datasource function.

Performing Basic Calculations

The next function I’m going to show will calculate the total amount of memory usage of my server using the ‘metric’ argument.

.es(metric='sum:system.memory.used.bytes')

On the right, you can select a different time range to change the resolution of the visualization.

timelion visualization resolution

To display the average on a numeric value, all I have to do is change the function to:

.es(metric='avg:system.memory.used.bytes')

Other mathematical arguments you can use are: min, max and cardinality, all of which need to be followed by a specific field.

Using a comma in the function, you can analyze a series of metrics together:

.es(metric='avg:system.memory.used.bytes'), .es(metric='avg:system.cpu.system.pct')

analyze timelion metrics together

Chaining Functions

You can chain functions together, but note that the expression must first contain the data source function somewhere before the chained function.

For example, let’s display the variation (the function’s derivative) for a specific value by using the following formula:

.es(metric='avg:system.memory.used.bytes').derivative()

timelion display variation derivative

Data Formatting

You can also label data as well as other types of data formatting (such as setting the position of the legend or changing the color of a series — see below) within the function syntax.

The example below defines the label to use:

.es(metric='avg:system.memory.used.bytes').derivative().label('System memory derivative')

timelion data formatting

Analyzing Trends

Another useful function to use is trend (). This function can be used to display a trend line using either a log or linear regression algorithm:

.es(metric='avg:system.memory.used.bytes').trend(mode='linear')

timelion trend analysis

Using Offsets

Another useful option in Timelion is using offsets to analyze old data. This is useful for comparing current trends with earlier patterns.

For example, say you’d like to explore the average amount of memory usage yesterday:

.es(metric='avg:system.memory.used.bytes', offset=-1d)

You can then add the graphs side by side to get the dashboard effect (click Add at the top of the page, and enter a new expression).

I’d recommend using .color() in the expression for easier analysis:

.es(metric='avg:system.memory.used.bytes', offset=-1d).color(#ff0000)

timelion multiple colors

Of course, just like in regular Kibana visualizations, you can filter events with simple drag and dropping.

timelion filter events

Visualizing Timelion Expressions

As with “regular” visualizations in Kibana, you can visualize Timelion expressions from the Visualize tab.

On the Visualize page, select Timeseries as the visualization type and enter the Timelion expression in the designated field.

visualize timelion expressions

Another option is to simply save the expression in Timelion itself and then open it in the Visualize tab. In any case, these expression visualizations can then be added to your dashboard together with other visualizations.

Analyzing Other Data Sources

Of course, all of the above relates to analyzing data indexed in Elasticsearch.  Things can really get interesting with Timelion when pulling from external data sources using public API. Timelion has native API for pulling data from the World Bank, Quandl and Graphite.

This blog post goes into details on pulling data from Quandl and shows some good examples of the deep analysis that can be done with Timelion. More resources are listed below.

Endnote

Timelion is a pretty powerful tool for analyzing time series data and compliments Kibana’s traditional visualization capabilities. As such, we will be adding it to Logz.io in the next few weeks.

As with any new technology, Timelion is still somewhat “in-development” and the documentation is still a bit sketchy, so you can expect a small learning curve (for example, the function documentation lacks examples).

I highly recommend reading through the built-in Timelion tutorial. It contains some useful definitions and clarifies the differences between expressions.

Here are some additional resources to help you understand Timelion:

Enjoy!

Logz.io is an AI-powered log analysis platform that offers the open source ELK Stack as a cloud service with machine learning technology and can be used for log analysis, IT infrastructure and application monitoring, business intelligence, and more. Start your free trial today!

Daniel Berman is Product Evangelist at Logz.io. He is passionate about log analytics, big data, cloud, and family and loves running, Liverpool FC, and writing about disruptive tech stuff.

Taking a Look at 5 Startups at AWS re:Invent 2016

$
0
0

interesting tech at aws reinvent

LAS VEGAS, Nevada — AWS rules the cloud.

This is no secret, and last week’s re:Invent reaffirmed this. It’s much more than a feeling or impression though — it’s backed in numbers and data. Any research on the topic such our DevOps Pulse 2016 survey points to the same fact — Amazon Web Services dominates the space, with Azure and Google Cloud Platform trailing far behind.

At AWS re:Invent 2016, one only had to stroll through the expo hall — not a small feat, let me tell you — to witness the size of the ecosystem that has developed around Amazon Web Services. AWS owes a lot of its growth and dominance to this ecosystem.

This post takes a look at some of the startups just starting out in this ecosystem. This year, it was impossible to visit every single company, but below is a brief on some of the technologies that caught my eye.

Enjoy!

Fugue

Orchestration is one of the new spaces developing around AWS, and there were a number of technologies on show at AWS re:Invent that were attempting to abstract the layer of complexity involved in running AWS deployments.

Fugue is one of these attempts, and it’s an extremely interesting one in that. Fugue offers a “conductor” for automating AWS operations that run as an instance on its own on your AWS account, a CLI to start and manage the various AWS processes, and a unique scripting language called Ludwig.

Here’s a demo example:

# import AWS modules from Fugue Standard Library
 import Fugue.AWS as AWS
 import Fugue.AWS.EC2 as EC2
 import Fugue.AWS.ELB as ELB
 import Fugue.AWS.IAM as IAM
 import Fugue.AWS.DynamoDB as DynamoDB
 import Fugue.AWS.AutoScaling as AutoScaling
 
 # declare region
 demo-app-region: AWS.Us-west-2
 
 # create DynamoDB table
 demo-app-table: DynamoDB.Table.new(DynamoDB.Table.default with {
  name: "demo-app-table",
  attributes: {"PropertyName": DynamoDB.S},
  schema: {"PropertyName": DynamoDB.HASH},
  provisionedThroughput: {
    read: 10,
    write: 10,
  },
  region: demo-app-region,
 })

In a typical workflow, you could use Ludwig to declare your AWS infrastructure in a configuration file that would be then passed to the Fugue conductor using CLI. So, in essence, Fugue is all about abstracting cloud operations into code. It’s a very interesting approach.

CloudScreener

As our DevOps survey showed, the move to the cloud is not as widespread as believed. Despite the pay-as-you-go pricing model, the overall cost of big deployments on AWS can be steep. This is certainly one of the considerations for companies thinking about moving to the cloud.

Also, companies already deployed on the cloud are constantly seeking better options — but the problem is that putting a pricing tag on cloud infrastructure is not easy when comparing different cloud providers.

CloudScreener offers an easy way to explore pricing for infrastructure. Just as if you’re buying a vacation online, you can provide your hardware and budget requirements to CloudScreener’s recommendation engine and see all the different options listed. CloudScreener also allows you to add any special deals you may have with the cloud vendor so the discounts are factored into the pricing.

cloudscreener

Codefresh

Codefresh is an extremely interesting DevOps tool developed specifically for Docker users that allows for the seamless building, testing, and deployment of Docker images. It’s uniqueness and added value compared to other services in the continuous integration and continuous deployment sphere is the Docker-specific support.

With Codefresh, you can build a new Docker image using either an existing Dockerfile or by creating a new one. You can use templates for popular frameworks such as Java, node.js, and Rails to help ease the process of writing the new Dockerfile.

codefresh

From this point, any commit to the repository will automatically create a new Docker image. Codefresh will monitor GitHub or the other CI services with which it integrates and then trigger an alert when a change is identified. If you like, you can also push the build images to a Docker registry or run unit tests on builds. You can do all this from within a neat and intuitive UI.

So, in essence, Codefresh can be used to set up development and testing environments easily. It’s very useful if you’re looking to get an early feature preview, for example.

RiverMeadow

Migrating servers and applications to and between clouds is a complex and painful task that is usually extremely time-consuming, costly, and often involves a serious amount of downtime. It’s not surprising that a number of technologies on show at AWS re:Invent claimed that they can help to alleviate these challenges.

One of these companies was RiverMeadow Software. RiverMeadow is a SaaS platform that enables users to automate and manage the migration process within an easy-to-use UI. The platform can migrate x86-based physical servers, virtual servers, and cloud servers.

You define the target environment and the source, and RiverMeadow will take care of the entire process. It will validate the destination and make sure that it complies with the source definitions. It does this without interfering with the source server during the migration — this is a huge benefit and differentiator compared to other similar services. RiverMeadow doesn’t require hypervisor access, it can migrate N servers concurrently, and there’s no need to install agents because RiverMeadow integrates with the cloud API.

It’s definitely worth exploring if migration is part of your Q1 planning.

FittedCloud

Another company offering cost optimization services is FittedCloud. This company promises to make sure that you’re only paying for the AWS services that you are actually using. It does this by monitoring the resource utilization and automatically adjusting the provisioning to match the needs of your applications.

fittedcloud

There are plenty of other services that offer similar services, but FittedCloud is somewhat different because the company actually dynamically optimizes resources and uses machine learning to figure out what and how to optimize.

Currently, FittedCloud has support optimization services for EC2, EBS, and DynamoDB, with support for additional services on the roadmap.

I’m looking forward to AWS re:Invent 2017! It’ll be interesting to see where these technologies go next year.

Daniel Berman is Product Evangelist at Logz.io. He is passionate about log analytics, big data, cloud, and family and loves running, Liverpool FC, and writing about disruptive tech stuff.

Log Correlation with Logz.io and Datadog

$
0
0

datadog log correlation

Logs contain extremely valuable information. They can tell you what happened and when. It’s the why that is challenging. In log analysis, the problem is that none of the logs contain a message clearly stating something specific such as this: “Your website crashed due to an awfully-written database query.”

That’s where centralized logging and log correlation comes into the picture. Being able to collect logs from all the various layers in your infrastructure and identify correlations between the different data sources is one of the reasons that the ELK Stack (Elasticsearch, Logstash and Kibana) is so popular. The stack allows you to ingest and store logs from multiple sources easily and then build visualizations and dashboards on top of the data.

If you’re using the Logz.io AI-powered ELK Stack for centralized log analysis and Datadog for metric monitoring, you can now use both for log correlation. This post will describe how to use the new integration between the two platforms. Specifically, we will be creating an alert in Logz.io for a specific Elasticsearch query, ingesting this alert using the Datadog API, and then building a comprehensive dashboard.

Retrieving the Datadog API Key

This first step is easy — retrieving a Datadog API key to ingest Logz.io alerts. This can be done via the Integrations → APIs tab:

retrieve datadog api key

Make note of the API key. We’ll need it when we will configure our Datadog endpoint in Logz.io (for the sake of good order, I recommend creating a new key called “Logz.io”).

Creating an Alert

Next up, let’s create a new alert in Logz.io and a new endpoint with which to send the alerts to Datadog.

In this case, I will be analyzing Apache and application logs. As a result of some forensics work, I’ve nailed down a specific log message that I’d like to monitor and on which to receive alerts — it’s a log that is reporting an invalid webapp transaction:

create datadog alert

Clicking Create Alert starts the process of alert creation and displays a three-step wizard. You’ll see that the filter that we used when querying Elasticsearch (return_message: “Invalid Transaction”) is already loaded in the “Query” field. You can modify this field any way you like — don’t worry about messing the query up because there is a verification process in place that will validate it.

We’re going to set the trigger conditions to set off an alert if this queried log message is logged more than once within a timeframe of one hour (the Logz.io alerting engine will search for a match every sixty seconds):

alert conditions

After entering a name and description for the alert in the second step of the wizard, it’s now time to define how we want to receive the new alert.

You can, of course, get notified via e-mail, but Logz.io also allows you to integrate with various messaging and alerting apps by creating custom endpoints.

Creating a custom endpoint is pretty straightforward. In the “Notifications” endpoints field, open the dropdown menu and select “Custom endpoint.” In the “Create Endpoint” dialog, configure the endpoint by entering a webhook URL (which you will need to retrieve from the third-party application) and selecting an HTTP method to use (such as GET, POST, or PUT).

In our case, though, we’re going to use the new built-in support for Datadog. To do this, just select “Datadog” from the “Type” dropdown menu, name the endpoint, enter a description, and then paste the API key that you had retrieved from Datadog:

create endpoint

Save the endpoint, and create the alert. It is now added to your defined alerts, and from this point onwards, you should be receiving it as an event in Datadog.

Creating the Dashboard

When you open the “Events” tab in Datadog, you should be able to see the Logz.io alert. Note that the alert will only display a maximum of five events that took place, in our example, five were displayed out of a total of twelve events that actually occurred:

create datadog dashboard

The event gives you the parsed log message in JSON format, as it was indexed in Elasticsearch.

Now, to get a more holistic view of the environment and be able to identify whether there are any correlations in the data, our next natural step is to add this event into a comprehensive monitoring dashboard.

In Datadog, this is done from the “Dashboards” tab — in which there are a number of default dashboards. You can, of course, build your own customized dashboard, but for the purpose of this demonstration, we’re going to open the host dashboard for our server:

datadog dashboard

This dashboard contains a rich variety of metrics on resource utilization — memory usage, load averages, disk usage, and so forth.

To add the Logz.io events, simply type “logz” in the search box at the top of the page and hit enter. A new window containing the alert that we defined in Logz.io will be added to the dashboard:

show alert in datadog dashboard

Now, to be able to identify whether there are any correlations between the events and the metric collection from our server, all you have to do is hover over the column in the graphs that represents incoming events from Logz.io:

datadog logzio integration

Summing up, the combination of Datadog’s monitoring capabilities and Logz.io ELK-based alerting mechanism can be a powerful tool set to have on your side, both for after-the-fact forensics and predictive analytics.

Logz.io is an AI-powered log analysis platform that offers the open source ELK Stack as a cloud service with machine learning technology and can be used for log analysis, IT infrastructure and application monitoring, business intelligence, and more. Start your free trial today!

Daniel Berman is Product Evangelist at Logz.io. He is passionate about log analytics, big data, cloud, and family and loves running, Liverpool FC, and writing about disruptive tech stuff.

The Docker Datacenter: Agile Application Development for Enterprise DevOps

$
0
0

docker data center

Docker’s Datacenter offering makes it easy for enterprises to set up their own internal containers-as-a-service (CaaS) environments. Put simply, the new package helps to integrate Docker into enterprise software delivery processes.

Available as a subscription, the Docker Datacenter (DDC) provides a way for organizations to let their developers deploy their applications easily without worrying about issues that might arise from moving a codebase from development into production.

The CaaS platform provides container and cluster orchestration. With cloud templates pre-built for the DDC, developers and IT operations staff can move Dockerized applications not only into clouds but also into and out of their premises.

The DDC includes the Docker Universal Control Plane (UCP), the Docker Trusted Registry (DTR), and the Commercially Supported (CS) Docker Engine.

docker data center

The Universal Control Plane

The UCP is a cluster management solution that can be installed on-premise or on a virtual private cloud. The UCP exposes the standard Docker API so that you can continue to use the tools that you already know to manage an entire cluster. As an example, you can still use the command docker info to check the status of the cluster:

Containers: 15
Images: 10
Server Version: swarm/1.1.3
Role: primary
Strategy: spread
Filters: health, port, dependency, affinity, constraint
Nodes: 2
 ucp: <UCP_IP>:<PORT>
   └ Status: Healthy
   └ Containers: 20
 ucp-replica: <UCP_REPLICA>:<PORT>
   └ Status: Healthy
   └ Containers: 10

The UCP_IP and PORT are the IP and the port of the cluster nodes. With the Docker UCP, you can still manage the nodes of your infrastructure as apps, containers, networks, images, and volumes. The Docker UCP has its own built-in authentication mechanism, and it supports LDAP and Active Directory as well as role-based access control (RBAC). This ensures that only authorized users can access and make changes to the cluster.

docker ucp dashboard

The UCP is a containerized application that allows you to manage a set of nodes that are part of the same Docker Swarm. The core component of the UCP is a globally-scheduled service called ucp-agent. Once this service is running, it deploys containers with other UCP components and ensures that they continue to run.

The Docker Trusted Registry

Docker security is one of the biggest challenges that developers face when it comes to enterprise adoption of Docker. Recognizing this challenge and the enterprise’s need to continue streamlining security across its whole network, Docker introduced the Docker Trusted Registry (DTR).

The DTR uses the same authentication mechanism as the Docker UCP. It has a built-in authentication mechanism and integrates with LDAP and Active Directory. It also supports RBAC. This allows you to implement individualized access control policies as necessary.

Docker Datacenter Deployment: Step-by-Step

There are mainly two options to run DDC. You can deploy the whole stack — including UCP and DTR — using AWS CloudFormation templates on top of Amazon or manually on top of your Linux servers. However, in our case, we will use the second option with the Docker CaaS (container as a service) offering. The CaaS option is basically a hosted SaaS solution where the Docker engine, UCP, and DTR are operated by Docker and the container nodes run on our servers. In this example, we will link to our AWS environment. However, note that these can run in your on-premise environment as well.

Deploy Node Clusters on Amazon Cloud

Log in to your DDC account (you can register for the trial Docker Datacenter version to try it), and look for the Cloud Settings option on the left menu. As shown below, you will see the Cloud providers option. This contains the list of supported public cloud providers with which you can connect. The cloud providers are there for creating and hosting the nodes, which are managed through the Docker Datacenter.

docker datacenter settings page

We will select AWS as our cloud provider. After clicking on the Plug-and-Play icon, you will see the dialog box with the input text field. This requires the role delegation ARN to be entered.  (See here for more on how to link your AWS account with the hosted Docker Datacenter.)

Node Cluster Setup

Once you are connected to your AWS environment, you’re now ready to set up the infrastructure. The infrastructure can be configured using the items under the Infrastructure section, as shown below:

docker datacenter node clusters page

After clicking the Create button, you will be redirected to the configuration page — where you will be asked to enter the configuration parameters for your cluster:

node clusters configuration page

The cluster name has no restrictions. This also applies to the Labels field, which allows you to provide additional descriptions about the cluster that you want to create.

The Suggestions list also appears shortly after clicking on this field. As the provider, you have to select the one that you have linked with your account. The field itself requires only one choice, and you are not restricted to creating node clusters that are hosted on different providers.

Continue with selecting your AWS region and the network (i.e., VPC). If you leave the VPC default as “auto,” all of the cluster’s nodes will be deployed under a new, automatically-created VPC.

The type/size field is used for configuring the number of CPUs and RAM per node. The IAM role can be untouched and left with the default value of “none.” The last two fields left to configure are the disk size and number of nodes that we want to put in the cluster. In our case, we set 10 GB for disk space, and three nodes to be created.

node clusters overview page

Now, click Launch node cluster. After a few seconds, this will be redirected to the Node Clusters overview page — where you will be able to track the status of your cluster. After node clusters have been deployed successfully, the status Deployed will be present just below the name of the node clusters.

aws console management page

Right after clicking the Launch Node cluster button, you will be able to see changes for your cloud provider (in our case, AWS). This is because the Docker Datacenter is linked with your cloud platform, and all nodes that are created are hosted there. You will be able to monitor them using supported ways of monitoring on your cloud platform. (See the Logz.io Docker Log Collector for one way to centralize and monitor Docker environments.)

Deploying a Service Across Node Clusters

We will now detail how to deploy a service across node clusters. In our case, this will be NGINX, using the images available on Docker Hub.

docker datacenter service page

On the left menu, click Services, which will display the service panel in the main view. Then click the Create button in the top right corner. You will be redirected to where you can select the way to get images for your deployment.

In addition to the Jumpstarts section and public images, there’s also a section where you can define your own repository from which you want to pull the images. We will use the publicly available images.

docker datacenter public images

Type “NGINX” inside the textbox inside the Search Docker Hub section, and press “Enter.” You will then see the list of available images that match the term “NGINX.” Select the official one, which is located as the first item in the list.

After clicking the “Select” button inside the list item, you will be redirected to the Settings page. One of the most important settings here is the deployment strategy. This is important for the following things:

  • Balancing the load across nodes
  • Setting the options for auto-restart and auto-destroy for what you want to occur when containers crash unexpectedly
  • Determining the policy for terminating containers when they stop (note that this action actually destroys all data in the containers upon termination)
  • Deciding the auto-redeploy option for automatically redeploying a service when new images are pushed or built

docker datacenter service settings page

The other panels are related to entry point additions, run commands, memory limits, and CPU limits. In this case, we do not have to change anything, so we will leave the default values as they are.

The next section is the Ports section, which is where we can select which ports are published and available to the outside world (as well as which ones are not publicly accessible). In our case, we will publish ports 80 and 443.

service settings

The next sections are for configuring the environment variables, volumes, and links on other services. The links are useful, for example, when you have deployed an API service as a separate service and your NGINX server is there to redirect requests to the API services.

When our configuration is done, we can click the “Create & Deploy” button, which will redirect you to the Service Overview page. There, you can see the deployment status, the overview of your configuration that you entered in the previous step, the containers, the triggers for scaling, the links, the volumes, the environment variables, and the endpoints that contain the DNS for accessing the NGINX server.

service overview page

If you click one of the links presented in the Endpoints section, you will see the NGINX welcome page.

As mentioned, in addition to connecting with your AWS account, you can also bring your own on-premise nodes. No matter where they are, you simply need to install supported operating systems. These are listed right after clicking the “Bring your own node” button in the Node Clusters section and typing the command (provided inside the modal window) inside the servers that are dedicated to act like a node inside the Datacenter.

bring your own node

In Summary

In this post, we have described how the Docker Datacenter can be used to work together with existing cloud platforms. We have also shown how the Datacenter is a robust, comprehensive platform that deserves attention for the efficiency that it brings to the DevOps world. Minimal time and effort is needed to install, configure, and upgrade whatever architecture is required for your services, and the Web UI can be managed in just a few clicks.

The Docker Datacenter also supports the Docker API, which is embedded in Docker Engine and Docker Swarm — where developers of existing services do not need to code or change anything. In addition to all of these features, the Datacenter also has built-in high availability and security features that keep the application pipeline flowing.

Logz.io is an AI-powered log analysis platform that offers the open source ELK Stack as a cloud service with machine learning technology and can be used for log analysis, IT infrastructure and application monitoring, business intelligence, and more. Start your free trial today!

Daniel Berman is Product Evangelist at Logz.io. He is passionate about log analytics, big data, cloud, and family and loves running, Liverpool FC, and writing about disruptive tech stuff.

Aggregated Alerting for Logs with Logz.io and BigPanda

$
0
0

aggregated log alerting logzio bigpanda

In previous posts, I wrote about the integration between Logz.io and Datadog and PagerDuty. In this article, I’d like to introduce you to an additional new integration — this time with BigPanda.

Just in case you’ve never heard of the platform, BigPanda aims to help users reduce the high signal-to-noise ratio in today’s IT monitoring stacks. A typical monitoring configuration consists of multiple tools, with each one generating its own set of alerts. BigPanda promises to help teams to correlate these different alerts and identify the ones that really matter.

Logz.io’s alerting feature allows you to create advanced alerts on specific log messages, with recent updates allowing users to create alerts using Elasticsearch metric aggregations such as max, min, avg, and sum.

Let’s see how these two platforms play together.

Creating a New Integration in BigPanda

First, we need to set up a new integration within BigPanda to retrieve a token and API key.

This is easily done via the Integrations tab in BigPanda. When asked to select what type of integration, select REST API. On the Integration page, you will then be required to generate an app key. In this example, I have named mine “logz.”

You then have the two pieces needed to create the integration in Logz.io: (1) The app key and (2) a token:

create integration in bigpanda

Creating a New Logz.io Endpoint

Now that we have the required pieces to set up the integration, we’re going to set up a new alert endpoint in Logz.io.

Under the Alerts tab, select the Alert Endpoints page and then click “Add Endpoint”:

add endpoint

Select “BigPanda” from the “Type” drop-down menu, and fill in the required details using the app key and token that we retrieved above.

After you save the new endpoint, it will be added to the list of endpoints defined in Logz.io:

list of alert endpoints

Creating a New Alert

Congratulations! The integration is set up, and all that is left now is to configure a new log-based alert to test whether the integration is working as expected.

Creating a new alert in Logz.io is done from the “Discover” tab in Kibana. Enter your query in the “Search” field — in this case, I’m looking at an Apache access log that reports a 504 error:

creating a new alert

Once you’ve narrowed down the type of log message on which you want to be alerted, click the “Create Alert” button. The query is copied to the Alert Creation Wizard, where it can be modified as desired:

modify alert

On the first page of the wizard, you will need to configure the trigger conditions — or, in other words, select which specific conditions will trigger an alert.

Then, after naming and describing the alert on the following page, all that’s left to do is select the BigPanda endpoint on the third and final page of the wizard:

create new alert wizard

Create the alert and open the Incidents page in the BigPanda UI. Once an alert is triggered in Logz.io, it will show up as a new incident in BigPanda.

Open the incident and select it to see more details on the log message:

get log message details

Note: To reduce the amount of “log noise,” Logz.io will send a maximum of five samples of the same event.

Once in BigPanda, you can use the rich sharing and event management features to manage and correlate with alerts from other integrations.

Additional Resources

Logz.io is an AI-powered log analysis platform that offers the open source ELK Stack as a cloud service with machine learning technology and can be used for log analysis, IT infrastructure and application monitoring, business intelligence, and more. Start your free trial today!

Daniel Berman is Product Evangelist at Logz.io. He is passionate about log analytics, big data, cloud, and family and loves running, Liverpool FC, and writing about disruptive tech stuff.

Announcing the Logz.io Search API

$
0
0

logzio search api

There’s nothing like starting a new week — not to mention the new year — with new product-related announcements! In this case, I’m happy to inform our users of a new Search API that will enable them to safely and securely query the data that they are shipping to Logz.io using the Elasticsearch Search API DSL.

This API replaces the older Query API, which was much more limited in scope and capabilities and will be deprecated in a few months.

Why would you use the API to query Elasticsearch instead of Kibana? Well, you could, for example, integrate with the API to create some kind of baseline for monitoring new services. As soon as a new service or host registers, you could use the API to match which of them are logging into Elasticsearch.

Below are some general guidelines on the API along with explanations of existing limitations and one simple example of how to use it.

Licensing and Limitations

For now, only our Enterprise users will have access to the Search API. Likewise, we are currently limiting the number of search results to 10,000 (with paging).

Queries can only be performed against data shipped over the prior two days (the current day and the one preceding it).

API Tokens

To use the Search API, you will first need to retrieve an API token. The token can be generated on the User Tokens page in your account’s user settings:

user tokens

Using the API

Once you have the token, you can begin querying your data.

First, build your query in JSON format in a file. You can refer to the Elasticsearch Search API documentation for guidance on how to build the query.

For example, I’m going to query my account for a simple string and limit the search to one response:

{

   "from" : 0, "size" : 1,
    "query": {
        "query_string": {
            "query": "canada"
        }
    }
 }

Then, build your API as follows (replace API-TOKEN with your token and QUERY with the path to your query file):

curl -XPOST 'https://api.logz.io/v1/search' --header "X-USER-TOKEN: <API-TOKEN>" --header "Content-Type: application/json" --data-binary @<QUERY>

And the response:

{  
  "hits":{  
     "total":984,
     "max_score":5.7908382,
     "hits":[  
        {  
"_index":"logz-xmywsrkbovjddxljvcahcxsrbifbccrh-161227_v2",
           "_type":"MyFirewall",
           "_id":"AVk9lI_BMfCTV-I4vosg",
           "_score":5.7908382,
           "_source":{  
              "geoip":{  
                 "timezone":"America/Toronto",
                 "ip":"204.138.58.86",
                 "latitude":43.5924,
                 "continent_code":"NA",
                 "city_name":"Toronto",
                 "country_code2":"CA",
                 "country_name":"Canada",
                 "country_code3":"CAN",
                 "region_name":"ON",
                 "location":[  
                    -79.7611,
                    43.5924
                 ],
                 "real_region_name":"Ontario",
                 "postal_code":"L5N",
                 "longitude":-79.7611
              },

"message":"<2016-12-27T20:31:13Z><myfw-dc2>:src_ip=204.138.58.86,sport=4209,dst_ip=87.151.247.146,dport=443",
              "type":"MyFirewall",
              "dst_ip":"87.151.247.146",
              "tags":[  
                 "_logz_http_bulk_json_8070",
                 "geoip"
              ],
              "src_ip":"204.138.58.86",
              "dport":443,
              "hostname":"myfw-dc2",
              "@timestamp":"2016-12-27T20:31:13.000+00:00",
              "sport":4209
           }
        }
     ]
  }

Endnotes

We’d love to get your feedback. If you encounter any bugs, please open an issue on GitHub or send us your comments to: support (at) logz.io.

Happy querying!

Logz.io is an AI-powered log analysis platform that offers the open source ELK Stack as a cloud service with machine learning technology and can be used for log analysis, IT infrastructure and application monitoring, business intelligence, and more. Start your free trial today!

Daniel Berman is Product Evangelist at Logz.io. He is passionate about log analytics, big data, cloud, and family and loves running, Liverpool FC, and writing about disruptive tech stuff.

Logging A Docker Environment with Portainer (Or Not)

$
0
0

docker portainer

For the sake of our dedicated readers, let’s start with the conclusion: Portainer is not a logging solution for Docker.

But wait! Before you move on — Portainer is an extremely useful and easy-to-use UI for Docker that is well worth exploring if Docker is part of your day-to-day work. And it’s open source!

Still with me? Great!

So, what is Portainer? Simply put, it’s a UI for Docker that allows you to “easily manage your Docker hosts or Swarm clusters.” In other words, it’s a pretty face on top of the Docker API.

Portainer runs as a lightweight (9.132 MB) container that can run on any Docker engine (Mac, Linux and Windows) and can be used to manage images, containers, volumes, networks and — yes — logs.

As someone who has looked into and written extensively about Docker monitoring with Logz.io and the ELK Stack, I was interested in testing the logging capabilities of Portainer.

Below are my notes.

Setting it Up

Installing Portainer is easy and can be done with two simple commands.

Start by pulling the image from the Docker hub:

docker pull portainer/portainer

Next, we need to run the container. Since it needs access to the Docker daemon on our host, we need to mount the socket file from within the container host:

docker run -d -p 9000:9000 -v /var/run/docker.sock:/var/run/docker.sock portainer/portainer

Now that your container is running, all that’s left to do is open your browser with the following URL:

http://<DockerHostIP>:9000

You now need to go through some simple configuration steps.

You should be seeing the password configuration page, where all you need to do is enter and then confirm a password.

portainer password

Clicking Validate, you will be asked to enter your password one last time and then an additional configuration page is displayed asking you which Docker host you want to manage with Portainer — you can choose between a remote Docker host and a local Docker.

choose remote or local docker

Once you complete that simple task, click Connect and you will have access to Portainer!

portainer dashboard

Playing Around

The default page that opens up is a dashboard. The dashboard gives you an overview of your Docker node (or nodes in case of Swarm) as well as the number and status of your containers, the number and total size of images, the number of volumes, and the number of existing networks.

If you’re looking for general information on the Docker Engine, select the Docker tab from the menu on the left.

portainer docker engine

Using the same menu, you can manage the main building blocks comprising any Docker environment: containers, images, networks, and volumes.

For example, selecting Images gives you a list of all the images pulled. You can see their Id, tag, total size, and the date that they were created.

list of docker images pulled

The great thing about Portainer is that it allows you not only to get an overview of the environment but also to manage it. For example, if you want to pull a new image (from the Docker Hub or a different registry) or remove an existing image, you can do so from this page.

On the Containers page, you will be able to see a list of all your containers. Selecting a container will give you all the details about the selected container including its status, network, and port configuration as well as the option to build an image from the container. You can even open a terminal with bash into the container.

open terminal to run container

An interesting feature is the ability to run new containers based on ready-made Portainer templates. Select App Templates from the menu, choose which template to use, configure the container name and port mapping, and create (or run) your container.

portainer app templates

Logging Containers

From a logging perspective, Portainer gives visibility into resources that would otherwise be harder to access.

As explained in this post, one of the reasons it’s so challenging to log Docker environments is their multi-layered nature. There are various metrics and logs to measure such as the stdout and stderr output of a container, Docker container statistics, and Docker daemon events.

While Portainer does not offer a way to get a comprehensive and centralized view of these three types, it does allow you to easily access the three data streams.

To see container logs, for example, you need to select one of the containers on the Containers page and then click Logs. As you can see below, you get a nice view of the stdout and stderr output:

stdout stderr output

The same goes for Docker stats. It’s worth noting that the data is refreshed upon page load, so there is no data retention:

portainer data retention

Docker events (Docker daemon “admin” actions such as kill, attach, restart, and die) can be viewed on the Events page.

Summing It Up

Portainer fills in an extremely empty void in the Docker world by wrapping up the Docker API with a pretty, intuitive, and easy-to-use UI.

From a logging perspective, though, there is much that is missing such as the very basic ability to query the logs to the more advanced function of visualizing them and being able to build a comprehensive monitoring dashboard.

But that’s OK. Portainer does not claim to be a logging solution for Docker, and it is excellent at what it does claim to be — “an open-source, lightweight management UI which allows you to easily manage your Docker host or Swarm cluster.”

As such, it’s well worth checking out.

I also recommend reading this article as the author, Russ Mckendrick, explores the integration of Portainer with Docker Swarm as well as this note on Reddit by Portainer CEO Neil Cresswell.

Logz.io is an AI-powered log analysis platform that offers the open source ELK Stack as a cloud service with machine learning technology and can be used for log analysis, IT infrastructure and application monitoring, business intelligence, and more. Start your free trial today!

Daniel Berman is Product Evangelist at Logz.io. He is passionate about log analytics, big data, cloud, and family and loves running, Liverpool FC, and writing about disruptive tech stuff.

Securing Elasticsearch Clusters Following the Recent Ransom Attacks

$
0
0

securing elasticsearch clusters

If you’re an ELK user, there is little chance that you missed the news about the recent ransom attacks on Elasticsearch clusters. Following similar attacks on MongoDB, it seems that it is open season on open source datastores. This most recent attack on Elasticsearch clusters are leaving hundreds if not thousands of indices empty and a demand for payment in bitcoins for recovering the data.

This is what victims of the attack have been seeing in their Elasticsearch clusters:

Note: “SEND 0.2 BTC TO THIS WALLET: 1DAsGY4Kt1a4LCTPMH5vm5PqX32eZmot4r IF YOU WANT RECOVER YOUR DATABASE! SEND TO THIS EMAIL YOUR SERVER IP AFTER SENDING THE BITCOINS p1l4t0s@sigaint.org”

Yep, that’s what kidnapping for ransom looks like in 2017.

Logz.io provides ELK as a service, so we put a huge focus on security. In fact, that is why we received SOC-2 and ISO-27001 compliance certifications. Our entire architecture was designed and continues to be developed with security in mind. For some of the measures we put in place, take a look here.

A number of articles have been written over the past few days documenting the various methods of securing Elasticsearch, most notably of which is this piece by Itamar Dyn-Hershko. For all our readers using Elasticsearch — especially those who are using it in production — who are not necessarily aware of the various pitfalls that need to be taken into consideration, we’ve summed up some of the methods that we recommend employing.

The good news is that with these tweaks, you can make your data safer and more immune to attacks:

  1. Do not expose Elasticsearch to the Internet. There is a reason why the default Elasticsearch configuration binds nodes to localhost. Within the “yml” configuration file, there is a directive called “network.host” that you can use to bind the nodes in your cluster to private IPs or secure public IPs.
  2. Add authentication to Elasticsearch. Use a proxy server such as NGINX to act as a security buffer between Elasticsearch and any client that you use to access your data. This will enable you to add user control to Kibana or authorization to the REST API. Of course, there are paid options as well such as hosted ELK solutions or Elastic’s Shield plugin.
  3. Use the latest Elasticsearch version. This is more of a general best practice since in older versions, there were specific vulnerabilities that were taken care of in versions 5.x. If you are still using 1.x or 2.x, be sure to disable dynamic scripting. Elasticsearch allows the use of scripts to evaluate custom expressions, but as documented by Elastic, using non-sandboxed languages can be an issue.
  4. Back up your data! If your cluster does get compromised, make sure you have a failsafe mechanism in place to be able to easily restore your data. Again, there are paid solutions for this, but you can easily use the snapshot API to backup the data on an AWS S3 bucket for example or a shared filesystem.
  5. Don’t expose Elasticsearch to the Internet! Yes, this is a repeat of the first tip — and I’m repeating it to emphasize the point. Even in development and testing, there is no reason to have your clusters exposed to public IPs. Just in case you’re not fully convinced, check out this site that lists all the open Elasticsearch clusters across the globe.

As I wrote earlier, security is one of the main challenges that people running ELK on their own need to come to terms with. Understanding the various vulnerabilities is the first step to resolution, and the next is to decide what your priorities are. Using a hosted ELK solution or paying for a plugin that adds security to your stack should not be ruled out as an option.

Daniel Berman is Product Evangelist at Logz.io. He is passionate about log analytics, big data, cloud, and family and loves running, Liverpool FC, and writing about disruptive tech stuff.

A Beginner’s Guide to Elasticsearch Plugins

$
0
0

elasticsearch plugins

Elasticsearch plugins are used to extend the basic Elasticsearch functionality in various, specific ways. There are types, for example, that add security functionality, discovery mechanisms, and analysis capabilities to Elasticsearch.

This post provides some basic tips and tricks on working with Elasticsearch plugins from how to install them to management best practices.

Installing Elasticsearch Plugins

Regardless of what functionalities they add, Elasticsearch plugins belong to either of the following two categories: core plugins or community plugins. The former are supplied as part of the Elasticsearch package and are maintained by the Elastic team while the latter are developed by the community and are thus separate entities with their own versioning and development cycles.

Installing core plugins is simple. In the example below, I’m going to install the X-Pack plugin. X-Pack extends Elasticsearch by plugging in Shield, Watcher, and Marvel — three plugins that prior to Elasticsearch 5.x were separate entities, each requiring separate installation and setup (commands apply to DEB/RPM installation):

cd /usr/share/elasticsearch

sudo bin/elasticsearch-plugin install x-pack

Please note that in the case of the X-Pack Elasticsearch plugin, you will need to compliment this step by installing the X-Pack plugin for Kibana as well (if it’s X-Pack you’re interested in, Elastic’s docs detail everything you need to know about setting it up).

Plugins must be installed on every node in the cluster, and each node must be restarted after installation.

Community plugins are a bit different as each of them has different installation instructions.

Some community plugins are installed the same way as core plugins but require additional Elasticsearch configuration steps.

Other community plugins are meant for integration with third-party tools. The New Relic plugin, for example, helps to monitor Elasticsearch instances using New Relic. There are countless of similar plugins and integrations out there, and how or if you use them depends, of course, on your needs.

Managing the Plugins

Here are some additional commands to use to manage your Elasticsearch plugins (commands apply to DEB/RPM installation):

Listing all loaded plugins

cd /usr/share/elasticsearch

sudo bin/elasticsearch-plugin list

Removing a plugin

cd /usr/share/elasticsearch

sudo bin/elasticsearch-plugin remove [plugin]

Add mandatory dependencies for plugins

Elasticsearch also allows you to define a dependency for a specific plugin, ensuring that a node will not start if the plugin is missing. To add the dependency, add the following setting to the ‘elasticsearch.yml’ file:

plugin.mandatory:[plugin]

Elasticsearch Site Plugins

A number of community plugins add graphical front-ends to Elasticsearch.

Called “site plugins,” these extensions allow users to write JavaScript applications that can be used for monitoring and managing your Elasticsearch clusters and indices — an aspect that many in the community feel is missing in Elasticsearch as bundled out-of-the-box.

The most popular site plugins are Head, Bigdesk, HQ and Hopf. All provide the same functionality more or less — providing a nice overview of your Elasticsearch cluster, indices and documents. Some include additional utilities such as a data browser for building Elasticsearch queries.

It’s important to note that as of Elasticsearch 5.x, these site plugins are no longer supported due to security issues but there are workarounds for some of the plugins. (For reference, you can see our introduction to the ELK Stack 5.0 as well as our complete guide to the ELK Stack.)

Endnotes

As good as it is, Elasticsearch does not provide a full out-of-the-box experience for production cases, and plugins can be great ways to compensate for missing functionalities.

X-Pack is a good example of how plugins can be used to complement Elasticsearch by adding security and alerting layers to the basic package — but remember that unless you’re using the free tier, X-Pack comes with a cost.

In addition to X-Pack, there is also the EC2 Discovery plugin. The plugin basically uses the AWS API to discover other machines in a cluster. In large AWS deployments, this plugin is recommended instead of using multicast or manually configuring the master nodes for each data node.

Logz.io is an AI-powered log analysis platform that offers the open source ELK Stack as a cloud service with machine learning technology and can be used for log analysis, IT infrastructure and application monitoring, business intelligence, and more. Start your free trial today!

Daniel Berman is Product Evangelist at Logz.io. He is passionate about log analytics, big data, cloud, and family and loves running, Liverpool FC, and writing about disruptive tech stuff.
Viewing all 198 articles
Browse latest View live