A short guide to Kibana searches.
↧
Demystifying Kibana Searches
↧
Infrastructure Monitoring with Topbeat and the ELK Stack
In a previous post, we described how to use Packetbeat to analyze networks by monitoring metrics on web, database, and other network protocols. Another member of Elastic’s “Beats” family is Topbeat — a shipper that monitors system data and processes.
Topbeat collects data on CPU usage, memory, process statistics, and other system-related metrics that when shipped into the ELK Stack for indexing and analysis, can be used for real-time monitoring of your infrastructure.
In this post, we will describe how to monitor a basic infrastructure setup that consists of a single server (in this case, deployed on AWS) using Topbeat and the Logz.io ELK Stack. We will begin by configuring the pipeline from Topbeat into the ELK Stack and then show how to analyze and visualize the data.
Setting Up Topbeat
Our first step is to install and configure Topbeat (the full installation instructions are here):
$ curl -L -O
https://download.elastic.co/beats/topbeat/topbeat_1.2.3_amd64.deb

$ sudo dpkg -i topbeat_1.2.3_amd64.deb
Open the configuration file at /etc/topbeat/topbeat.yml:
$ sudo vim /etc/topbeat/topbeat.yml
The first section if the configuration file allows you to define how often statistics are read from your system and the specific processes to monitor. In our case, the default settings will do just fine.
Moving on, you need to define to where the data will be outputted. By default, Topbeat is configured to output the data to Elasticsearch. If you’re using a locally-installed Elasticsearch instance, this default configuration will suit you just fine:
### Elasticsearch as output
   elasticsearch:
      hosts: ["localhost:9200"]
Or, you could ship to Logstash using the default configuration in the ‘Logstash as output’ section. You will need to uncomment the relevant lines.
In our case, though, we’re going to comment out the Elasticsearch output configuration and define a file output configuration. In the File as output section, uncomment the default settings as follows:
### File as output
   file:
      path: "/tmp/topbeat"
      filename: topbeat
      rotate_every_kb: 10000
      number_of_files: 7
Next, in the Logging section, define a log file size limit that, once reached, will trigger an automatic rotation:
logging:
      files:
            rotateeverybytes: 10485760
Once done, start Topbeat:
$ sudo /etc/init.d/topbeat start
Setting Up Filebeat
As shown above, Topbeat data can be sent directly to Elasticsearch or forwarded via Logstash. Since we do not yet have a native log shipper for Topbeat, we’re going to use Filebeat to input the file exported by Topbeat into the Logz.io ELK setup (if you’re using the open source ELK Stack, you can skip this step).
First, download and install the Public Signing Key:
$ curl https://packages.elasticsearch.org/GPG-KEY-elasticsearch | sudo apt-key add -
Then, save the repository definition to /etc/apt/sources.list.d/beats.list:
$ echo "deb https://packages.elastic.co/beats/apt stable main" | sudo tee -a /etc/apt/sources.list.d/beats.list
Now, update the system and install Filebeat:
$ sudo apt-get update && sudo apt-get install filebeat
The next step is to download a certificate and move it to the correct location, so first run:
$ wget http://raw.githubusercontent.com/cloudflare/cfssl_trust/master/intermediate_ca/COMODORSADomainValidationSecureServerCA.crt
And then:
$ sudo mkdir -p /etc/pki/tls/certs
 $ sudo cp COMODORSADomainValidationSecureServerCA.crt /etc/pki/tls/certs/
We now need to configure Filebeat to ship our Topbeat file into Logz.io.
Open the Filebeat configuration file:
$ sudo vim /etc/filebeat/filebeat.yml
Defining the Filebeat Prospector
Prospectors are where we define the files that we want to tail. You can tail JSON files and simple text files. In our case, we’re going to define the path to our Topbeat JSON file.
Please note that when harvesting JSON files, you need to add ‘logzio_codec: json’ to the fields object. Also, the fields_under_root property must be set to ‘true.’ Be sure to enter your Logz.io token in the necessary namespace:
prospectors:
paths:
– /tmp/topbeat/*
fields:
logzio_codec: json
token: UfKqCazQjUYnBN***********************
fields_under_root: true
ignore_older: 24h
A complete list of known types is available here, and if your type is not listed there, please let us know.
Defining the Filebeat Output
Outputs are responsible for sending the data in JSON format to Logstash. In the configuration below, the Logz.io Logstash host is already defined along with the location of the certificate that you downloaded earlier and the log rotation setting:
output:
   logstash:
      # The Logstash hosts
      hosts: ["listener.logz.io:5015"]
      tls:
         # List of root certificates for HTTPS server verifications
         Certificate_authorities: ['/etc/pki/tls/certs/COMODORSADomainValidationSecureServerCA.crt']
logging:
   # To enable logging to files, to_files option has to be set to true
   files:
      # Configure log file size limit.
      rotateeverybytes: 10485760 # = 10MB
Be sure to put your Logz.io token in the required fields.
Once done, start Filebeat:
$ sudo service filebeat start
Analyzing the Data
Important note! If you’re using the open source ELK Stack, another step is necessary — loading the Topbeat index template in Elasticsearch. Since Logz.io uses dynamic mapping, this step is not necessary in our case. Please refer to Elastic’s documentation for more information.
To verify that the pipeline is up and running, access the Logz.io user interface and open the Kibana tab. After a minute or two, you should see a stream of events coming into the system.
You may be shipping other types of logs into Logz.io, so the best way to filter out the other logs is by first opening one of the messages coming in from Topbeat and filtering via the ‘source’ field.
The messages list is then filtered to show only the data outputted by Topbeat:

Start by adding some fields to the messages list. Useful fields are the ‘type’ and ‘host’ fields, especially when monitoring a multi-node environment. This will give you a slightly clearer picture of the messages coming in from Topbeat.
Next, query Elasticsearch. For example, if you’d like to focus on system data, use a field-level search to pinpoint these specific messages:
type:system
Source Types
Our next step is to visualize the data. To do this, we’re going to save the search and then select the Visualize tab in Kibana.
For starters, let’s begin with a simple pie chart that gives us a breakdown of the different source types coming into Elasticsearch from Topbeat. The configuration of this visualization looks like this:

Hit the Play button to preview the visualization:

Memory Usage Over Time
Now, let’s try to create a more advanced visualization — a new line chart that shows memory usage over time. To do this, we’re going to use the saved search for system-type messages (shown above) as the basis for the visualization.
The Y axis in this case will aggregate the average value for the ‘mem.actual_used’ field, and the X axis will aggregate by the ‘@timestamp’ field. We can also add a sub-aggregation to show data for other hosts (in this case, only one host will be displayed).
The configuration of this visualization looks like this:

And the end-result:

Per-Process Memory Consumption
Another example of a visualization that we can create is an area chart comparing the memory consumption for specific processes on our server.
The configuration of this visualization will cross-reference the average values for the ‘proc.mem.rss_p’ field (the Y axis) with a date historgram and the ‘proc.name’ field (X axis).
The configuration looks like this:

And the end-result:

Topbeat Dashboard
After saving the visualizations, it’s time to create your own personalized dashboard. To do this, select the Dashboard tab, and use the + icon in the top-right corner to add your two visualizations.
Now, If you’re using Logz.io, you can use a ready-made dashboard that will save you the time spent on creating your own set of visualizations.
Select the ELK Apps tab:

ELK Apps are free and pre-made visualizations, searches and dashboards customized for specific log types. (You can see the library directly or learn more about them.) Enter ‘Topbeat’ in the search field:

Install the Topbeat dashboard, and then open it in Kibana:

So, in just a few minutes, you can set up a monitoring system for your infrastructure with metrics on CPU, memory, and disk usage as well as per-process stats. Pretty nifty, right?
Logz.io is a predictive, cloud-based log management platform that is built on top of the open-source ELK Stack. Start your free trial today!
↧
↧
Troubleshooting 5 Common ELK Glitches
Getting started with the ELK Stack is straightforward enough and usually includes just a few commands to get all three services up and running. But — and this is big “but” — there are some common issues that can cause users some anguish.
The first piece of good news is that these issues are usually easy to resolve. The other piece of good news is that we’ve put together the top five most-common issues and explained how to troubleshoot them.
#1. Kibana is Unable to Connect to Elasticsearch
You’ve installed Elasticsearch, Logstash, and Kibana. You open the latter in your browser and get the following screen:
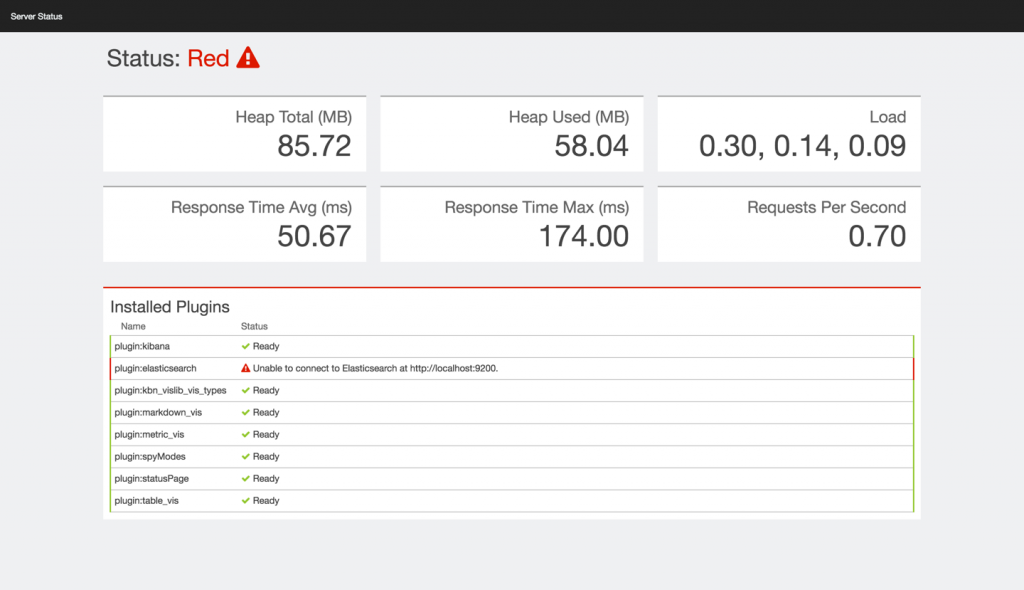
All is not lost! This is a pretty common issue, and it can be easily resolved.
As the error message implies, Kibana cannot properly establish a connection with Elasticsearch. The reasons for this vary, but it is usually a matter of defining the Elasticsearch instance correctly in the Kibana configuration file.
Open the file at /opt/kibana/config/kibana.yml and verify that the server IP and host for ‘elasticsearch_url’ are configured correctly (both the URL and port):
Here is an example for a locally-installed Elasticsearch instance:
elasticsearch_url: "http://localhost:9200"
Restart Kibana:
sudo service kibana restart
That should do it. If the problem persists, there may be an issue with Elasticsearch. Check out the Elasticsearch troubleshooting sections below.
#2. Kibana is Unable to Fetch Mapping
In this case, Kibana has established a connection with Elasticsearch but cannot fetch mapping for an index:

As the message displayed on the grey button at the bottom of the page indicates, Kibana cannot find any indices stored in Elasticsearch that match the default logstash-* pattern — the default pattern for data being fed into the system by Logstash (which is the method Kibana assumes you are using).
If you’re not using Logstash to forward the data into Elasticsearch or if you’re using a non-standard pattern in your Logstash configuration, enter the index pattern that matches the name of one or more of your Elasticsearch indices. If Kibana finds the index pattern, the grey button will turn into a pretty green one, allowing you to define the index into Kibana.
If you are using the conventional Logstash configuration to ship data, then there is most likely a communication issue. In other words, your logs aren’t making it into Elasticsearch. For some reason, either Logstash or Elasticsearch may not be running. See the sections below for more details on how to make sure that these services are running properly.
#3. Logstash is Not Running
Logstash can be a tricky component to manage and work with. We’ve previously covered a number of pitfalls you should look out for, but there are a number of reasons that Logstash still may not be running even after taking care to avoid these landmines.
A common issue causing Logstash to fail is a bad configuration. Logstash configuration files, which are located in the /etc/logstash/conf.d directory, follow strict syntax rules that, if broken, will cause a Logstash error. The best way to validate your configurations is to use the configtest parameter in the service command:
$ sudo service logstash configtest
If there’s a configuration error, it’ll show up in the output. Fix the syntax and try to run Logstash again:
$ sudo service logstash restart
Check the status of the service with:
$ sudo service logstash status
If Logstash is still not running after you fix the issue, take a look at the Logstash logs at: /var/log/logstash/logstash.log.
Read the log message and try to fix the issue as reported in the log. Here’s an example of a log message warning us of a deprecated host configuration:
{:timestamp=>"2016-05-30T08:10:42.303000+0000", :message=>"Error: The setting `host` in plugin `elasticsearch` is obsolete and is no longer available. Please use the 'hosts' setting instead. You can specify multiple entries separated by comma in 'host:port' format. If you have any questions about this, you are invited to visit https://discuss.elastic.co/c/logstash and ask.", :level=>:error}As the message itself points out, use the Elastic forums to search for an answer to the particular issue you’ve encountered and as reported in the log.
#4 Logstash is Not Shipping Data
You’ve got Logstash purring like a cat, but there is no data being shipped into Elasticsearch.
The prime suspect in this case is Elasticsearch, which may not be running for some reason or other. You can verify this by running the following cURL:
$ curl 'http://localhost:9200'
You should see the following output in your terminal:
{

 "name" : "Jebediah Guthrie",

 "cluster_name" : "elasticsearch",

 "version" : {

   "number" : "2.3.1",

   "build_hash" : "bd980929010aef404e7cb0843e61d0665269fc39",

   "build_timestamp" : "2016-04-04T12:25:05Z",

   "build_snapshot" : false,

   "lucene_version" : "5.5.0"

 },

 "tagline" : "You Know, for Search"

}
If Elasticsearch is still not shipping data, skip over to the Elasticsearch troubleshooting section below for more reasons why Elasticsearch might not be running properly.
Another common issue that may be causing this error is a bad output configuration in the Logstash configuration file. Open the configuration file at: /etc/logstash/conf.d/xxx.conf and verify that the Elasticsearch host is configured correctly:
output {
  elasticsearch {}
 }
Restart Logstash:
$ sudo service logstash restart
#5 Elasticsearch is Not Running
How do you know Elasticsearch is not running? There are a number of indicators, and the most obvious one is that no no logs are appearing in Kibana. As specified above, the most reliable way to ping the Elasticsearch service is by cURLing it:
$ curl 'http://localhost:9200'
If all is well, you should see the following output in your terminal:
{

 "name" : "Jebediah Guthrie",

 "cluster_name" : "elasticsearch",

 "version" : {

   "number" : "2.3.1",

   "build_hash" : "bd980929010aef404e7cb0843e61d0665269fc39",

   "build_timestamp" : "2016-04-04T12:25:05Z",

   "build_snapshot" : false,

   "lucene_version" : "5.5.0"

 },

 "tagline" : "You Know, for Search"

}
If not, the output will look like this:
curl: (7) Failed to connect to localhost port 9200: Connection refused
Now, there are a number of possible reasons Elasticsearch is not running.
First, if you just installed Elasticsearch, you need to manually start the service because it is not started automatically upon installation:
$ sudo service elasticsearch start
 * elasticsearch is running
If you still get a message that Elasticsearch is not running, you will have to dig in deeper. As with Logstash, the best place to try and debug the service is the log file: /var/log/elasticsearch/elasticsearch.log.
A common cause for a failing Elasticsearch is a bad host definition in the configuration file. Live tailing of the log file while starting the service is a good method for identifying a specific error. Here is an example:
2016-05-30 07:40:36,799][ERROR][bootstrap] [Condor] Exception BindTransportException[Failed to bind to [9300-9400]]; nested: ChannelException[Failed to bind to: /192.0.0.1:9400]; nested: BindException[Cannot assign requested address];
The host configuration is located in the Network section of the Elasticsearch configuration file, and it should look like this:
//When Kibana and Elasticsearch are hosted on the same machine
 network.host: localhost
 http.port: 9200

//When Kibana and Elasticsearch are hosted on different machines

network.bind_host: 0.0.0.0
 http.port: 9200
 network.publish_host: <ServerIP>
Verify the configuration, and restart the service:
$ sudo service elasticsearch restart
If the issue is not the host definition, the log will give you an indication as to the cause of the error and will help you resolve it. Search the Elastic forums — the chances are that someone else has encountered the issue before.
And one last tip (on Ubuntu only): If you had Elasticsearch working properly and it suddenly it stopped, this might be due to a restart of your server as Elasticsearch is not configured to start on boot. To change this, you can use:
$ sudo update-rc.d elasticsearch defaults 95 10
A Final Note
Here at Logz.io, we’ve had a lot of experience with troubleshooting the various quirks in the ELK Stack. This article covered some common and basic setup issues that newcomers to the system might encounter. More advanced tips can be found in these Elasticsearch and Logstash cheatsheets.
Happy indexing!
Logz.io is a predictive, cloud-based log management platform that is built on top of the open-source ELK Stack. Start your free trial today!
↧
7 DockerCon Speakers Pick the Top Sessions You Shouldn’t Miss

The speed in which Docker and container technology have become an integral part of application development and deployment is remarkable. While Docker is young (it recently celebrated it’s third birthday), and many still question its suitability for production and the enterprise, its high adoption rate, countless large production use cases, and soaring popularity all point to a bright future.
These trends will culminate next week at DockerCon 2016 as thousands will flock to Seattle to hear about the latest Docker developments and learn from users about their Docker stories.
With so many great sessions and activities taking place, it’s will be tough to select where it will be best to invest your time. So, we asked some of our favorite DockerCon speakers to tell us what session they’re looking forward to most of all (and be sure to check out the sessions they are giving as well, we selected them for a reason!). Click on the links in their names to follow their thoughts on Twitter!
![robert mcfrazier]() #1 Robert McFrazier, Solutions Engineer at Google
#1 Robert McFrazier, Solutions Engineer at Google

Robert’s session at DockerCon is: Making it Easier to Contribute to Open Source Projects using Docker Containers
His pick is:
Docker for Mac and Windows
Docker for Mac and Windows were released in beta in March, and provide lots of new features that users have been clamouring for including: file system notifications, simpler file sharing, and no Virtualbox hassles.
During this talk, I will give the inside guide to how these products work. We will look at all the major components and how they fit together to make up the product. This includes a technical deep dive covering the hypervisors for OSX and Windows, the custom file sharing code, the networking, the embedded Alpine Linux distribution, and more.
Speaker: Justin Cormack, Engineer, Docker
Monday June 20, 2016 2:55pm – 3:40pm
Ballroom 6C
Why Robert recommends this session:
“Mac and Windows are probably the two most popular environments for Docker containers development. Looking forward to hearing how Docker works and finding new tips/tricks for Docker on these operating systems.”
![laura frank]() #2 Laura Frank, Software Engineer at Codeship
#2 Laura Frank, Software Engineer at Codeship

Laura will be giving two talks at DockerCon: Curated Birds of the Feather and Efficient Parallel Testing with Docker.
Her first pick for DockerCon is:
Containerd: Building a Container Supervisor
Containerd is a container supervisor that allows users to manage the lifecycle of a container as well as interact with the container while it is executing. Containerd was built to fulfill many of the requirements that we expect from a modern supervisor all while staying small and fast. In this talk, we will discuss some of the design decisions that shaped containerd’s architecture that allows it to reattach to running containers if it was killed and how it is designed to start 100s containers in seconds.
Speaker: Michael Crosby, Engineer, Docker
Monday June 20, 2016 4:25pm – 5:10pm
Ballroom 6C
Why Laura recommends this session:
“If you want to get further into the guts of containerization and see the direction that Docker is heading in, you can’t miss this talk. I’ll be in the front row, holding up a giant “I’m a Contai-Nerd” sign.”
Her second pick is:
Docker for Mac and Windows
Docker for Mac and Windows were released in beta in March, and provide lots of new features that users have been clamouring for including: file system notifications, simpler file sharing, and no Virtualbox hassles.
During this talk, I will give the inside guide to how these products work. We will look at all the major components and how they fit together to make up the product. This includes a technical deep dive covering the hypervisors for OSX and Windows, the custom file sharing code, the networking, the embedded Alpine Linux distribution, and more.
Speaker: Justin Cormack, Engineer, Docker
Monday June 20, 2016 2:55pm – 3:40pm
Ballroom 6C
Why Laura recommends this session:
“Running Docker on non-Linux systems has been getting easier over the last year with the introduction of Docker Toolbox. But sometimes, the performance of VirtualBox stood in the way of productivity. Docker for Mac and Windows promises to ease a lot of the pain points associated with Docker Toolbox and VirtualBox, and I’m super jazzed to hear all the nerdy technical details. I also majorly love Alpine Linux, so I’m glad it’s getting a lot of attention from Docker.”
Her third pick:
The Dockerfile Explosion and the Need for Higher Level Tools
Dockerfiles are great. They provide a zero-barrier-to-entry format for describing a single Docker image which is immediately clear to anyone reading them. But with that simplicity comes problems that become apparent as your adoption of Docker gathers pace.
- Dockerfiles can inherit from other docker images, but images are not Dockerfiles
- Dockerfile provides no built-in mechanism for creating abstractions, so as usage grows identical or similar instructions can be duplicated across many files
- The Docker APi exposes a build endpoint, but the API is very course, taking Dockerfile as the transport rather than exposing the individual instructions
- Dockerfiles are just that, files. So they can come from anywhere
The one layer per line in a Dockerfile limitation can lead to an explosion of layers, which fail to take advantage of the promised space and performance benefits.
Speaker: Gareth Rushgrove, Senior Software Engineer, Puppet Labs
Monday June 20, 2016 2:55pm – 3:40pm
Ballroom 6A
Why Laura recommends this session:
“Optimizing Dockerfiles is a casual hobby mine, but I realize most people don’t share that passion. Learning how to write your Dockerfiles to take advantage of caching, determining whether to use ADD or COPY, and discovering other ways to trim down the size of your Docker images may seem like an insurmountable task, but this talk promises lots of practical and actionable advice.”
![andrey sibiryov]() #3 Andrey Sibiryov, Sr. Infrastructure Engineer at Uber
#3 Andrey Sibiryov, Sr. Infrastructure Engineer at Uber

Andrey’s session at DockerCon is: Sharding Containers: Make Go Apps Computer-Friendly Again
His first pick is:
Microservices + Events + Docker = A Perfect Trio
Microservices are an essential enabler of agility but developing and deploying them is a challenge. In order for microservices to be loosely coupled, each service must have its own datastore. This makes it difficult to maintain data consistency across services.
Deploying microservices is also a complex problem since an application typically consists of 10s or 100s of services, written in a variety of languages and frameworks.
In this presentation, you will learn how to solve these problems by using an event-driven architecture to maintain data consistency and by using Docker to simplify deployment.
Speaker: Chris Richardson, Founder, Eventuate
Monday June 20, 2016 2:00pm – 2:45pm
Ballroom 6A
Why Andrey recommends this session:
“I think that event-sourced systems can be one of the next big things in the SoA & microservices world so I want to attend this one to see the overall direction.”
His second pick is:
The Golden Ticket: Docker and High-Security Microservices
True microservices are more than simply bolting a REST interface on your legacy application, packing it in a Docker container and hoping for the best. Security is a key component when designing and building out any new architecture, and it must be considered from top to bottom. Umpa Lumpas might not be considered “real” microservices, but Willy Wonka still has them locked down tight!
In this talk, Aaron will briefly touch on the idea and security benefits of microservices before diving into practical and real world examples of creating a secure microservices architecture. We’ll start with designing and building high security Docker containers, using and examining the latest security features in Docker (such as User Namespaces and seccomp-bpf) as well as examine some typically forgotten security principals. Aaron will end on exploring related challenges and solutions in the areas of network security, secrets management and application hardening. Finally, while this talk is geared towards Microservices, it should prove informational for all Docker users, building a PaaS or otherwise.
Speaker: Aaron Grattafiori, Technical Director, NCC Group
Monday June 20, 2016 5:20pm – 6:05pm
Ballroom 6C
Why Andrey recommends this session:
“There were many security-related innovations around Docker in the past year and I missed it all – this is a great opportunity to catch up.”
His third pick is:
Unikernels and Docker: From Revolution to Evolution
Unikernels are a growing technology that augment existing virtual machine and container deployments with compact, single-purpose appliances. Two main flavors exist: clean-slate unikernels, which are often language specific, such as MirageOS (OCaml) and HaLVM (Haskell), and more evolutionary unikernels that leverage existing OS technology recreated in library form, notably Rump Kernel used to build Rumprun unikernels.
To date, these have been something of a specialist’s game: promising technology that requires considerable effort and expertise to actually deploy. After a brief introduction for newcomers to unikernels, Mindy will demonstrate the great strides that have been taken recently to integrate unikernels with existing deployments. Specifically, we will show various ways in which Rumprun and MirageOS unikernels can be used to deploy a LAMP stack, all managed using the popular Docker toolchain (Docker build, Docker run, and the Docker Hub). The result is unikernels that can be used to augment and evolve existing Linux container- and VM-based deployments, one microservice at a time. We no longer need a revolution—welcome to the microservice evolution!
Speaker: Mindy Preston, Software Engineer, Docker
Tuesday June 21, 2016 2:25pm – 3:10pm
Ballroom 6C
Why Andrey recommends this session:
“Unikernels are probably still the most controversial and at the same time super-exciting topic at the bleeding edge of modern infrastructure. Definitely worth attending.”
![anna ossowski]() #4 Anna Ossowski, Community Manager at Eldarion
#4 Anna Ossowski, Community Manager at Eldarion

Anna will be giving this session at DockerCon: Be(com) a Mentor! Help Others Succeed and will participate in this panel: Open Source and Burnout – How Can We as a Community Help?
Anna’s first pick for DockerCon is:
Making it Easier to Contribute to Open Source Projects using Docker Containers
Making it easy to contribute to open source project using Docker containers, by lowering the system admin required to get started. Also making it easy “try” out new technology.
Speaker: Robert McFrazier, Solution Engineer, Google
Monday June 20, 2016 4:25pm – 5:10pm
Room 609
Why Anna recommends this session:
“I’m an advocate for new open source contributors and I look forward to hearing Robert’s ideas on how to break down some of the contribution barriers that old and new open source contributors have to face sometimes and how we can make it easier for them to contribute to open source using Docker containers.”
Her second pick is:
Open Source is Good for Both Business and Humanity
Sharing and collaborating on source code started decades ago but has increased remarkably the past twenty years. We’ve seen a large increase in better software, better solutions and better code.
Learn why that happened, and how organizations, companies and humanity is benefiting from Open Source.
Speaker: Jonas Rosland, Developer Advocate, EMC {code}
Tuesday June 21, 2016 11:15am – 12:00pm
Room 609
Why Anna recommends this session:
“I look forward to learning about the history and progress of open source and open source collaboration, learning about the reasons for this process, and finding out more about how companies benefit from open source from Jonas’s perspective.”
Her third pick is:
Making Friendly Microservices
Small is the new big, and for good reason. The benefits of microservices and service-oriented architecture have been extolled for a number of years, yet many forge ahead without thinking of the impact the users of the services. Consuming on micro services can be enjoyable as long as the developer experience has been crafted as finely as the service itself. But just like with any other product, there isn’t a single kind of consumer. Together we will walk through some typical kinds of consumers, what their needs are, and how we can create a great developer experience using brains and tools like Docker.
Speaker: Michele Titolo, Lead Software Engineer, Capital One
Tuesday June 21, 2016 1:30pm – 2:15pm
Ballroom 6A
Why Anna recommends this session:
“I don’t know much about microservices yet and would love to learn more about them. I also look forward to learning about different kinds of consumers from Michele and finding out more about her approach of making the process of developing microservices friendly, both for the consumer and the developer.”
![chris richardson]() #6 Chris Richardson, Founder at Eventuate.io
#6 Chris Richardson, Founder at Eventuate.io

Chris’ session at DockerCon is: Microservices + Events + Docker = A Perfect Trio.
His pick:
Thinking Inside the Container: A Continuous Delivery Story
Riot builds a lot of software. At the start of 2015 we were looking at 3000 build jobs over a hundred different applications and dozens of teams. We were handling nearly 750 jobs per hour and our build infrastructure needed to grow rapidly to meet demand. We needed to give teams total control of the “stack” used to build their applications and we needed a solution that enabled agile delivery to our players. On top of that, we needed a scalable system that would allow a team of four engineers to support over 250.
After as few explorations, we built an integrated Docker solution using Jenkins that accepts docker images submitted as build environments by engineers around the company . Our “containerized” farm now creates over 10,000 containers a week and handles nearly 1000 jobs at a rate of about 100 jobs an hour.
In this occasionally technical talk, we’ll explore the decisions that led Riot to consider Docker, the evolutionary stages of our build infrastructure, and how the open source and in-house software we combined to achieve our goals at scale. You’ll come away with some best practices, plenty of lessons learned, and insight into some of the more unique aspects of our system (like automated testing of submitted build environments, or testing node.js apps in containers with Chromium and xvfb).
Speaker: Maxfield Stewart, Engineering Manager, Riot Games
Monday June 20, 2016 2:55pm – 3:40pm
Ballroom 6B
![michele titolo]() #7 Michelle Titolo, Lead Software Engineer at Capital One
#7 Michelle Titolo, Lead Software Engineer at Capital One

Michelle’s session at DockerCon is: Making Friendly Microservices
Her first pick:
The Golden Ticket: Docker and High Security Microservices
True microservices are more than simply bolting a REST interface on your legacy application, packing it in a Docker container and hoping for the best. Security is a key component when designing and building out any new architecture, and it must be considered from top to bottom. Umpa Lumpas might not be considered “real” microservices, but Willy Wonka still has them locked down tight!
In this talk, Aaron will briefly touch on the idea and security benefits of microservices before diving into practical and real world examples of creating a secure microservices architecture. We’ll start with designing and building high security Docker containers, using and examining the latest security features in Docker (such as User Namespaces and seccomp-bpf) as well as examine some typically forgotten security principals. Aaron will end on exploring related challenges and solutions in the areas of network security, secrets management and application hardening. Finally, while this talk is geared towards Microservices, it should prove informational for all Docker users, building a PaaS or otherwise.
Speaker: Aaron Grattafiori, Technical Director, NCC Group
Monday June 20, 2016 5:20pm – 6:05pm
Ballroom 6C
Why Michelle recommends this session:
“I’m interested in learning more related to secure containers and microservices.”
Her second pick:
Be(come) a Mentor! Help Others Succeed
There is always something new to learn in technology. We are always experts in one and beginners in another field. In order to learn successfully it’s important to have a mentor but it’s equally important to learn how to be a good mentor. In my talk we’ll explore what a mentor is, why we should all be(come) mentors, tips and tricks of mentorship, and concrete ways you can get involved as a mentor.
There will be some Star Wars, too!
Speaker: Anna Ossowski, Community Manager, Eldarion
Monday June 20, 2016 5:20pm – 6:05pm
Room 609

Why Michelle recommends this session:
“I love hearing about other people’s strategies for mentoring, since it’s so imperative to being an effective leader and engineer.”
If you’re attending DockerCon, be sure to drop by Booth E5 to get a demo on how Logz.io provides the ELK Stack as an end-to-end enterprise-grade service!
↧
5 Docker Monitoring Solutions on Show at DockerCon 2016
SEATTLE, Washington — Docker is being used in more and more production deployments. As such, the ecosystem surrounding Docker is picking up the gauntlet by creating more and more solutions for monitoring — which is crucial for keeping tabs on a Dockerized environment and gaining visibility into the state and health of containers.
With so many platforms available, it’s tough to tell the difference. Nothing exemplifies this than DockerCon 2016. While walking through the Expo Hall yesterday, I counted at least ten companies professing to do Docker monitoring on some level or another. I decided to see how five of these companies differentiated themselves from their competitors by interviewing their representatives.
Here is what I found.
Dynatrace

Dynatrace offers a powerful solution for Docker monitoring by providing users with high-level metrics that are crucial from a business perspective together with extremely detailed insights on containerized services.
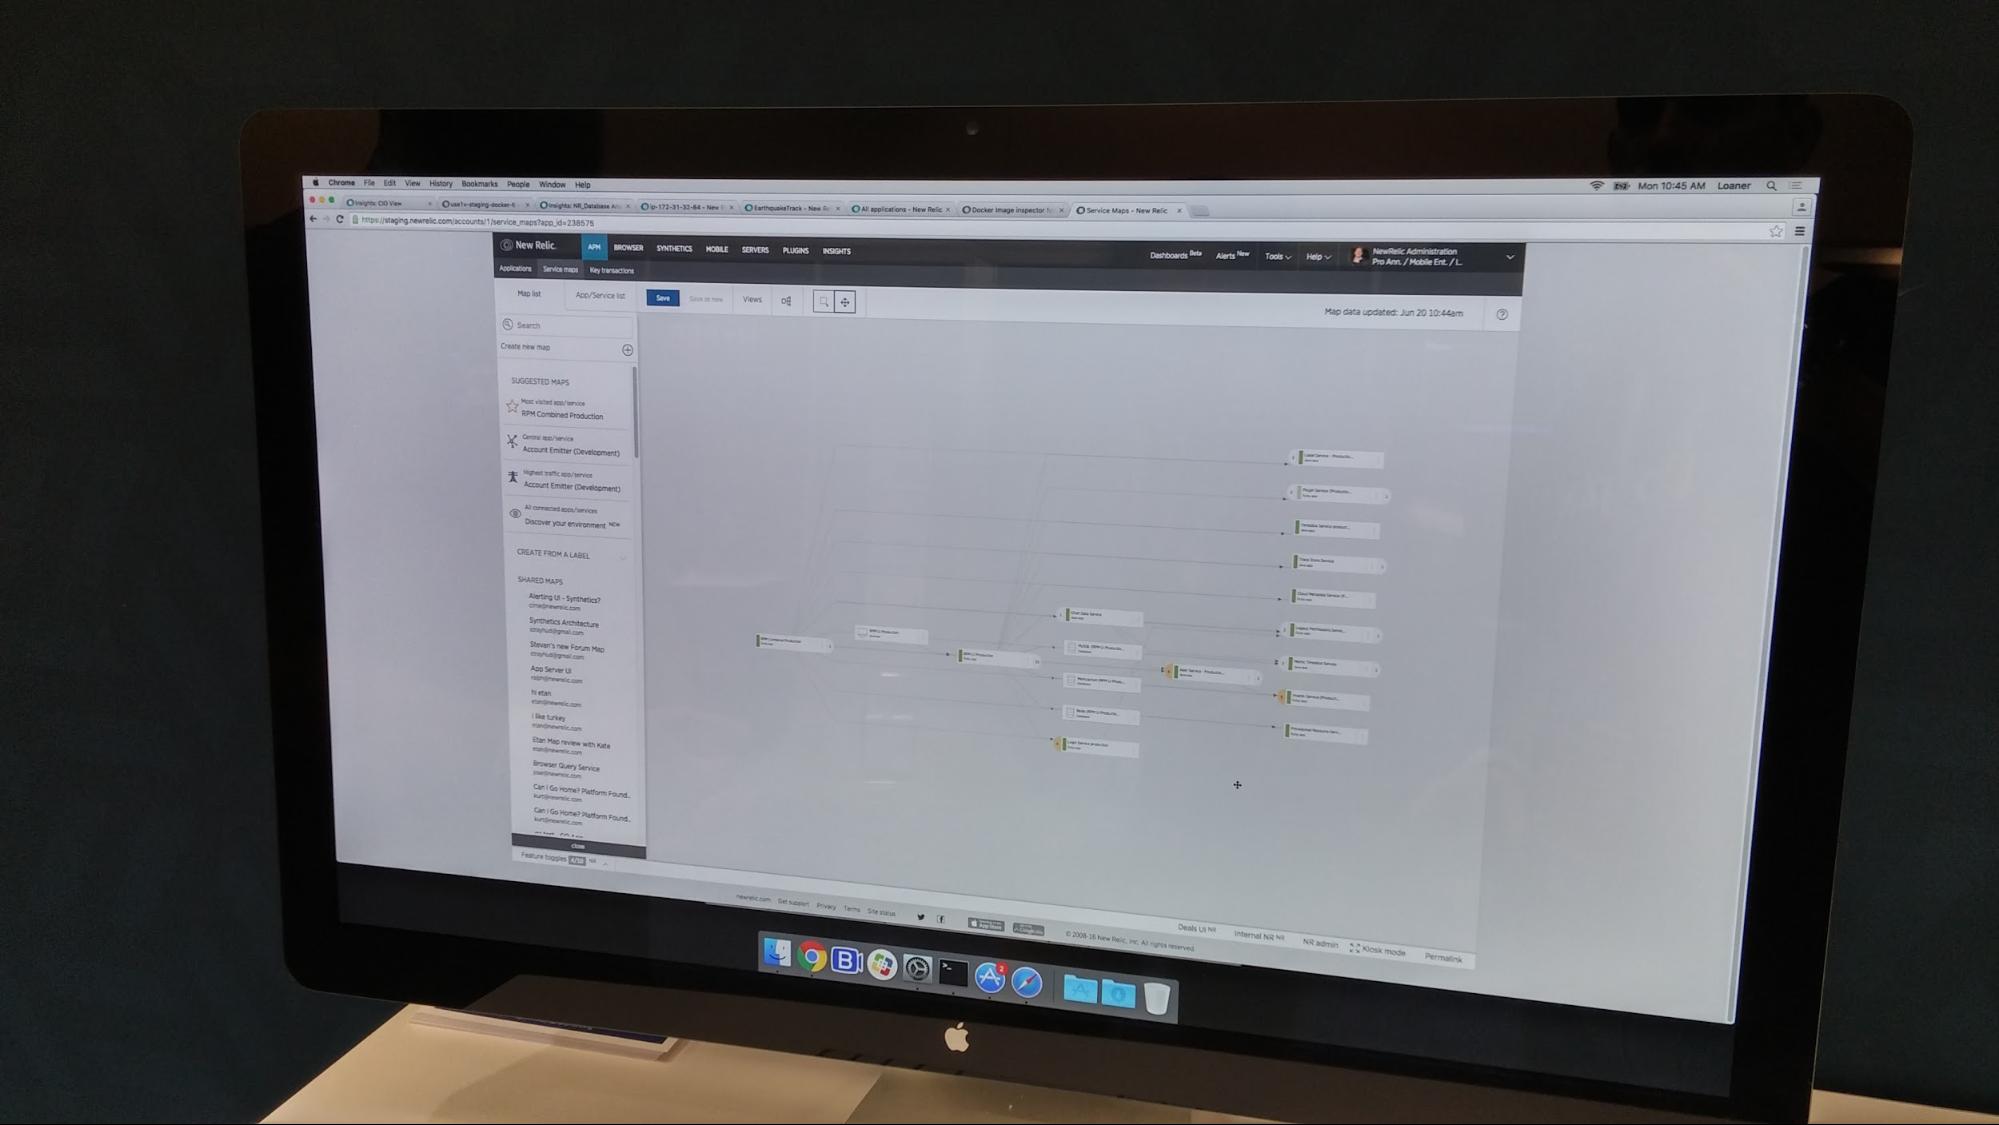
Docker users will see information that is specific to images and containers such as the numbers of images being used, running containers, and per-microservice metrics. Dynatrace’s Smartscape feature shows a map of what component in your stack relies on what — helping you to understand the relationships between all the different layers (including your Docker containers themselves).
I spoke with Pawel Brzoska, a member of Dynatrace’s product management team, who pointed out that as opposed to other Docker monitoring tools, his company focuses on metrics that are generated on the client-side as well: “Our focus is on measuring user-experience as well, so we explore whether the actual users of the application are happy by measuring metrics on the client-side such as page load.
Datadog
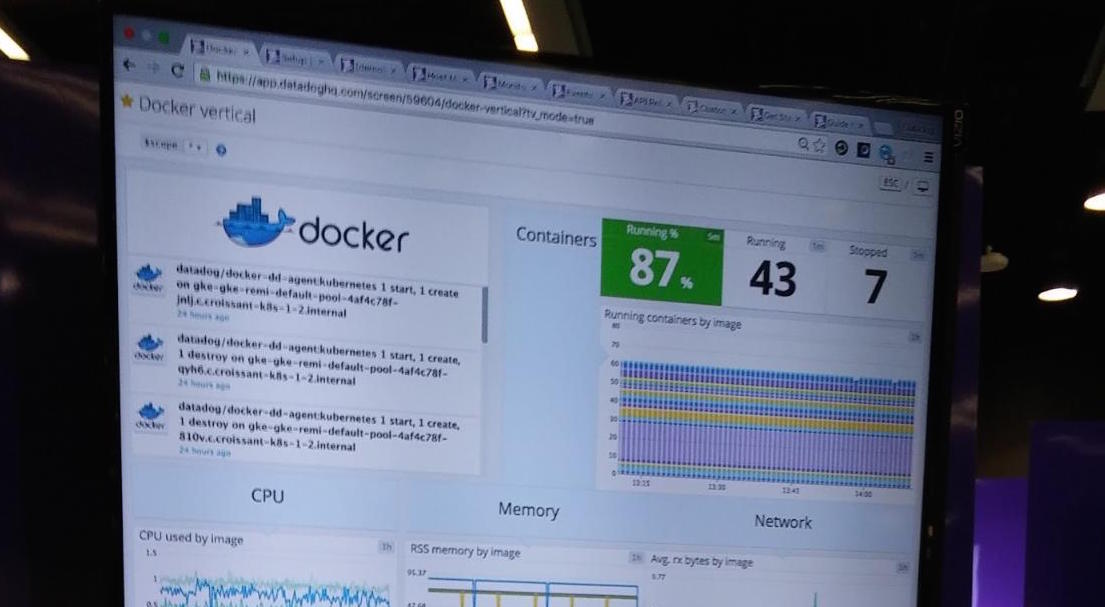
Datadog is a cloud-based solution that monitors the infrastructure behind your applications, tracking metrics and events that shipped via agents, APIs, or even third-party tools (including some of the other monitoring tools listed here) from databases, configuration management tools, cloud services, and, yes, Docker. Good guess.
For Docker environments, Datadog supplies an agent that can be either installed or run as a container on your host. The agent connects via the Docker socket and aggregates docker-stats data, which can be analyzed using a dedicated dashboard and sliced and diced per container.
At DockerCon, a new feature called “Service Discovery” was announced that enables Datadog to identify the type of containers running on the host and the ports being assigned to it automatically.
Datadog’s strengths are both the ability to combine data from various inputs and the integrations it has with Docker orchestration and management tools such as Kubernetes, Mesos, and Swarm. Ilan Rabinovitch, Director of Technical Community at Datadog, agrees: “Strong integrations with Kubernetes and Swarm are tighter than others in this specific space. Due to the dynamic nature of the cloud and the realm of microservices, what is important is the ability to combine data sources and data types.”
SignalFx
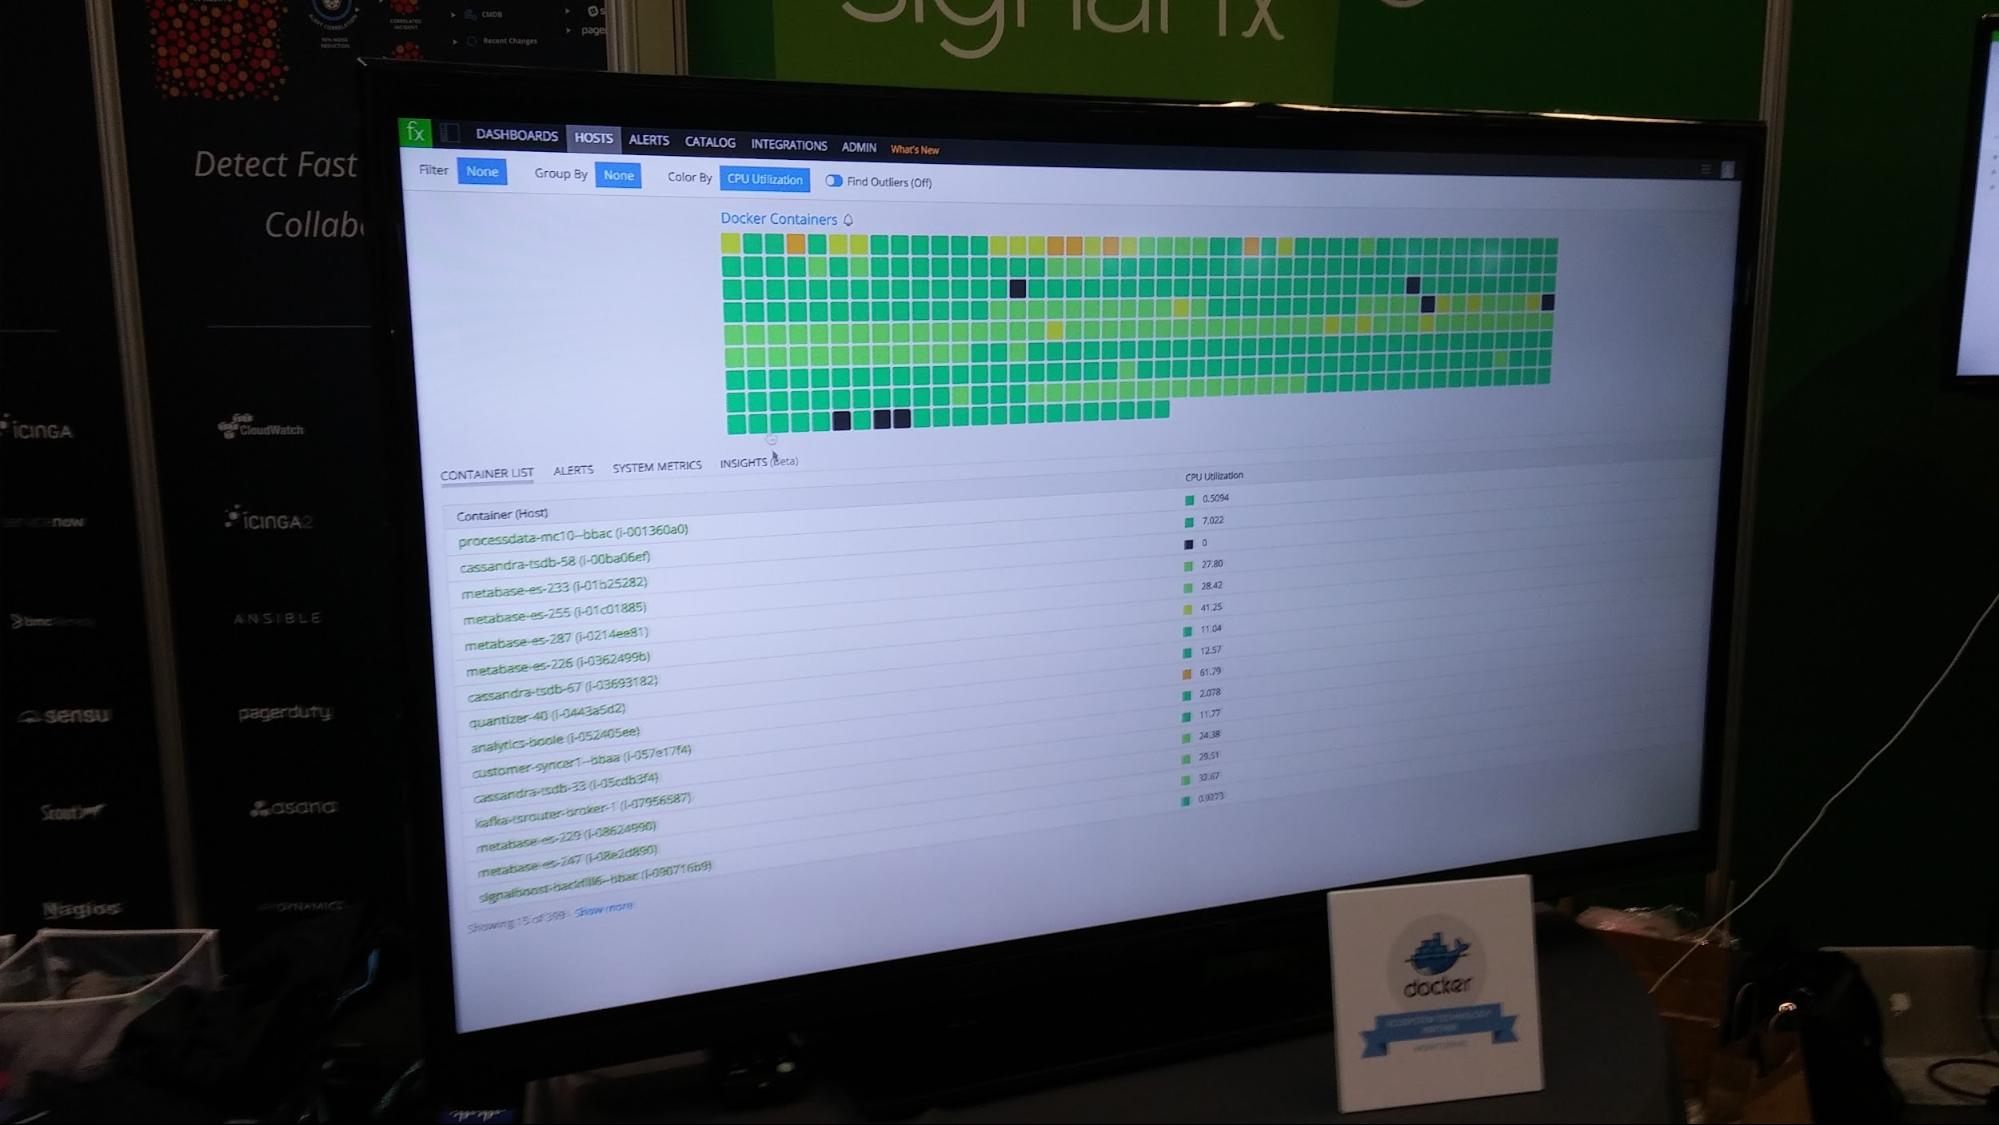
SignalFx has a very interesting story to tell, based on the number of open source technologies that have been deployed on Docker in production since 2013. I chatted with software engineer Maxime Petazzoni, who was very clear on the value he sees SignalFx bringing to the table.
SignalFx allows users to perform advanced diagnostics using built-in computations and functions for real-time analysis and with extremely low latency. Real-time was indeed real-time — seeing the needles in their monitoring dashboards move every second was impressive.
SignalFx provides a number of dashboards for Docker including a per-host dashboard and a general dashboard showing data on all of the containers across hosts, making it relatively simple to drill down and troubleshoot a problematic container.
So, the value here is clear. As Maxime puts it: “As a software engineer, I see the benefit when a system can perform this kind of computation for monitoring modern applications across different time series with extremely low latency and in real-time.”
Sysdig
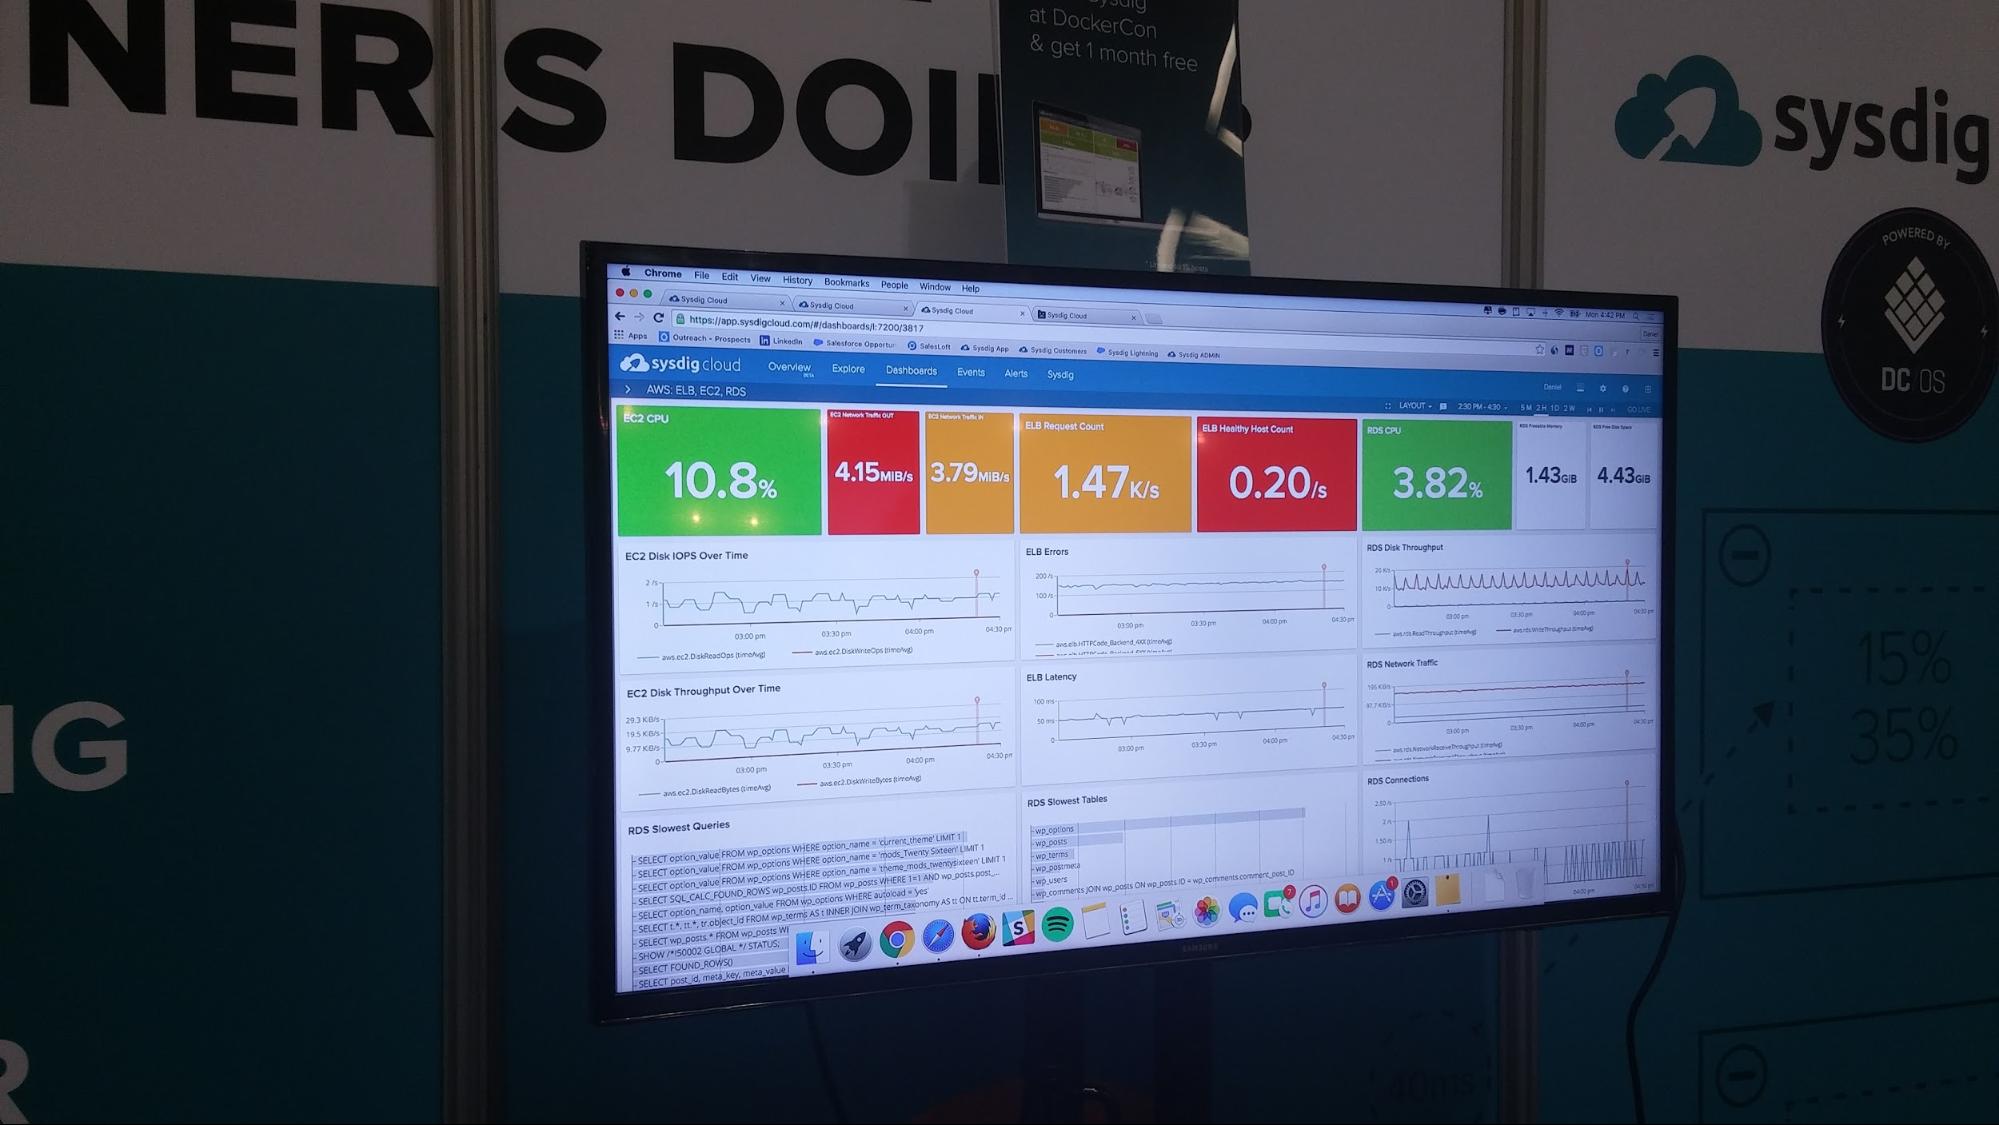
Sysdig is a different kind of beast.
Started as an open source project that focuses on monitoring microservices, Sysdig “sees inside your containers without instrumenting them,” says Daniel Liong, a member of the Sysdig product team.
What this means is that instead of installing an agent on your Docker host, the Sysdig agent sits at the operating system level — so instead of looking from the inside, Sysdig looks at the containers from “the outside.”
The agent looks into the actual system calls made to the kernel (system, network, disk I/O), allowing you to understand the processes that are running in the system and the services running in a container.
The results of this “container-native monitoring” are presented in a monitoring dashboard that displays a wide array of visualizations representing container-specific performance and monitoring metrics.
New Relic
New Relic is more application- and server-centric, enabling users to drill down per server from the application level to containers.
Users can see key metrics on each container by sorting them by CPU or memory. This data can then be integrated with New Relic’s Insights feature to query and visualize the collected data on your Docker environment in real-time.
Mike Panchenko, the founder of Opsmatic (which was acquired by New Relic), sees plenty of competition in the world of Docker monitoring and told me that the main difference between New Relic and others is the context that it provides: “The best tool that lets you slice and dice infrastructure the best way will win. The tool needs to be flexible enough to be suited to the user’s environment.”
Last, But Not Least…
I would be remiss if I didn’t mention our own Docker Log Collector, which offers a different type of solution. This method latches on to the Docker API and ships Docker logs, statistics, and dameon events to the Logz.io ELK Stack. This data can then be analyzed and visualized using Elasticsearch’s powerful querying capabilities and Kibana’s visualization layer. Learn more about our Docker log collector in this blog post.
What monitoring solutions impressed you at Dockercon 2016? Tell us your favorites in the comments below!
↧
↧
10 Elasticsearch Concepts You Need to Learn

Getting acquainted with ELK lingo is one of the first things you’re going to have to do when starting out with the stack. Just like with any programming language, there are some basic concepts that once internalized, make the learning curve less traumatic.
We’ve put together ten of the most important concepts you’re going to want to understand. While the concepts apply specifically to Elasticsearch, they are also are important to understand when operating the stack as a whole. When applicable — and to make it easier to understand — we will compare concepts to parallel terms in the world of relational databases.
1. Fields
Fields are the smallest individual unit of data in Elasticsearch. Each field has a defined type and contains a single piece of data that can be, for example, a boolean, string or array expression. A collection of fields are together a single Elasticsearch document.
Starting with Elasticsearch version 2.X, field names cannot start with special characters and cannot contain dots.
2. Documents
Documents are JSON objects that are stored within an Elasticsearch index and are considered the base unit of storage. In the world of relational databases, documents can be compared to a row in table.
For example, let’s assume that you are running an e-commerce application. You could have one document per product or one document per order. There is no limit to how many documents you can store in a particular index.
Data in documents is defined with fields comprised of keys and values. A key is the name of the field, and a value can be an item of many different types such as a string, a number, a boolean expression, another object, or an array of values.
Documents also contain reserved fields that constitute the document metadata such as:
- _index – the index where the document resides
- _type – the type that the document represents
- _id – the unique identifier for the document
An example of a document:
{
   "_id": 3,
   “_type”: [“user”],
   "age": 28,
   "name": ["daniel”],
   "year":1989,
}
3. Types
Elasticsearch types are used within documents to subdivide similar types of data wherein each type represents a unique class of documents. Types consist of a name and a mapping (see below) and are used by adding the _type field. This field can then be used for filtering when querying a specific type.
An index can have any number of types, and you can store documents belonging to these types in the same index.
4. Mapping
Like a schema in the world of relational databases, mapping defines the different types that reside within an index. It defines the fields for documents of a specific type — the data type (such as string and integer) and how the fields should be indexed and stored in Elasticsearch.
A mapping can be defined explicitly or generated automatically when a document is indexed using templates. (Templates include settings and mappings that can be applied automatically to a new index.)
# Example
curl -XPUT localhost:9200/example -d '{
  "mappings": {
    "mytype": {
      "properties": {
        "name": {
          "type": "string"
        },
        "age": {
          "type": "long"
        }
      }
    }
  }
}'
5. Index
Indices, the largest unit of data in Elasticsearch, are logical partitions of documents and can be compared to a database in the world of relational databases.
Continuing our e-commerce app example, you could have one index containing all of the data related to the products and another with all of the data related to the customers.
You can have as many indices defined in Elasticsearch as you want. These in turn will hold documents that are unique to each index.
Indices are identified by lowercase names that refer to actions that are performed actions (such as searching and deleting) against the documents that are inside each index.
6. Shards
Put simply, shards are a single Lucene index. They are the building block of Elasticsearch and are what facilitate its scalability.
Index size is a common cause of Elasticsearch crashes. Since there is no limit to how many documents you can store on each index, an index may take up an amount of disk space that exceeds the limits of the hosting server. As soon as an index approaches this limit, indexing will begin to fail.
One way to counter this problem is to split up indices horizontally into pieces called shards. This allows you to distribute operations across shards and nodes to improve performance.
When you create an index, you can define how many shards you want. Each shard is an independent Lucene index that can be hosted anywhere in your cluster:
# Example
curl -XPUT localhost:9200/example -d '{
  "settings" : {
    "index" : {
      "number_of_shards" : 2,
      "number_of_replicas" : 1
    }
  }
}'
7. Replicas
Replicas, as the name implies, are Elasticsearch fail-safe mechanisms and are basically copies of your index’s shards. This is a useful backup system for a rainy day — or, in other words, when a node crashes. Replicas also serve read requests, so adding replicas can help to increase search performance.
To ensure high availability, replicas are not placed on the same node as the original shards (called the “primary” shard) from which they were replicated.
Like with shards, the number of replicas can be defined per index when the index is created. Unlike shards, however, you may change the number of replicas anytime after the index is created.
See the example in the “Shards” section above.
8. Analyzers
Analyzers are used during indexing to break down phrases or expressions into terms. Defined within an index, an analyzer consists of a single tokenizer and any number of token filters. For example, a tokenizer could split a string into specifically defined terms when encountering a specific expression.
By default, Elasticsearch will apply the “standard” analyzer, which contains a grammar-based tokenizer that removes common English words and applies additional filters. Elasticsearch comes bundled with a series of built-in tokenizers as well, and you can also use a custom tokenizer.
A token filter is used to filter or modify some tokens. For example, a ASCII folding filter will convert characters like ê, é, è to e.
# Example

curl -XPUT localhost:9200/example -d '{
  "mappings": {
    "mytype": {
      "properties": {
        "name": {
          "type": "string",
          "analyzer": "whitespace"
        }
      }
    }
  }
}'
9. Nodes
The heart of any ELK setup is the Elasticsearch instance, which has the crucial task of storing and indexing data.
In a cluster, different responsibilities are assigned to the various node types:
- Data nodes — stores data and executes data-related operations such as search and aggregation
- Master nodes — in charge of cluster-wide management and configuration actions such as adding and removing nodes
- Client nodes — forwards cluster requests to the master node and data-related requests to data nodes
- Tribe nodes — act as a client node, performing read and write operations against all of the nodes in the cluster
- Ingestion nodes (this is new in Elasticsearch 5.0) — for pre-processing documents before indexing
By default, each node is automatically assigned a unique identifier, or name, that is used for management purposes and becomes even more important in a multi-node, or clustered, environment.
When installed, a single node will form a new single-node cluster entitled “elasticsearch,” but it can also be configured to join an existing cluster (see below) using the cluster name. Needless to say, these nodes need to be able to identify each other to be able to connect.
In a development or testing environment, you can set up multiple nodes on a single server. In production, however, due to the amount of resources that an Elasticsearch node consumes, it is recommended to have each Elasticsearch instance run on a separate server.
10. Cluster
An Elasticsearch cluster is comprised of one or more Elasticsearch nodes. As with nodes, each cluster has a unique identifier that must be used by any node attempting to join the cluster. By default, the cluster name is “elasticsearch,” but this name can be changed, of course.
One node in the cluster is the “master” node, which is in charge of cluster-wide management and configurations actions (such as adding and removing nodes). This node is chosen automatically by the cluster, but it can be changed if it fails. (See above on the other types of nodes in a cluster.)
Any node in the cluster can be queried, including the “master” node. But nodes also forward queries to the node that contains the data being queried.
As a cluster grows, it will reorganize itself to spread the data.
There are a number of useful cluster APIs that can query the general status of the cluster.
For example, the cluster health API returns health status reports of either “green” (all shards are allocated), “yellow” (the primary shard is allocated but replicas are not), or “red” (the shard is not allocated in the cluster). More about cluster APIs is here.
# Output Example
{
  "cluster_name" : "elasticsearch",
  "status" : "yellow",
  "timed_out" : false,
  "number_of_nodes" : 1,
  "number_of_data_nodes" : 1,
  "active_primary_shards" : 5,
  "active_shards" : 5,
  "relocating_shards" : 0,
  "initializing_shards" : 0,
  "unassigned_shards" : 5,
  "delayed_unassigned_shards" : 0,
  "number_of_pending_tasks" : 0,
  "number_of_in_flight_fetch" : 0,
  "task_max_waiting_in_queue_millis" : 0,
  "active_shards_percent_as_number" : 50.0
}
A Final Note
These are the main concepts you should understand when getting started with ELK, but there are other components and terms as well. We couldn’t cover them all, so I recommend referring to Elastic for additional information.
Happy indexing!
Logz.io is a predictive, cloud-based log management platform that is built on top of the open-source ELK Stack, which includes Elasticsearch. Start your free trial today!

↧
Finding the Needle in a Haystack: Anomaly Detection with the ELK Stack

The following scenario might sound familiar.
It’s the middle of the night. Your mobile starts vibrating. On the other end, it’s a frantic customer (or your boss) complaining that the website is down. You enter crisis mode and start the troubleshooting process, which involves ingesting a large amount of caffeine and — usually — ends with the problem being solved.
Sometimes, this scenario can be avoided by using the correct logging and monitoring strategy. Centralized logging, for example, is a useful strategy to implement but not easy to use. The biggest challenge, of course, is sifting through the huge volumes of log data that come into the system and identifying correlations and anomalies.
One of the reasons that the ELK Stack is so popular is that it is a very useful tool for streaming large sets of data from different sources, identifying correlations using queries and searches, and creating rich visualizations and monitoring dashboards on top of them.
This post describes a simple workflow process to troubleshoot a website crash by analyzing different types of logs and finding a correlation between them. To do this, we will use the enterprise-grade ELK Stack hosted by Logz.io — but most of the described steps can be performed with any installation of open source ELK.
The scenario that I will use consists of a simple web application that is based on an Apache web server and MySQL database. In this case, the ELK Stack is ingesting Apache logs, database logs, and server performance metrics using the Logz.io performance agent.
It’s crisis time
To start the troubleshooting process, we’re going to access our Kibana interface and begin querying Elasticsearch for relevant log messages.
First, I’m going to set the time frame to “Today” to get an overview of all of the recent events being logged:
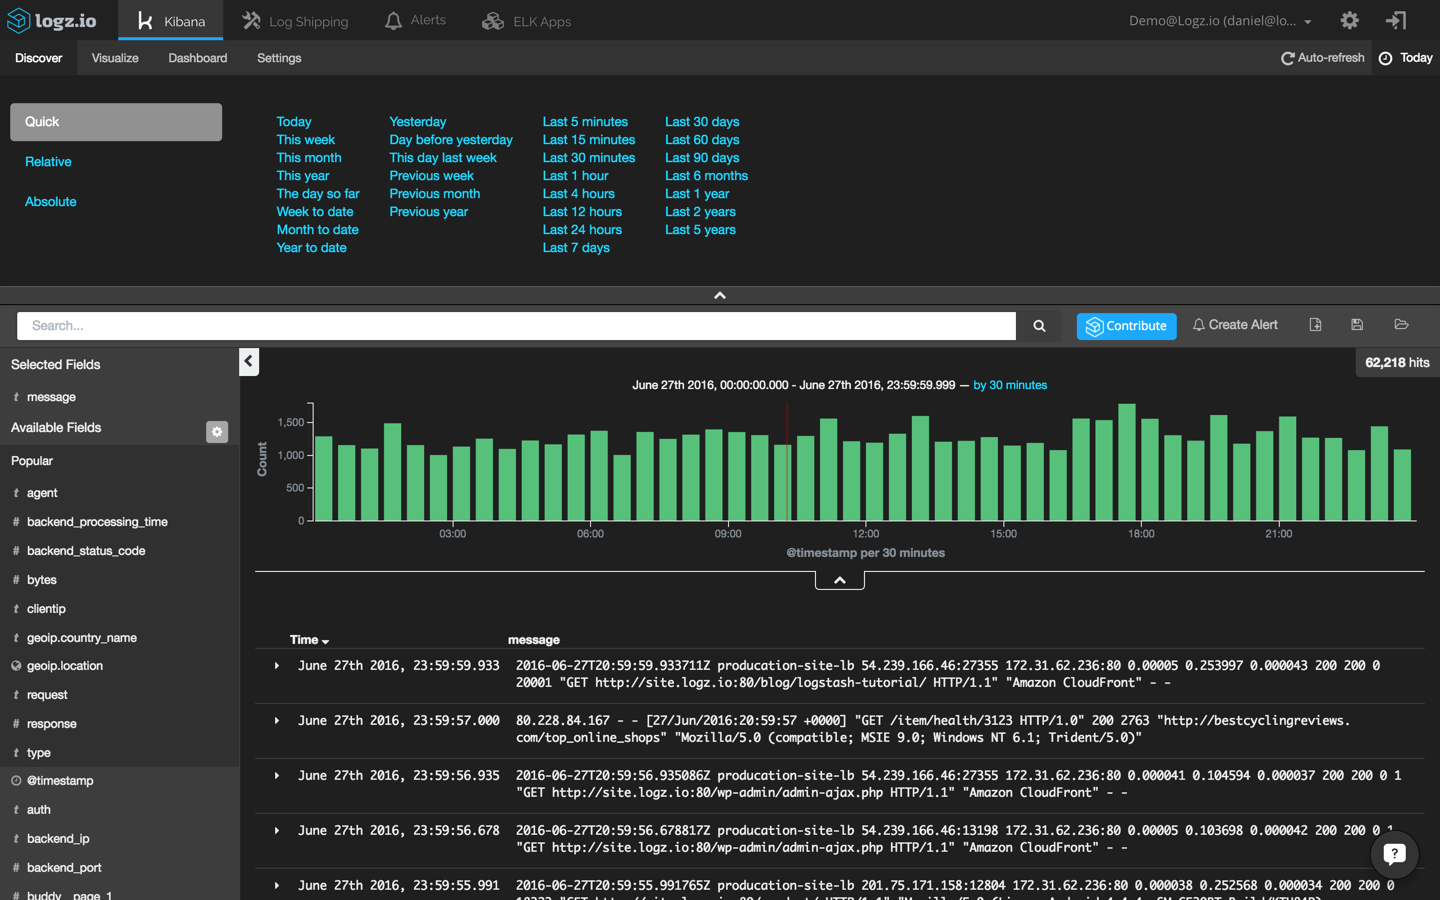
In this case, I can see more than 60,000 log messages within this time frame. Not very useful, right? It’s time to try and find our needle in the haystack by querying Elasticsearch in Kibana.
Querying is Kibana’s bread and butter and an art unto itself, but the truth is that it is not always easy. I’d recommend reading up on the topic in our Kibana tutorial to acquaint yourself with the various types of searches.
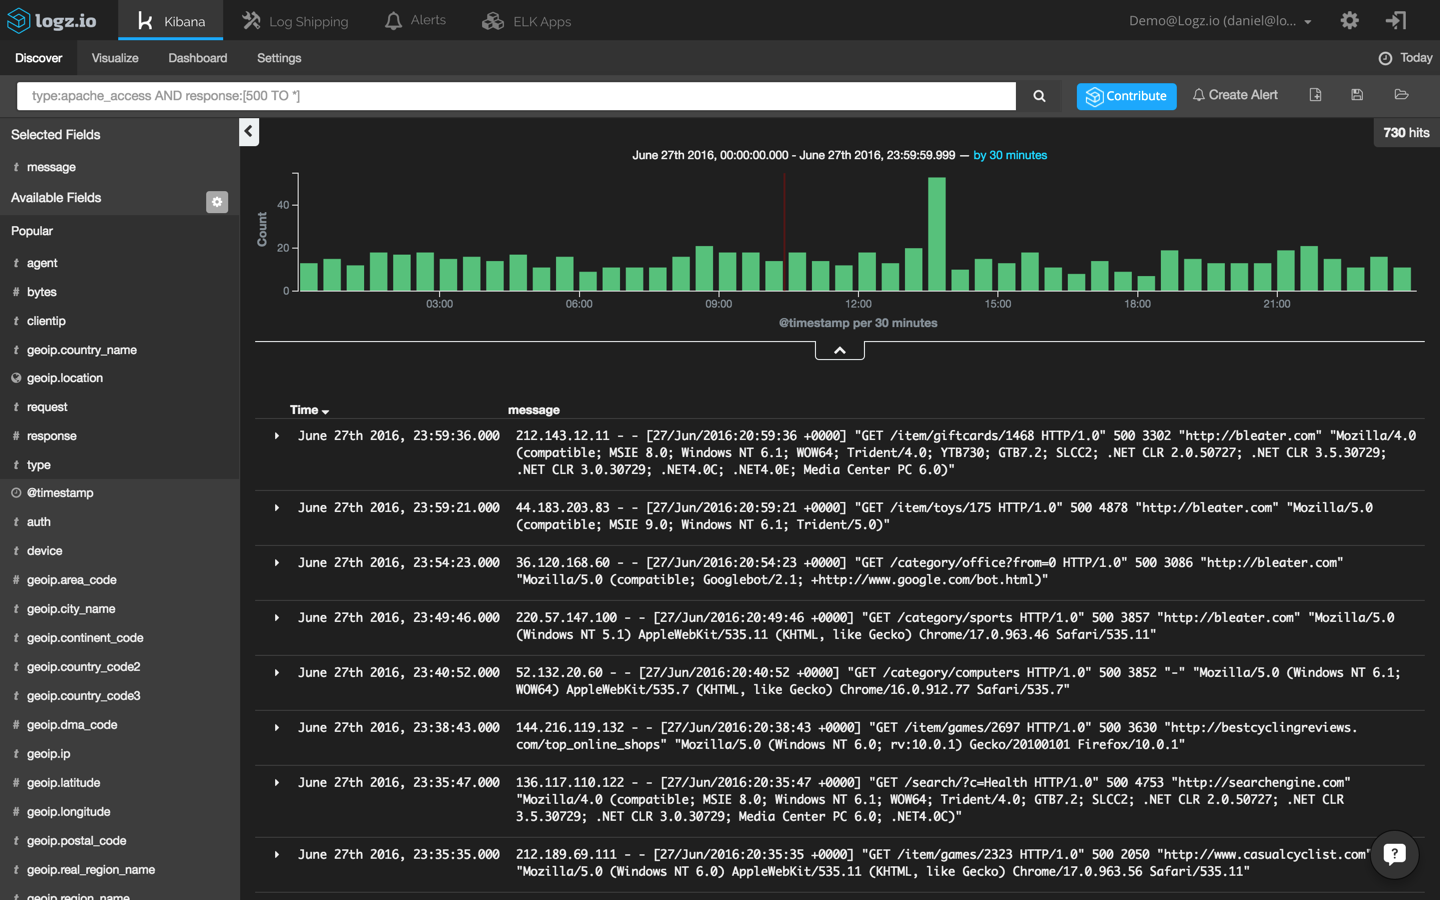
Now, since we’re investigating a site crash, a good place to start would be our Apache logs (you can also read more here about using the ELK Stack as an Apache log analyzer). Specifically, we’re going to use a field-level search to pinpoint Apache error messages:
type:apache_access AND response:[500 TO *]
This returns a list of 730 Apache errors with response codes of 500 and above:
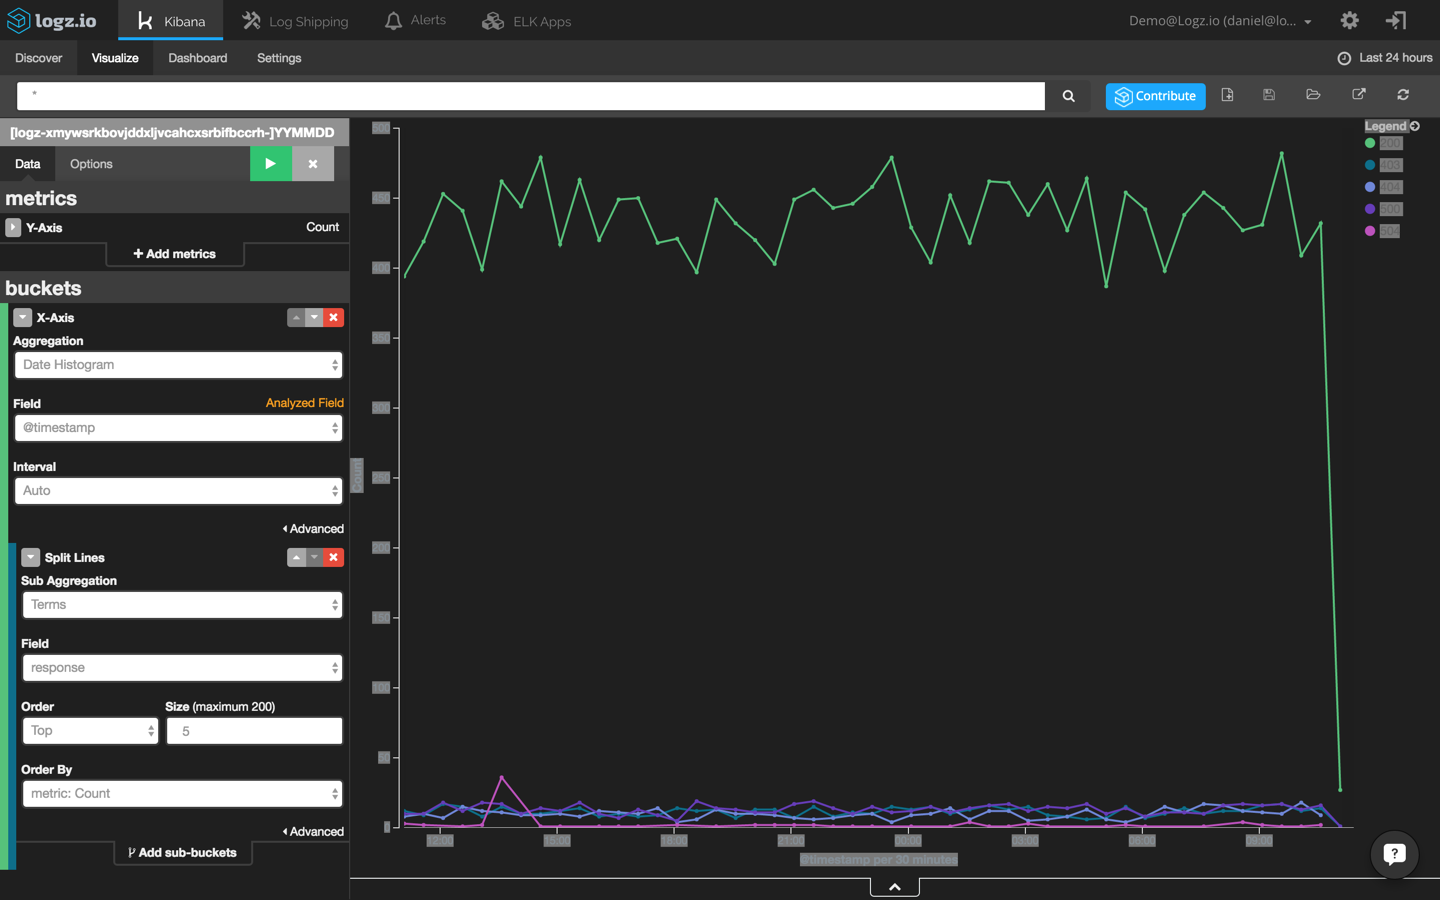
Our haystack is still a bit too large to be able to return useful information. To narrow it down further, I’m going to have to be more specific and focus on 504 responses:
type:apache_access AND response:504
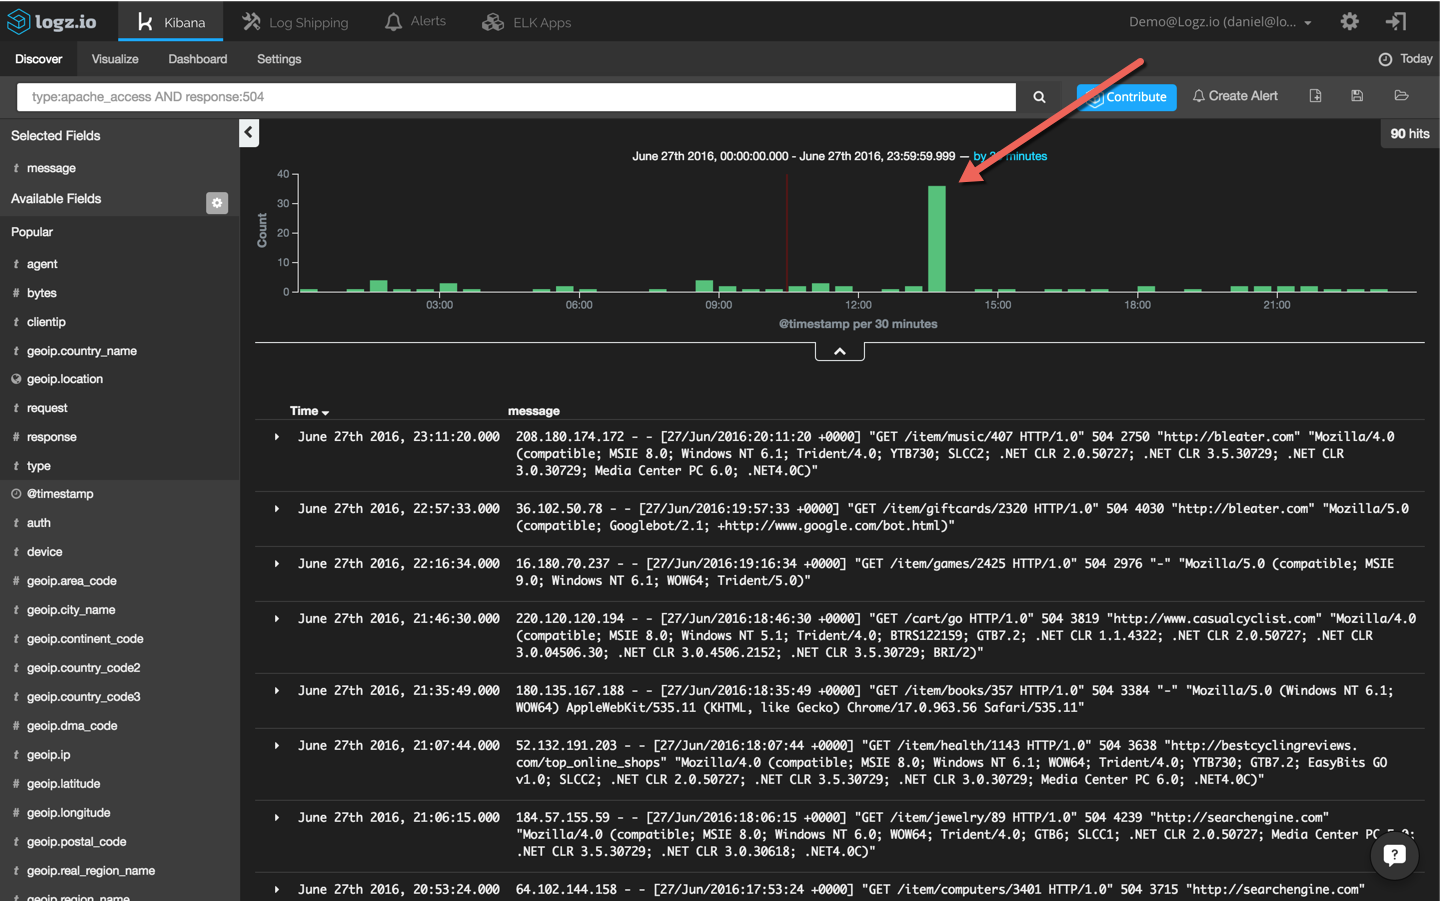
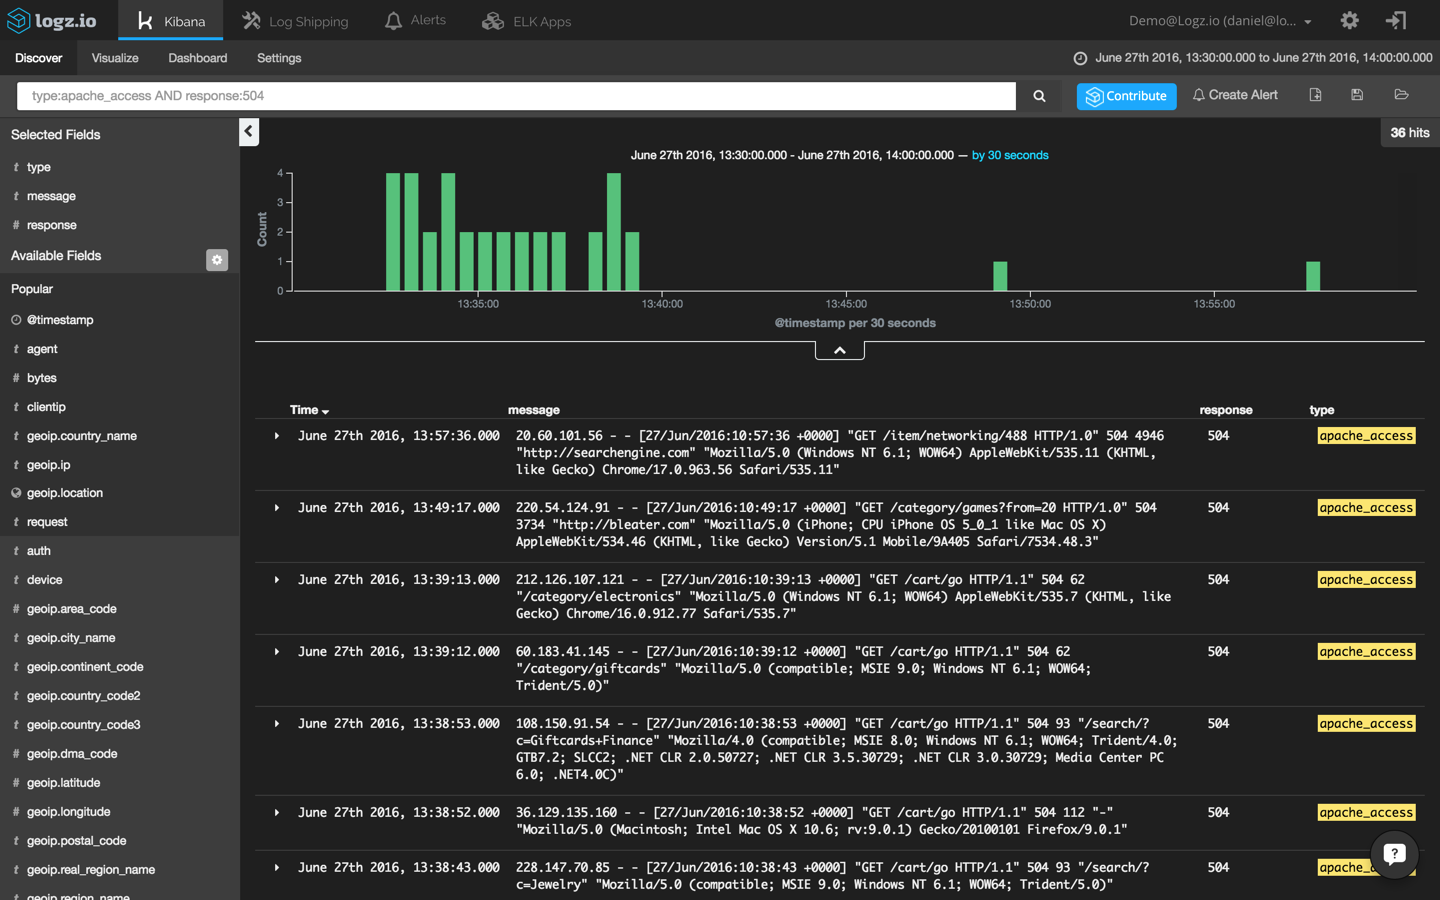
Now, we’re talking. This search results in an obvious and visible peak in events. To drill down further, I’m going to click on the bucket and add the ‘response’ and ‘type’ fields to the message list to make the list of events more readable:
If we select one of the displayed log messages, we will get a detailed view of the event — a list of the message fields and their values (select the JSON tab to see the message in JSON format):
{
   "_index": "logz-xmywsrkbovjddxljvcahcxsrbifbccrh-160627_v1",
   "_type": "apache_access",
   "_id": "AVWPKMnATxyubhgJppgh",
   "_score": null,
   "_source": {
      "request": "/cart/go",
      "agent": "\"Mozilla/5.0 (compatible; Googlebot/2.1; +http://www.google.com/bot.html)\"",
      "minor": "1",
      "auth": "-",
      "ident": "-",
      "type": "apache_access",
      "major": "2",
      "clientip": "128.93.102.172",
      "geoip": {
         "timezone": "Europe/Paris",
         "ip": "128.93.102.172",
         "latitude": 46,
         "country_code2": "FR",
         "country_name": "France",
         "country_code3": "FRA",
         "continent_code": "EU",
"location": [
            2,
            46
         ],
         "longitude": 2
      },
      "os": "Other",
      "verb": "GET",
      "message": "128.93.102.172 - - [27/Jun/2016:10:34:53 +0000] \"GET /cart/go HTTP/1.1\" 504 93 \"-\" \"Mozilla/5.0 (compatible; Googlebot/2.1; +http://www.google.com/bot.html)\"",
      "tags": [
         "_logz_upload_8021",
         "apache-geoip"
      ],
      "referrer": "\"-\"",
      "@timestamp": "2016-06-27T10:34:53.000Z",
      "response": 504,
      "bytes": 93,
      "name": "Googlebot",
      "os_name": "Other",
      "httpversion": "1.1",
      "device": "Spider"
   },
   "fields": {
      "@timestamp": [
         1467023693000
      ]
   },
   "highlight": {
      "type": [

"@kibana-highlighted-field@apache_access@/kibana-highlighted-field@"
      ]
   },
   "sort": [
      1467023693000
   ]
   }
This is great, but how do we translate this information into something actionable?
Pinpointing the cause
To get a wider perspective and try to understand whether there is a correlation between our Apache errors and the other events taking place in the environment, let’s “zoom out” while we are logged into ELK.
To do this, we’re going to use a useful feature that is specific to the Logz.io ELK stack — the +/- button that is in the top-right corner of each log message. This gives you the option of easily displaying other events that have taken place within one second, ten seconds, thirty seconds, or sixty seconds of the initial selected event. (If you’re using the open source version of Kibana, you can do the exact same thing by manually configuring the time frame.)
Clicking +/- ten seconds and removing the search filter we used to find the Apache 504 events gives us an aggregated view of all events coming within our entire system and taking place ten seconds before and after our 504 events:
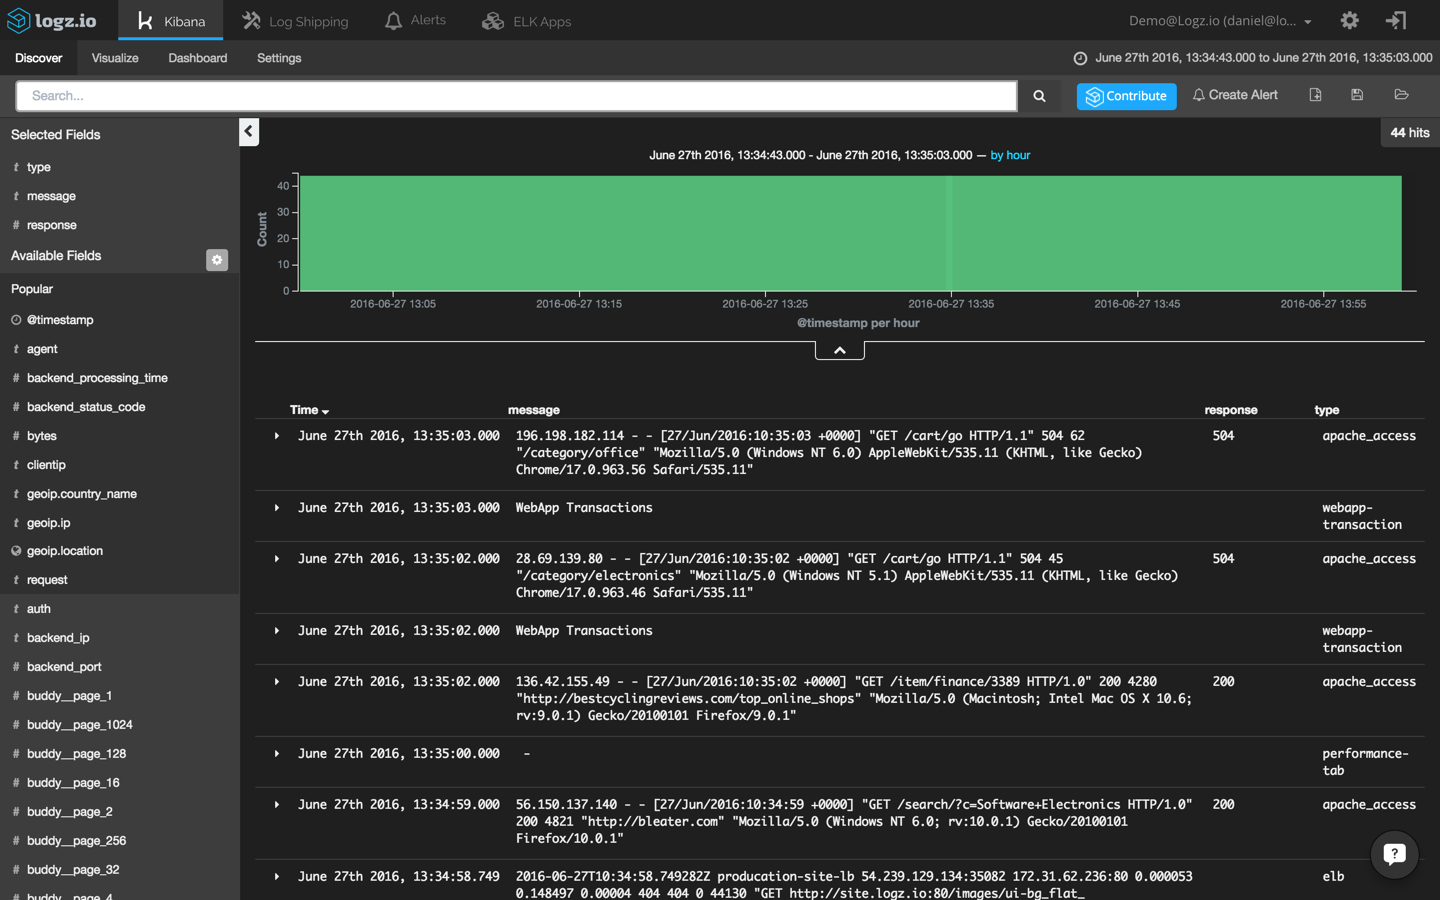
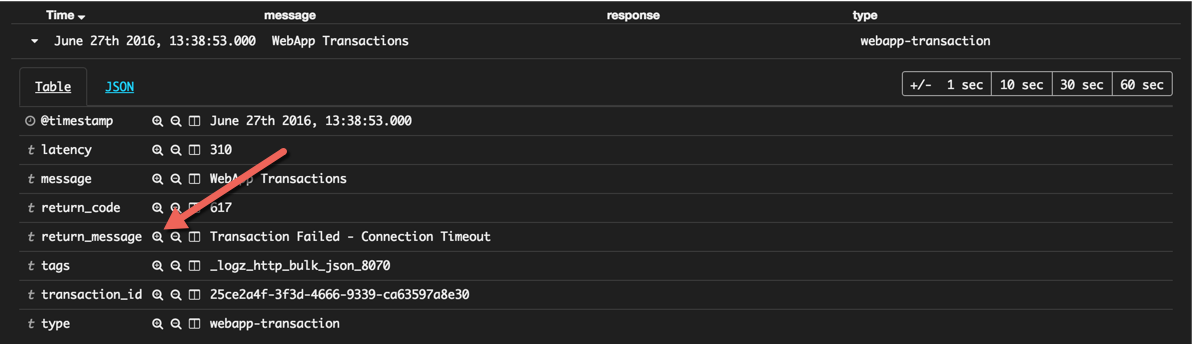
What suddenly becomes visible is that Apache 504 responses are being logged right after WebApp Transaction errors. Opening one of these errors reveals that transactions are failing because of connection timeouts with our backend:
{
   "_index": "logz-xmywsrkbovjddxljvcahcxsrbifbccrh-160627_v1",
   "_type": "webapp-transaction",
   "_id": "AVWPKMuFbofAsbciXwUI",
   "_score": null,
   "_source": {
      "transaction_id": "25ce2a4f-3f3d-4666-9339-ca63597a8e30",
      "latency": "403",
      "return_message": "Transaction Failed - Connection Timeout",
      "message": "WebApp Transactions",
      "type": "webapp-transaction",
      "tags": [
         "_logz_http_bulk_json_8070"
      ],
      "@timestamp": "2016-06-27T10:35:03.000+00:00",
      "return_code": "617"
   },
   "fields": {
      "@timestamp": [
         1467023703000
      ]
   },
   "sort": [
      1467023703000
   ]
}
Start the monitoring game
It’s time to pat ourselves on the back. We have successfully detected the anomaly, made a correlation between logs, and troubleshooted the root cause. The good news is that this is the hard part of the process. The bad news is that we are far from done.
To keep tabs on these events, it’s now time to set up some monitoring graphs. In ELK lingo, these are the Kibana visualizations and dashboards.
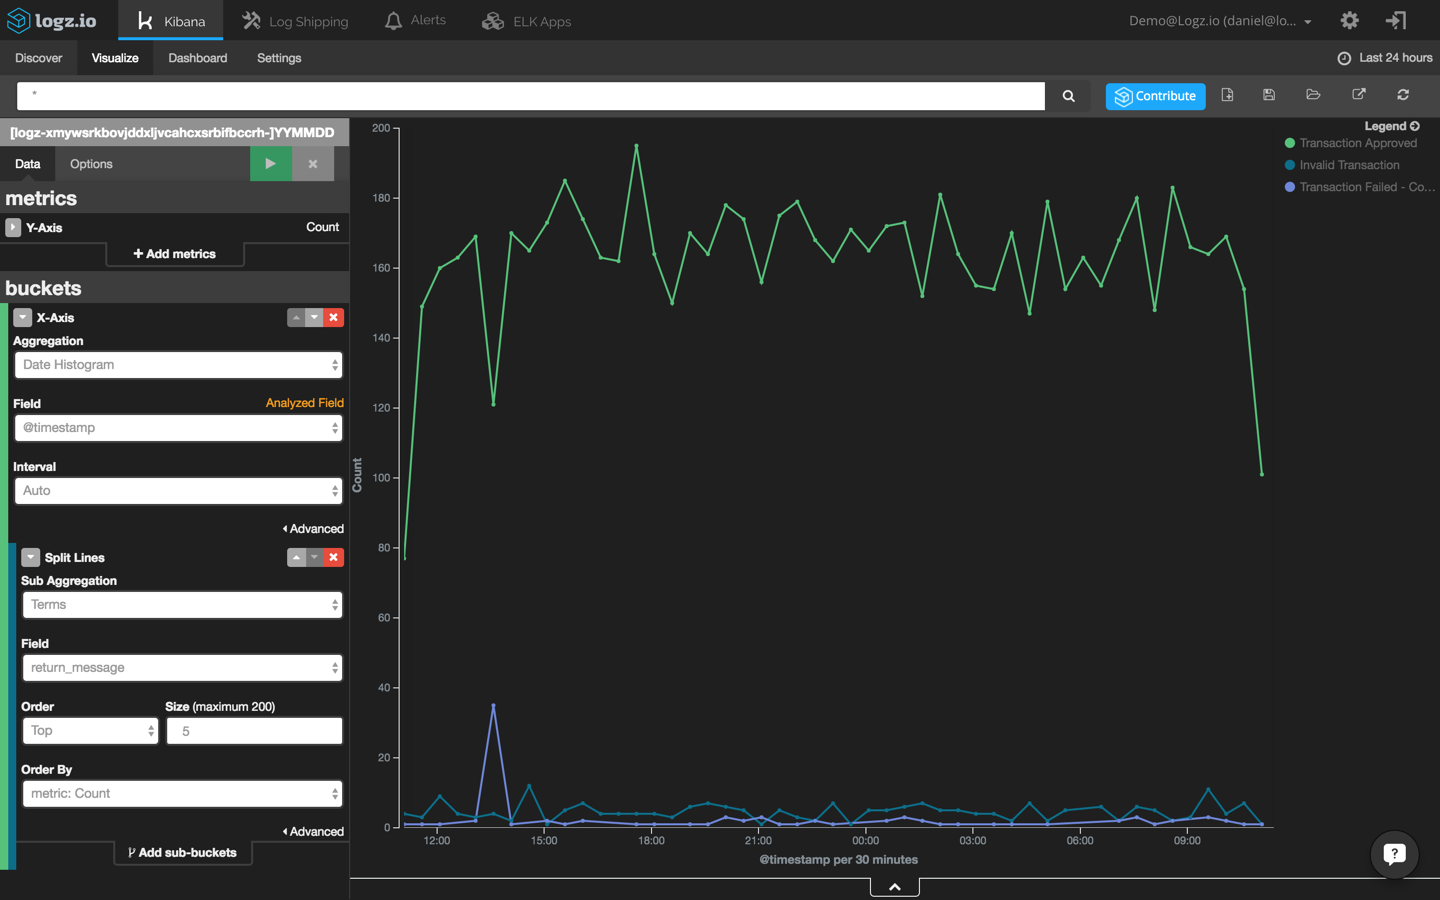
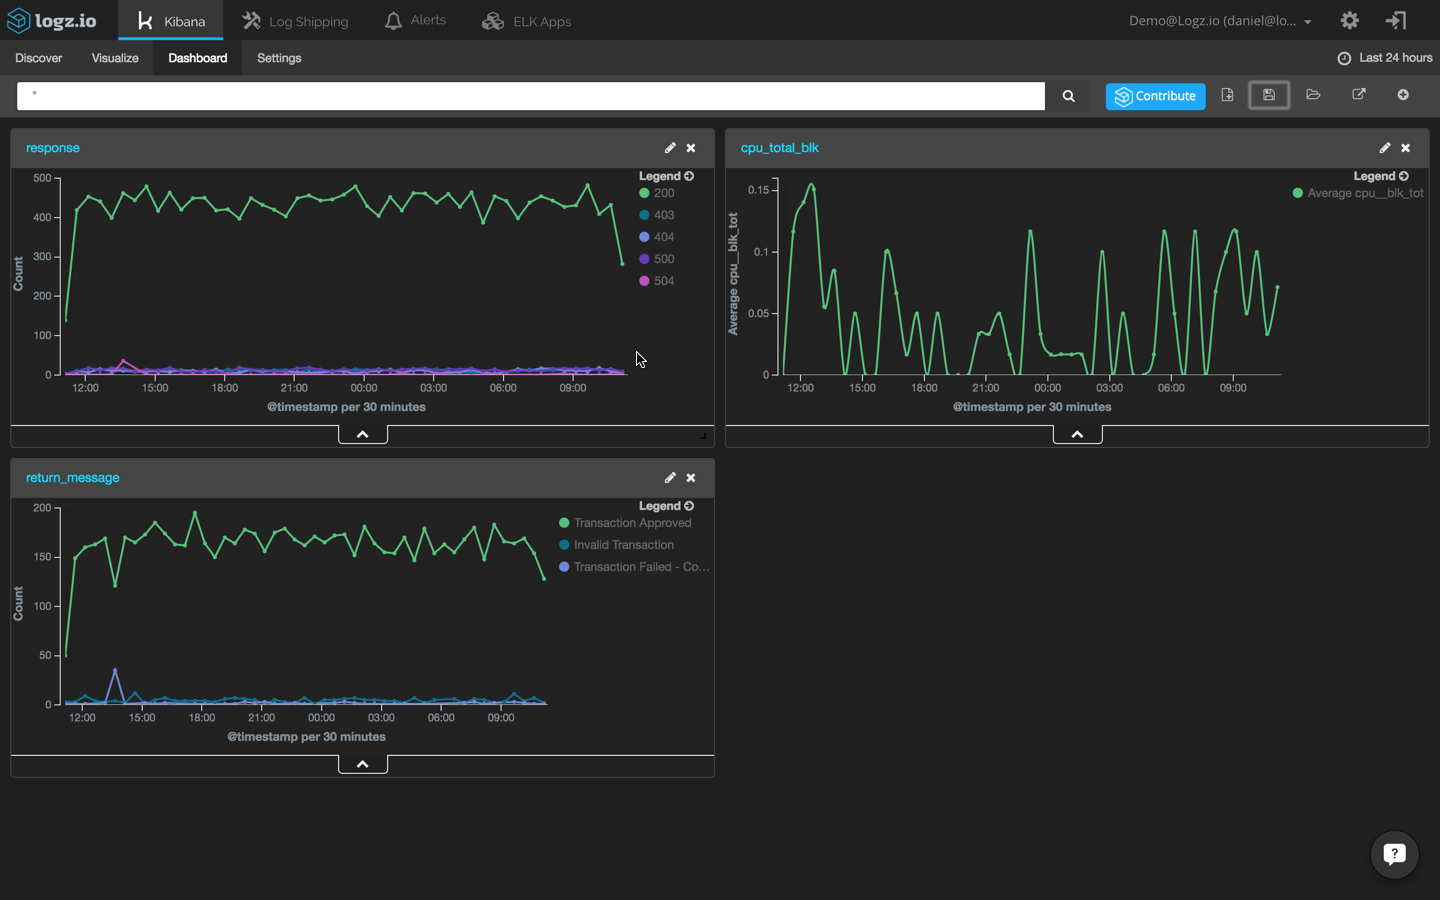
First, we are going to create a new line chart that shows webapp transactions across time. To do this, we will use the ‘return_message’ field:
Next, we are going to create a new line chart that shows HTTP response transactions across time. To do this, will use the ‘response’ field:
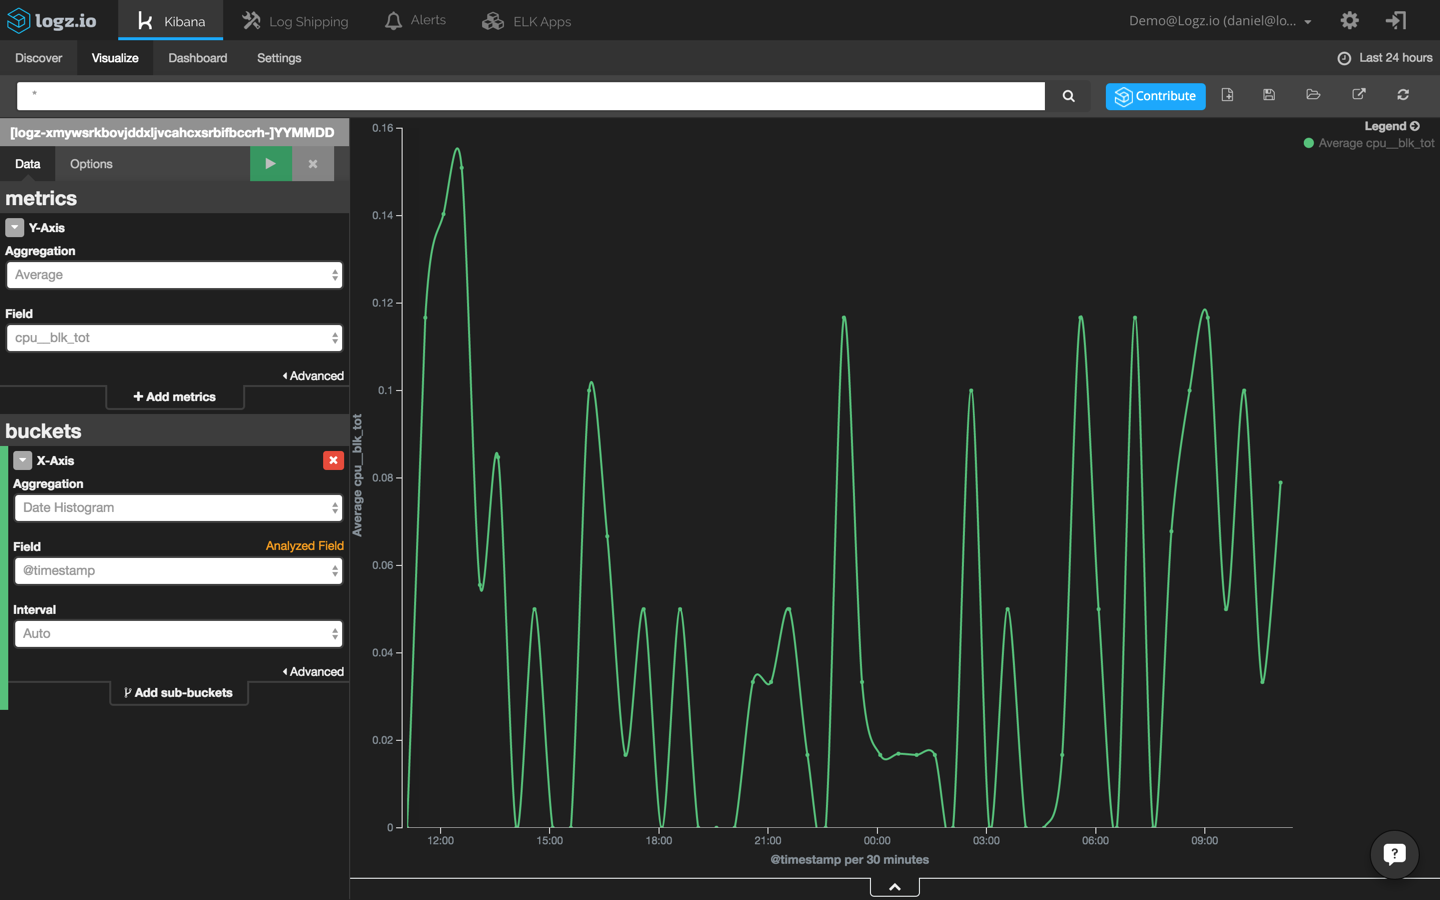
Last but not least, we are going to create another visualization that shows CPU usage across time using the ‘cpu_blk_tot’ field:
Add these three visualizations to a single dashboard to identify event correlations easily:
Of course, these are only a few examples of how to visualize log data. You can slice and dice the data any way you want, it all depends on which events you are monitoring and the set up of your environment.
Getting proactive
Now, how do we prevent such events from happening in the future?
There is usually no effective way for DevOps engineers to prevent website crashes that result from bad code that developers have written. However, there are ways for DevOps crews to be more proactive in their logging strategies so that they can find the causes of the crashes more quickly.
For example, creating alerts based on queries will alert you to events in real time. As an example, I will use the Logz.io alerting mechanism. If you’re using your own ELK Stack, you will need to configure your own alerting system.
First, let’s filter the list of events displayed in Kibana to show only transaction errors. To do this, we’re going to click this magnifying icon adjacent to the ‘return_message’ field:
Also, we’re going to change the time frame to back to ‘today’ to get a wide perspective:
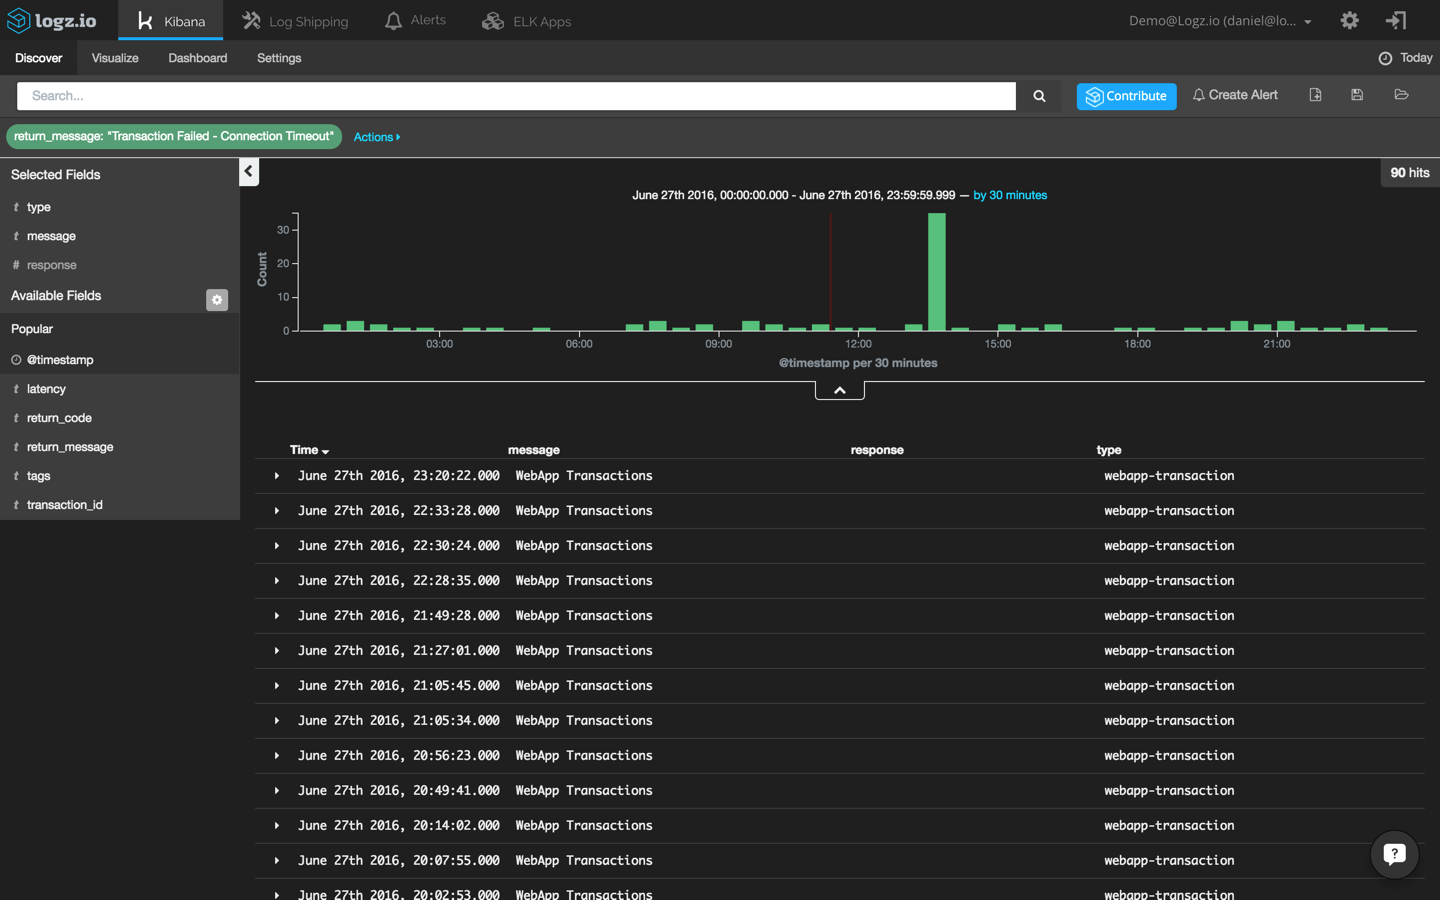
This helps us to identify what can be considered an “anomaly” in the context of transaction errors. We can see that up to three errors occur every thirty minutes. Also, we can see a peak of thirty-five events during our reported crash.
In the Kibana interface built into the Logz.io UI, I’m going to click the “Create Alert” button in the top right-hand corner:
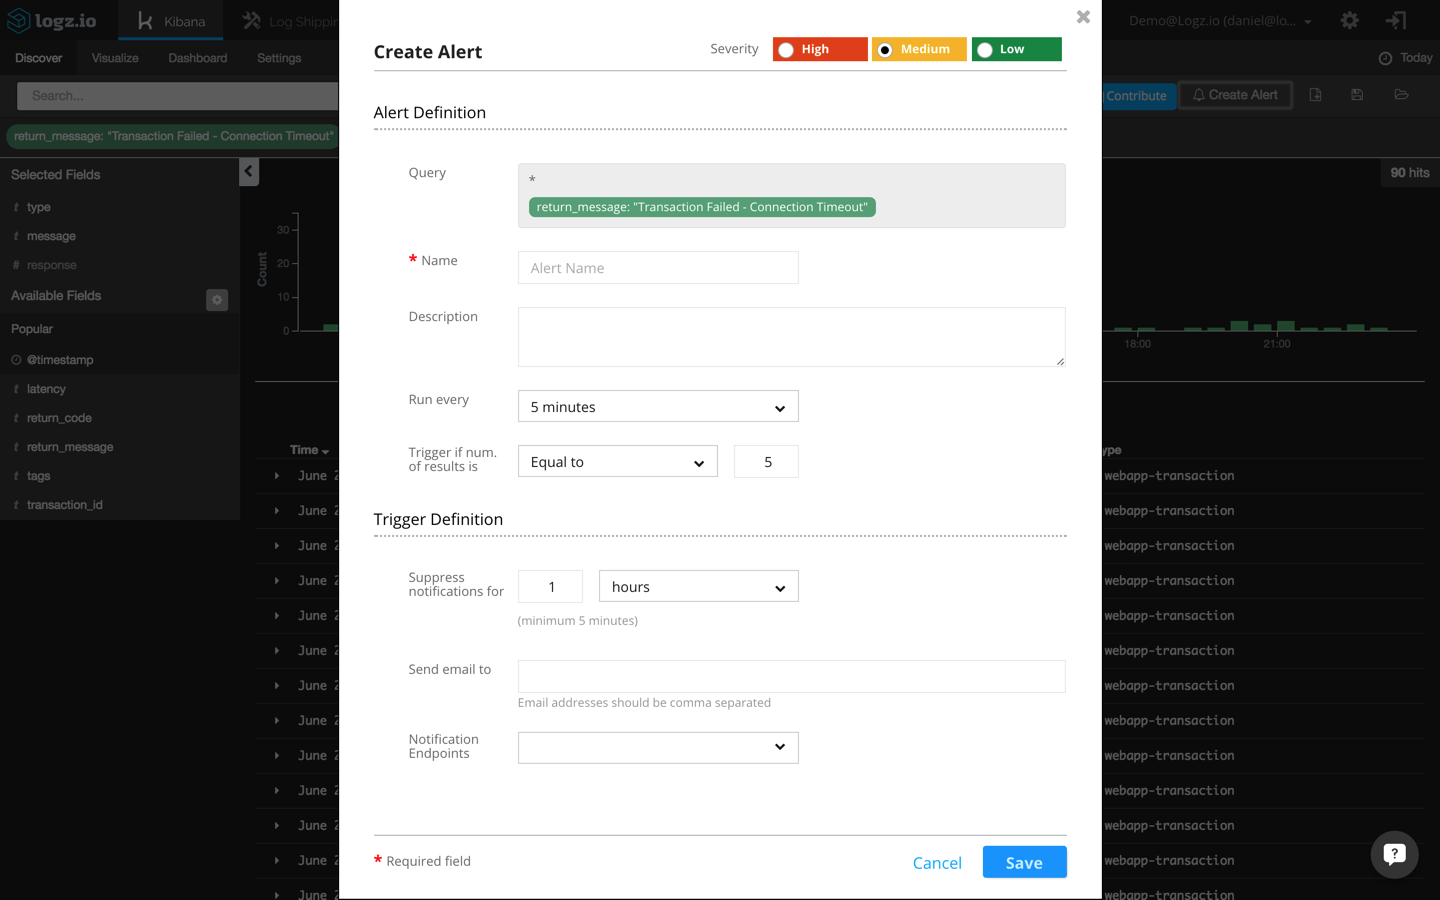
The actual query to be monitored is automatically entered in the alert definition dialog:
return_message: "Transaction Failed - Connection Timeout"
Additional fields to be entered here are a name and description for the alert, a threshold configuration, and the trigger definition (how you want to be notified when an alert is triggered).
For the threshold in this example, I’m going to configure Logz.io to send me a notification whenever more than three events occur within a five-minute timeframe.
Last but not least, I’m going to configure the alert to send me the notifications over email. Other available options are to use webhooks to receive notifications via a messaging app such as HipChat or Slack.
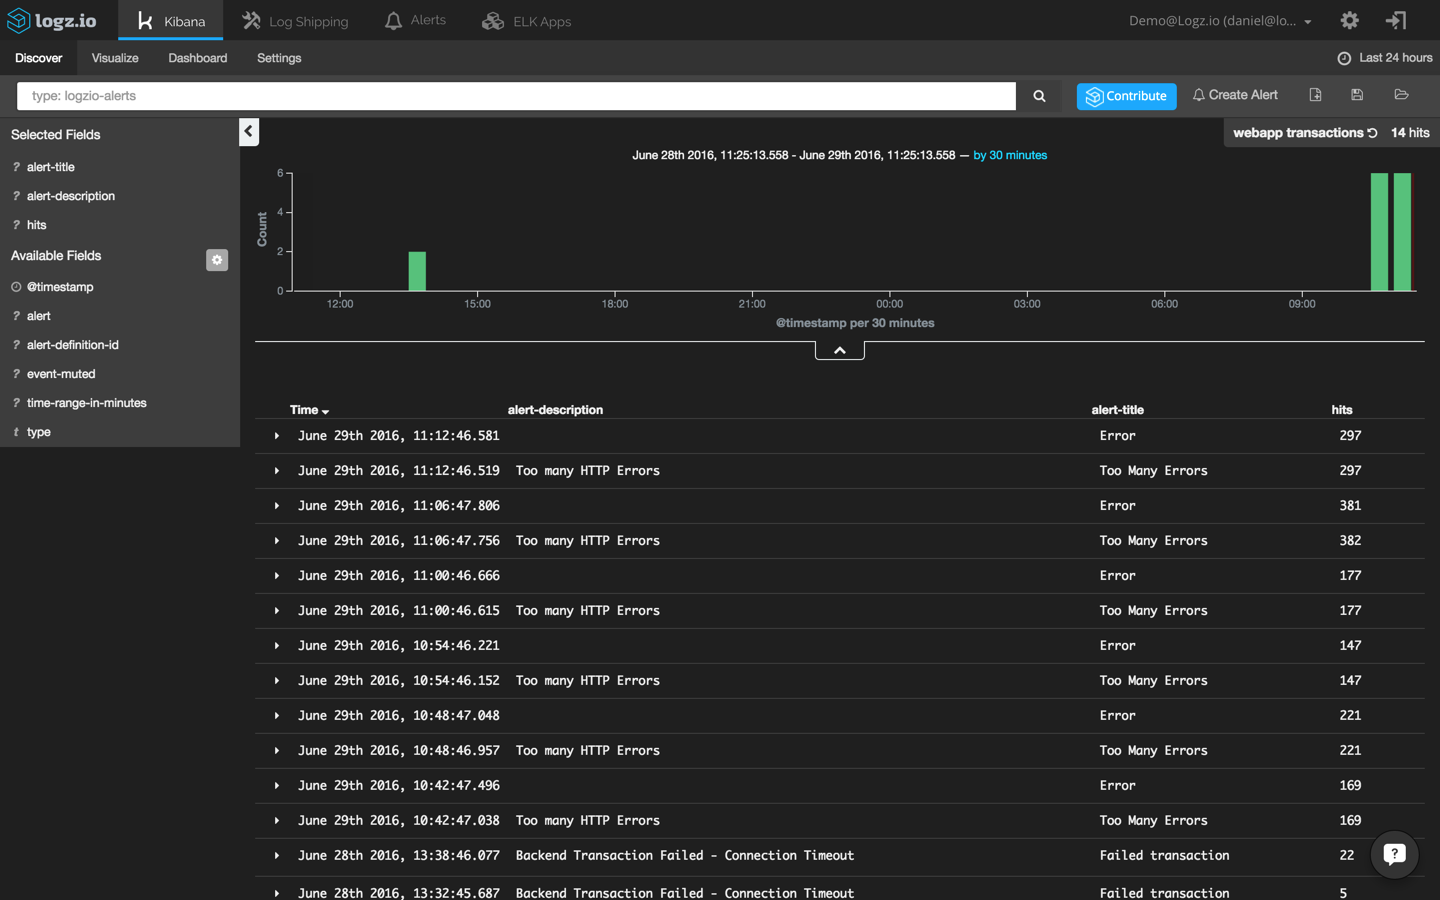
Once saved, alerts can be edited and managed from the “Alerts” tab. You can also create a visualization in Kibana that shows you the various Logz.io alerts that are being triggered.
To do this, I’m going to use the following query to search for alerts:
type: logzio-alerts
Next, I’m adding the ‘alert-description’ and ‘alert-title’ to get some visibility into the alerts being logged:
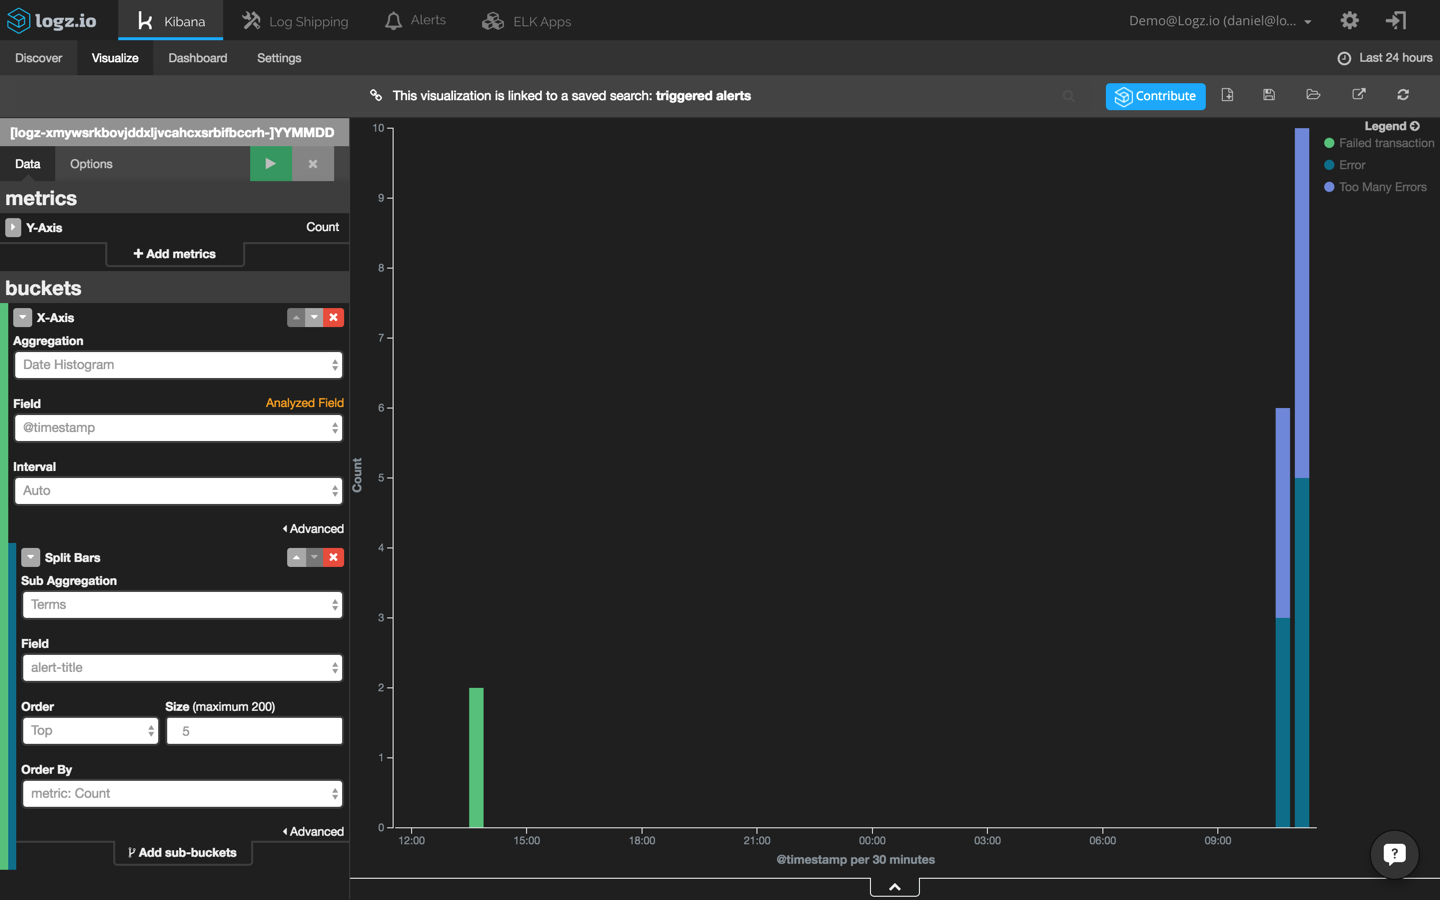
Using this search, I’m going to create a new bar chart visualization that shows me the different alerts that are being triggered in Logz.io over time:
A final note
Finding a book in a library without knowing the title and author name is impossible. In the field of log analytics, the ELK Stack makes this task easier with its powerful querying capabilities. Still — identifying anomalies within large sets of data remains a real obstacle for DevOps teams.
To solve this problem, our developers here at Logz.io are working hard on building machine-learning features on top of the ELK Stack that will use actionable insights to shorten the troubleshooting cycle.
Exciting news is coming. Stay tuned!
Logz.io is a predictive, cloud-based log management platform that is built on top of the open-source ELK Stack. Start your free trial today!
↧
MongoDB Performance Monitoring Using The ELK Stack

MongoDB, one of the most popular NoSQL databases today, is designed to process and store massive amounts of data. The tool is used by many well-known, modern IT organizations such as Facebook, eBay, Foursquare, and Expedia. Monitoring is a critical component of all database administration, and tight monitoring of your MongoDB cluster will allow you to assess the state of your database. However, due to its complex architecture which allows for virtually unlimited scaling, monitoring is a challenging task.
In this article, we will explain how to collect and analyze some of the MongoDB metrics using the ELK Stack so that you can keep a close eye on your MongoDB performance and growth.
MongoDB Metrics to Track
In this article, we will use the latest version of MongoDB (version 3.2) and focus on metrics that are available using the WiredTiger storage engine. This is currently MongoDB 3.0’s default storage engine. We will focus on tracking and metric analysis to get an overview of its database performance, resource utilization, and saturation. These are accessible using MongoDB commands.
Throughput
MongoDB (with WiredTiger storage engine) provides several commands that can be used to collect metrics using mongo shell. Mongo shell is an interactive JavaScript interface for MongoDB that allows you to query data and take administrative actions.
One of the rich commands that provides a lot of information about items including operations, connections, journaling, background flushing, memory, locking, asserts, cursors, and cache is the serverStatus (i.e., db.serverStatus()).
These throughput metrics are important since they can be used to avoid many performance issues, such as resource overloading. To get a general overview of your MongoDB cluster activities, you should first look at number of read/write clients and the number of db operations that they perform. These metrics can be retrieved using serverStatus opcounters and globalLock objects.
The objects’ output is in JSON, such as show in the example below:
….

"opcounters": {

      "insert": 0,

      "query": 1,

      "update": 12,

      "delete": 5,

      "getmore": 0,

      "command": 23

}

….
The opcounters part of the serverStatus output
Opcounters.query and opcounters.getmore commands return metrics that indicate the number of read requests received from the time the mongod (a process that handles data requests and manages data access) instance last began. On the other hand, opcounters.insert, opcounters.update, and opcounters.delete return the number of write requests received.
By monitoring the number of read and write requests, you can quickly prevent resource saturation as well as spot bottlenecks and the root cause of overloads. In addition, these metrics will allow you to assess when and how you need to scale your cluster.
As shown above, globalLock is a document that reports on the database’s lock state and can provide you with information regarding read/write request statuses. These will allow you to check if requests are accumulating faster than they are being processed. The same applies to activeClients.readers and activeClients.writers. These can enable you to learn about the relationship between the amount of current active clients and your database load.
"globalLock": {

   "totalTime": NumberLong(254415000),

   "currentQueue": {

      "total": 0,

      "readers": 0,

      "writers": 0

   },

   "activeClients": {

      "total": 8,

      "readers": 0,

      "writers": 0

   }

}

…
The globalLock part of the serverStatus output
Performance and Failover
Using a replica set (a master-slave replication that facilitates load balancing and failover) is a must to ensure your production robustness. The oplog (operations log) is the main component of the MongoDB replication mechanism. Below, you can see the relevant metrics that can be retrieved using the getReplicationInfo and replSetGetStatus commands.
As shown below, replica set member statuses are composed of a few indications such as the replica state and optimeDate field, which is important for calculating the replication lag metric that contains the date when the last entry from the oplog is applied to that member):
...

"members" : [

   {

      "_id" : 0,

      "name" : "<HOST1>",

      "health" : 1,

      "state" : 1,

      "stateStr" : "PRIMARY",

      "uptime" : 250,

      "optime" : {

         "ts" : Timestamp(1447946570, 1),

         "t" : NumberLong(1)

         },

      "optimeDate" : <DATE>,

      "infoMessage" : "could not find member to sync from",

      "electionTime" : <TIMESTAMP>,

      "electionDate" : <DATE>,

      "configVersion" : 1,

      "self" : true

   },

   {

      "_id" : 1,

      "name" : "<HOST2>",

      "health" : 1,

      "state" : 2,

      "stateStr" : "SECONDARY",

      "uptime" : 13,

      "optime" : {

         "ts" : Timestamp(1447946549, 1),

         "t" : NumberLong(-1)

         },

      "optimeDate" : <DATE>,

      "lastHeartbeat" : <DATE>,

      "lastHeartbeatRecv" : <DATE>,

      "pingMs" : NumberLong(0),

      "configVersion" : 1

},

{

      "_id" : 2,

      "name" : "<HOST2>",

      "health" : 1,

      "state" : 2,

      "stateStr" : "SECONDARY",

      "uptime" : 13,

      "optime" : {

         "ts" : Timestamp(1447946549, 1),

         "t" : NumberLong(-1)

         },

      "optimeDate" : <DATE>,

      "lastHeartbeat" : <DATE>,

      "lastHeartbeatRecv" : <DATE>,

      "pingMs" : NumberLong(0),

      "configVersion" : 1

   }

]

…
The member part of the replSetGetStatus output
Replication lag is used to show the difference between the primary and secondary. Since you want to avoid serving outdated information, it’s important to keep the difference between the two as narrow as possible. If you lack any existing load issues, your replication lag will be zero. This is ideal. However, if the number rises for your secondary nodes, the integrity of your data is at risk. To avoid such events, we recommend setting alerts on these metrics so that you can constantly monitor your replica status. Learn more about replication lag here.
Resource utilization
One of the most important metrics is the number of client connections. This includes current active connected clients and the unused connections as well. These can be reported using serverStatus:
...

"connections": {

   "current": 1,

   "available": 818,

   "totalCreated": NumberLong(4)

}

...
The connections part of the serverStatus output
An unexpected rise in the client connections metric can occur if the connection is not handled well or if there is an issue inside of the MongoDB driver that is used for handling the connection. Tracking the behavior of these metrics will allow you to set the relevant summary metrics such as the average amount as alerts’ thresholds.
Another set of very important metrics is related to storage. These can be be retrieved using the db.stats() command, which will return statistics for the selected database. Running it using the Mongo shell to get statistics on the database test_mongo_db looks like this:
mongo test_mongo_db --eval "db.stats()"
The next JSON snippet is from the db.stats output:
{

   "db": "test",

   "collections": 1,

   "objects": 1,

   "avgObjSize": 40,

   "dataSize": 40,

   "storageSize": 4096,

   "numExtents": 0,

   "indexes": 1,

   "indexSize": 4096,

   "fileSize": 0,

   "ok": 1

}
Example of db.stats output
If you look inside the output of db.stats command, you will find (similar to the example above) metrics for the number of objects (documents) within all of the collections (collections property in the output), the size of all documents (dataSize property in bytes), the size of all indexes (indexSize property, in bytes) and total amount of space allocated to collections in this database for document storage.
Monitoring dataSize, indexSize or storageSize metrics will show you the change in physical memory allocation and will help you to keep your cluster healthy with enough storage to serve your database. On the other hand, a large drop in dataSize can also indicate that there are many requested deletions, which should be investigated to confirm that they are legitimate operations.
The following metrics that should be monitored are the memory metrics using serverStatus. The interested tuple of metrics is virtual memory usage, which is located in the mem.virtual property (in MB), and the amount of memory used by the database, which is located in the mem.resident property (in MB). Similar to the storage metrics, memory metrics are important to monitor because overloading RAM memory within your server(s) is never good. This can lead to the slowing or crashing of your server, which will leave your cluster weakened. Or, even worse, if you have only one dedicated server, MongoDB can dramatically slow down or even crash.
Another important set of metrics is located in the extra_info.page_faults property of the serverStatus output: the number of page faults or the number of times MongoDB failed to get data from the disk.
"mem": {

   "bits": 64,

   "resident": 82,

   "virtual": 245,

   "supported": true,

   "mapped": 0,

   "mappedWithJournal": 0

}
"extra_info": {
"note": "fields vary by platform",
"heap_usage_bytes": 59710000,
"page_faults": 1
}
The mem and extra_info part of the serverStatus output
Collecting and Monitoring Using ELK
In this section, we will described how to ship, store, and monitor your MongoDB performance metrics detailed above using the Logz.io ELK Stack.
We will use the Ubuntu Server 16.04 on Amazon cloud. You can also read our step-by-step article if you would like to know how to install and configure the ELK stack on Amazon cloud.
Extracting the MongoDB Metrics
In the next step, we will demonstrate how to ship metrics to Elasticsearch with Logstash. Using some programming to retrieve metrics will give you better control and allow you to run complex pre-shipping actions.
To ship logs, we will create a Logstash configuration file with the input path, including how to interpret it and where to send it. Learn more about Logstash configuration here.
Before we create the Logstash configuration file, we will describe how to retrieve the MongoDB metrics specifically — using the mongo shell interface via the bash of your OS.
If we want to execute the serverStatus command via our terminal, without staying in the mongo shell program, we can use –eval flag of the mongo shell program as follows:
mongo --eval "db.serverStatus()"
And the output:
MongoDB shell version: 3.2.7

Connection to: <db>

{

   <the JSON objects>

}
The output format from the serverStatus command
As you can see, the first two lines of the output contain information about the MongoDB shell version and to which database the shell is currently connected. Since this format does not comply with strict JSON rules and complicates our Logstash configuration file, we will use the pipeline approach to cut off the first two lines of the output with the tail command.
So, our command will look like this:
mongo --eval 'db.serverStatus()' | tail -n +3
Now, the output file will only contain the JSON part.
Next, we want to remove the NumberLong(x) and ISODate(x) from the JSON file. Again, sending these to Logstash will trigger a JSON parsing exception, and storing in Elasticsearch will fail. To transform the stream of the text, we will use the sed command with a regex pattern that will find NumberLong and ISODate data types. It will then replace it with the arguments that exist inside these data types:
{

   ….

   "localTime": ISODate("2016-06-23T16:43:19.105Z"),

   …

   "connections": {

      ….

      "totalCreated": NumberLong(62)

      …

   }

}
The example of the serverStatus ouput with NumberLong and ISODate data types
Now, using the pipeline command and adding the piece for transforming the text, the final command will look as follows:
mongo --eval 'db.serverStatus()' | tail -n +3 | sed 's/\(NumberLong([[:punct:]]\?\)\([[:digit:]]*\)\([[:punct:]]\?)\)/\2/' | sed 's/\(ISODate(\)\(.*\)\()\)/\2/'
Running this command will generate a pure JSON file without the MongoDB metadata.
In addition to the serverStatus command, we will also use the db.stats() command to gather storage metrics for specific databases. For the purpose of this tutorial, we created two databases for which we want to monitor storage allocation with the names test_mongo_db_1 and test_mongo_db_2.
Again, we will use the commands for gathering storage statistics for these two databases together with pipeline and tail commands to comply with the JSON formatting rules:
mongo test_mongo_db_1 --eval "db.stats()" | tail -n +3

mongo test_mongo_db_2 --eval "db.stats()" | tail -n +3
Configuring Logstash
Next, we will take the created commands from above and place them in the Logstash configuration file (logstash.config) using the exec input plugin. To forward the data to Elasticsearch, we will use the Elasticsearch output plugin:
input {


   exec {


      command => "mongo --eval 'db.serverStatus()' | tail -n +3 | sed 's/\(NumberLong([[:punct:]]\?\)\([[:digit:]]*\)\([[:punct:]]\?)\)/\2/' | sed 's/\(ISODate(\)\(.*\)\()\)/\2/'"

      interval => 7

      type => "db.serverStatus"

   }


   exec {

      command => "mongo test_mongo_db_1 --eval 'db.stats()' | tail -n +3"

      interval => 7

      type => "db.test_mongo_db_1.stats"

   }


   exec {

      command => "mongo test_mongo_db_2 --eval 'db.stats()' | tail -n +3"

      interval => 7

      type => "db.test_mongo_db_2.stats"

   }


}


filter {


   json {

      source => "message"

   }

}


output {


   elasticsearch {

      hosts => ["localhost:9200"]

   }


}
The Logstash configuration for getting MongoDB metrics and sending it to the Elasticsearch
We’re now going to start the Logstash configuration using the next command:
./bin/logstash -f logstash.config
After a short while, you will begin to receive the first MongoDB metrics via Logstash.
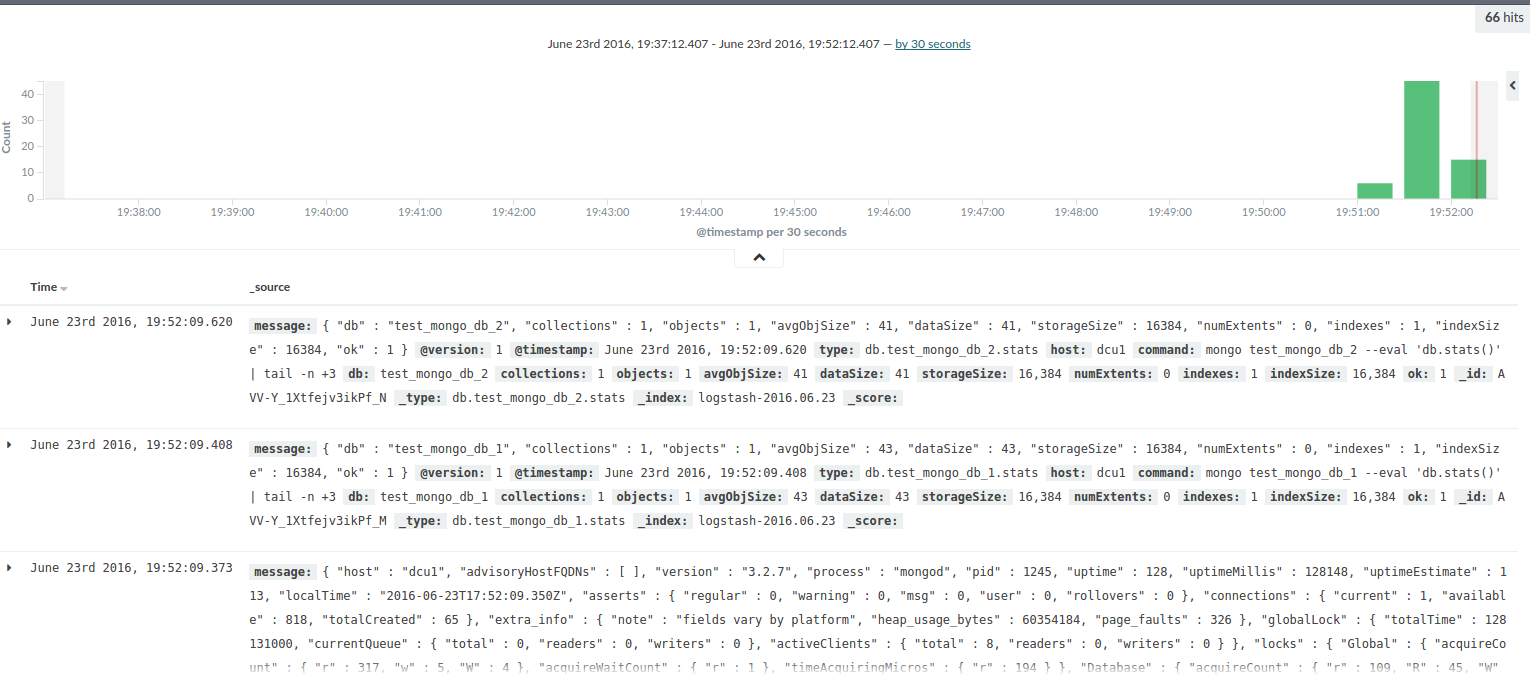
Discover section of Kibana after short time of waiting until Logstash start with sending metrics to the Elasticsearch
Shipping to Logz.io Using Logstash
Logz.io provides the ELK Stack as an end-to-end service so that the logs that you send to us are indexed and stored in Elasticsearch and available in real-time through Kibana.
While we support a wide range of techniques for shipping the logs (available under the Log Shipping section in the UI), in the next section I will explain how to use our Logstash integration to ship MongoDB logs into Logz.io.
In the Logz.io UI, select the Log Shipping tab located at the top of the page, and under the Platforms menu on the left, select the Logstash item.
On the right, you will see what needs to be added to the current Logstash configuration to send logs to Logz.io. Two additional changes are required: One is adding token through the filter plugin, and the second is changing the output, where the elasticsearch output is replaced with tcp pointing to the listener.logz.io server in charge of processing incoming logs.
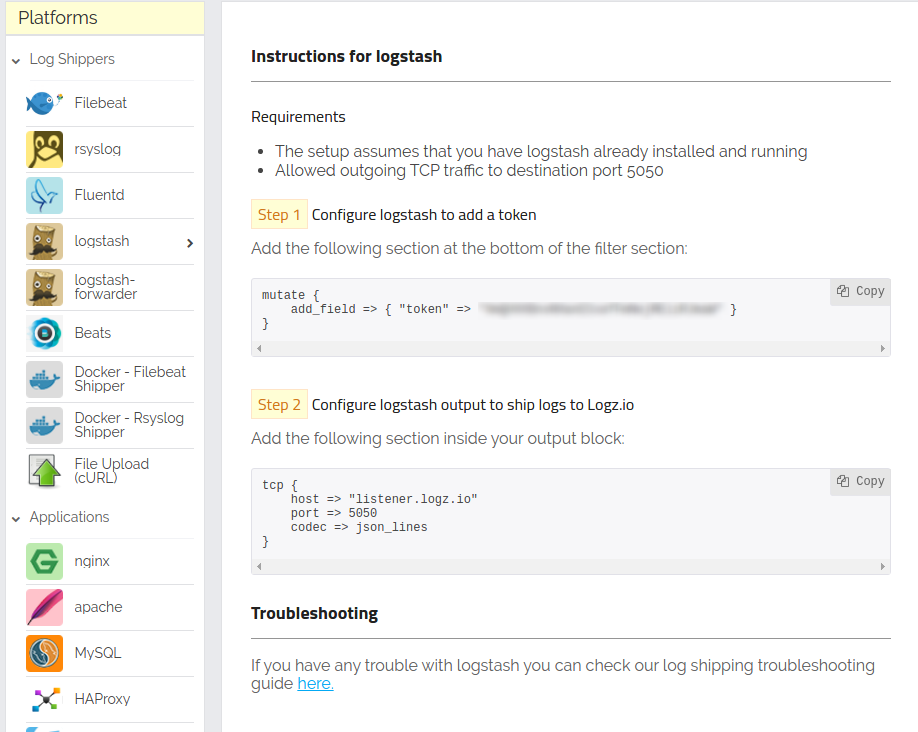
Logstash shipping page
After adding these changes, the Logstash configuration file for shipping logs to Logz.io looks like this:
input {

   exec {

      command => "mongo --eval 'db.serverStatus()' | tail -n +3 | sed 's/\(NumberLong([[:punct:]]\?\)\([[:digit:]]*\)\([[:punct:]]\?)\)/\2/' | sed 's/\(ISODate(\)\(.*\)\()\)/\2/'"

      interval => 7

      type => "db.serverStatus"

   }

   exec {


      command => "mongo test_mongo_db_1 --eval 'db.stats()' | tail -n +3"

      interval => 7

      type => "db.test_mongo_db_1.stats"

   }

   exec {

      command => "mongo test_mongo_db_2 --eval 'db.stats()' | tail -n +3"

      interval => 7

      type => "db.test_mongo_db_2.stats"

   }


}

filter {


   json {


      source => "message"

   }

   mutate {


      add_field => {"token" => "<TOKEN>"}

   }

}

output {


   tcp {

      host => "listener.logz.io"

      port => 5050

      codec => json_lines

   }

}
Logstash configuration file for shipping the logs to Logz.io
After starting Logstash with the new configuration file, you will notice that logs will begin to appear in the Discover section within the Logz.io UI.
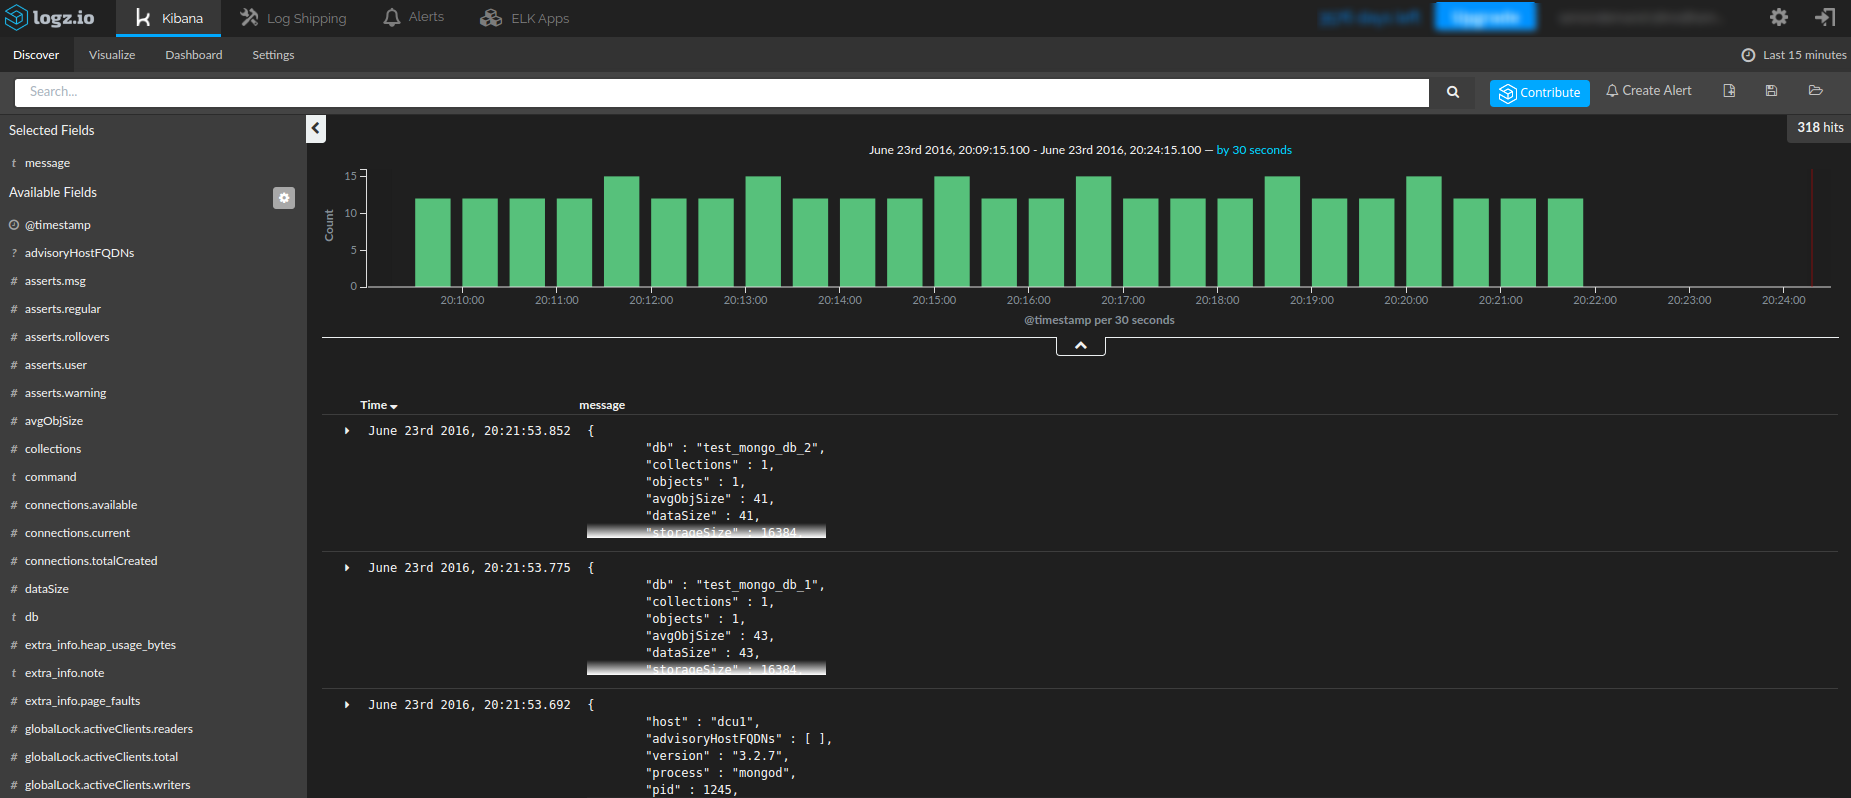
The Logz.io Discover section after starting a new Logstash configuration
Shipping to Logz.io Using Amazon S3
Another way to ship logs into Logz.io is with AWS S3. You would first need to create the log files themselves from the MongoDB command output, and then use the AWS CLI to sync with an S3 bucket.
Creating the log files
In the previous section, we used the pipeline command to execute and filter command output. The next step is to redirect this output to the file.
First, we will create a new log file:
mongo --eval 'db.serverStatus()' | tail -n +3 | sed 's/\(NumberLong([[:punct:]]\?\)\([[:digit:]]*\)\([[:punct:]]\?)\)/\2/' | sed 's/\(ISODate(\)\(.*\)\()\)/\2/' >> mongo_server_status_$(date +"%Y-%m-%d-%H")
Next, we will do the same for the command that generates the database stats:
mongo test_mongo_db_1 --eval 'db.stats()' | tail -n +3 >> mongo_test_mongo_db_1_stats_$(date +"%Y-%m-%d-%H")

mongo test_mongo_db_2 --eval 'db.stats()' | tail -n +3 >> mongo_test_mongo_db_2_stats_$(date +"%Y-%m-%d-%H")
We can now use these commands for periodic cron jobs to take charge of collecting the logs in a periodic manner.
Syncing with S3 and shipping to Logz.io
Logz.io supports shipping from S3 natively. In the Logz.io UI, open the Log Shipping section and expand the AWS section. Select the S3 bucket option, and configure Logz.io to be able to read from your S3 bucket.
To find more information on how to configure this type of shipping of the logs and how to use AWS CLI sync command to copy files to an S3 bucket, you can read the section S3 Syncing and Shipping in our article on creating a PCI DSS dashboard.
The MongoDB Performance Dashboard
Now that all of our MongoDB metrics are shipped to Elasticsearch, we are ready to build a monitoring dashboard. We will start with a series of Kibana visualizations for the throughput metrics.
First and as an example, we will create a line chart that visualizes the number of read requests. After clicking on the Visualize section and selecting the Line chart visualization type from the menu, we will set up metrics fields on the left side in the Kibana:
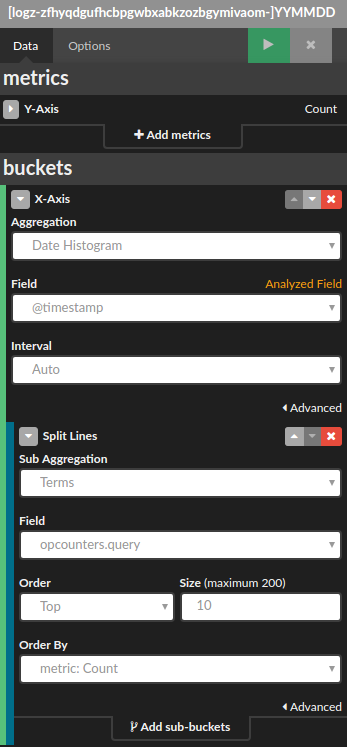
The metrics configuration for query number
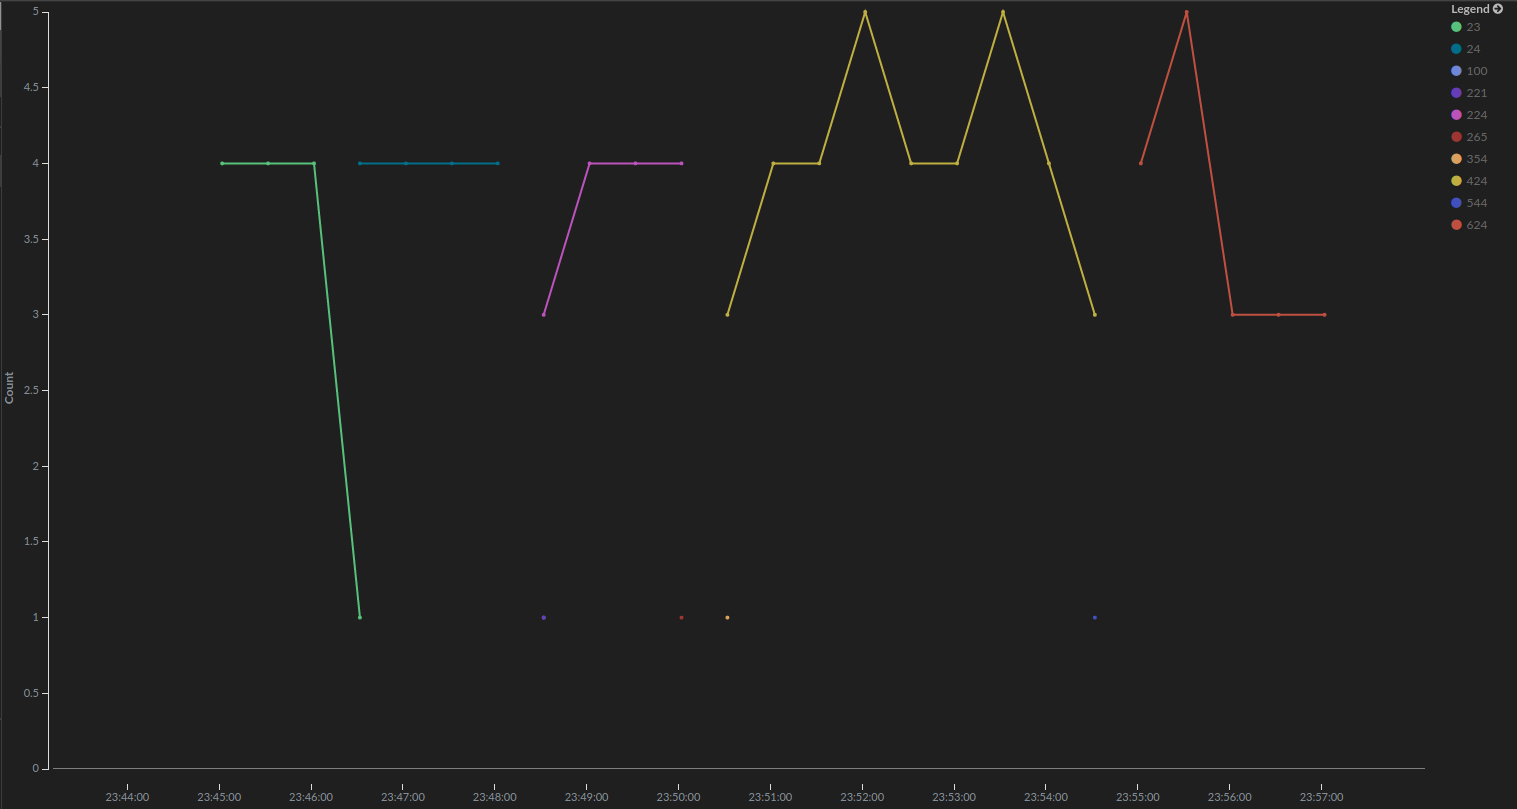
A line chart for query number
We will do the same thing for the rest of the throughput metrics. The configuration will only differ in the aggregation fields used (where for query we pointed on the opcounters.query from the field dropdown).
After adding and saving these charts in the KIbana dashboard, you will be able to see throughput metrics visualized:
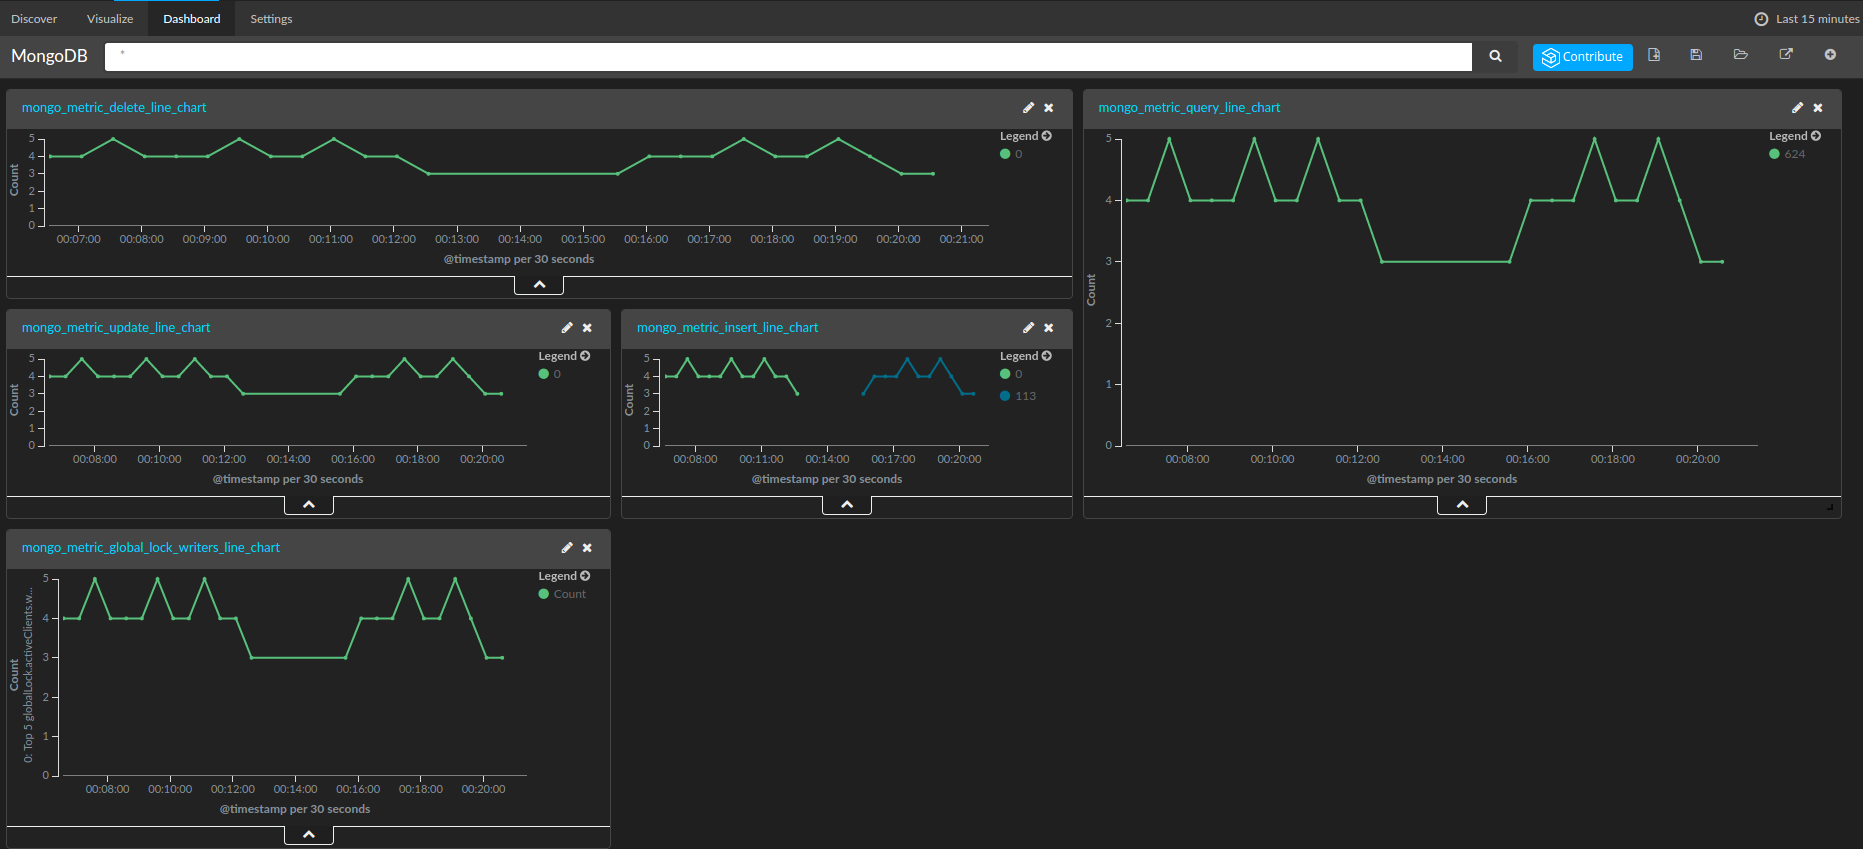
A dashboard with visualized throughput metrics
In a similar fashion, we can visualize the other metrics described in the MongoDB Metrics section.
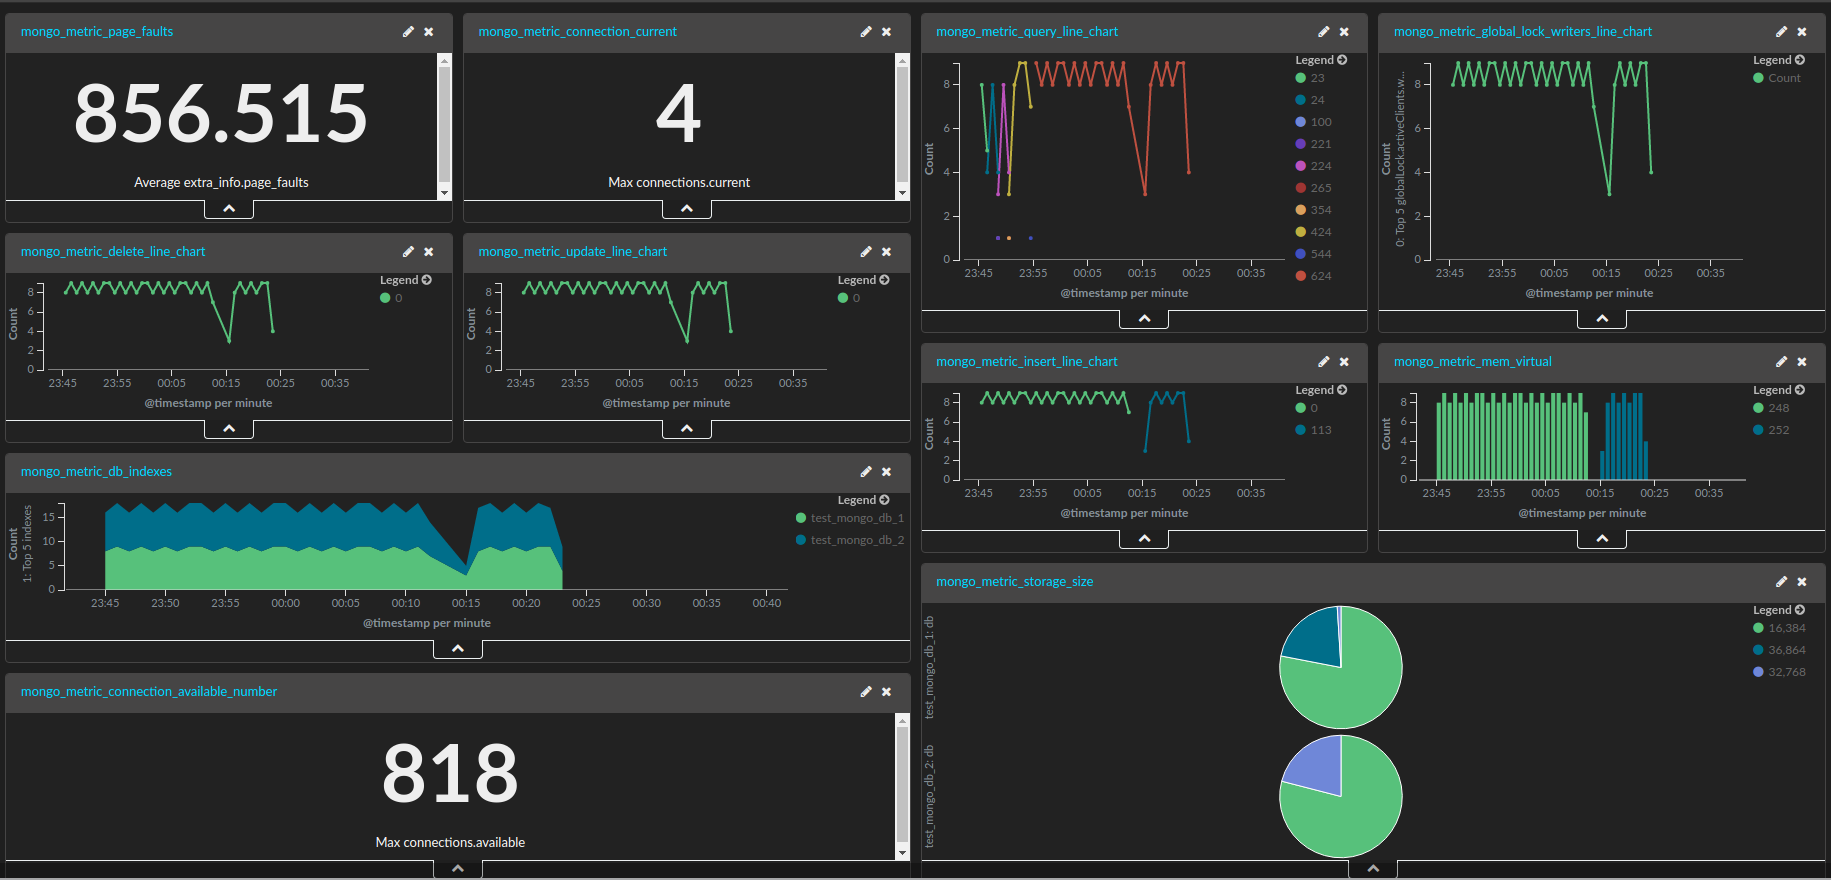
The final dashboard for MongoDB metrics
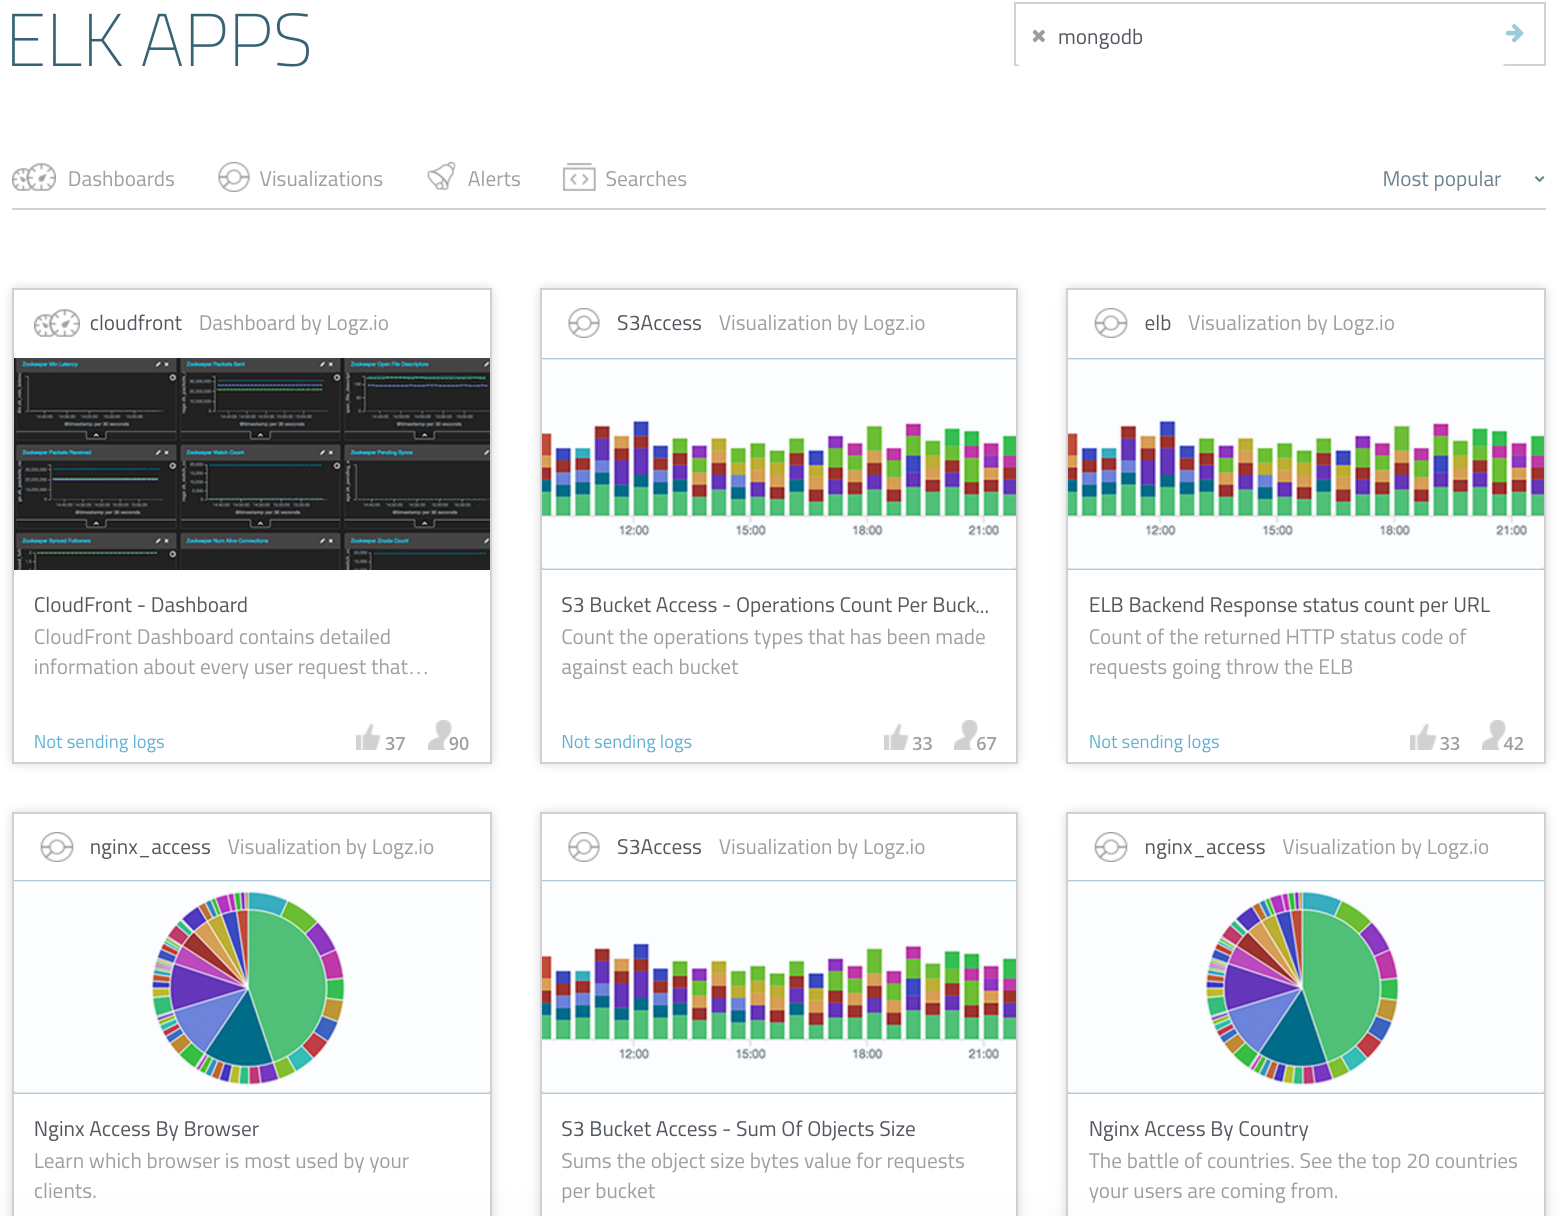
To help you to hit the ground running, we’ve added this dashboard to ELK Apps — our free library of ready-made visualizations and dashboards that can be installed in one click. Simply search for MongoDB in the ELK Apps page, and click to install.
Your job doesn’t necessarily stop there — set up alerts for the metrics that we have added here. Learn how to create alerts for the ELK Stack.
Logz.io is a predictive, cloud-based log management platform that is built on top of the open-source ELK Stack and can be used for log analysis, application monitoring, business intelligence, and more. Start your free trial today!
↧
The Cost of Doing the ELK Stack on Your Own

So, you’ve decided to go with ELK to centralize and manage your logs.
Wise decision.
The ELK Stack is now the world’s most popular log analysis platform, with millions of downloads per month. The platform’s open source foundation, scalability, speed, and high availability as well as the growing community of users are all excellent reasons for this decision. But before you go ahead and install Elasticsearch, Logstash and Kibana, there is one crucial question that you need to answer: Are you going to run the stack on your own, or are you going to opt for a cloud-hosted solution?
Jumping to the conclusion of this article, it all boils down to time and money. When contemplating whether to invest the valuable resources at your disposal in doing ELK on your own, you must ask yourself if you have the resources to pull it off.
This article will break down the variables that need to be added into the equation.
These variables reflect what a production deployment of ELK needs to include based on the extensive experience of both our customers and ourselves while working with ELK. Also, these recommendations are based on the assertion that you are starting from scratch and require a scalable, highly available, and at least medium-sized ELK deployment.
Installation and Shipping
Installing ELK is usually hassle-free. Getting up and running with your first instances of Elasticsearch, Logstash, and Kibana is pretty straightforward, and there is plenty of documentation available if you encounter issues during installation (see our Elasticsearch tutorial, Logstash tutorial, and Kibana tutorial for help).
However, connecting the dots is not always error-free. Depending on whether you decided to install the stack on a local, cloud, or hybrid infrastructure, you may encounter various configuration and networking issues. Kibana not connecting with Elasticsearch, Kibana not being able to fetch mapping, and Logstash not running or not shipping data are all-too-frequent occurrences. (For more, see my prior post on troubleshooting five common ELK Stack glitches.)
Once you’ve troubleshooted those issues, you need to establish a pipeline into the stack. This pipeline will greatly depend on the type of logs you want to ingest and the type of data source from which you are pulling the logs. You could be ingesting database logs, web server logs, or application logs. The logs could be coming in from a local instance, AWS, or Docker. Most likely, you will be pulling data from various sources. Configuring the integration and pipeline in Logstash can be complicated and extremely frustrating, and configuration errors can bring down your entire logging pipeline.
Parsing
It’s one thing to ship the logs into the stack. It’s another thing entirely to have them actually mean something. When trying to analyze your data, you need the messages to be structured in a way that makes sense.
That is where parsing comes into the picture, beautifying the data and enhancing it to allow you to analyze the various fields constructing the log message more easily.
Fine-tuning Logstash to use a grok filter on your logs correctly is an art unto itself and can be extremely time-consuming. Take the timestamp format, for example. Just search for “Logstash timestamp” on Google, and you will quickly be drowned in thousands of StackOverflow questions from people who are having issues with log parsing because of bad grokking.
Also, logs are dynamic. Over time, they change in format and require periodic configuration adjustments. This all translates into hours of work and money.
Mapping
Elasticsearch mapping defines the different types that reside within an index. It defines the fields for documents of a specific type — the data type (such as string and integer) and how the fields should be indexed and stored in Elasticsearch.
With dynamic mapping (which is turned on by default), Elasticsearch automatically inspects the JSON properties in documents before indexing and storage. However, if your logs change and you index documents with a different mapping, they will not be indexed by Elasticsearch. So, unless you monitor the Elasticsearch logs, you will likely not notice the resulting “MapperParsingException” error and thereby lose the logs rejected by Elasticsearch.
Scaling
You’ve got your pipeline set up, and logs are coming into the system. To ensure high availability and scalability, your ELK deployment must be robust enough to handle pressure. For example, an event occurring in production will cause a sudden spike in traffic, with more logs being generated than usual. Such cases will require the installation of additional components on top (or in front) of your ELK Stack.
For example, we recommend that you place a queuing system before Logstash. This ensures that bottlenecks are not formed during periods of high traffic and Logstash does not cave in during the resulting bursts of data.
Installing additional Redis or Kafka instances means more time and more money, and in any case you must make sure that these components will scale whenever needed. In addition, you will also need to figure out how and when to scale up your Logstash and Elasticsearch cluster manually.
Performance tuning
While built for scalability, speed, and high availability, the ELK Stack — as well as the infrastructure (server, OS, network) on which you chose to set it up — requires fine tuning and optimization to ensure high performance.
For example, you will want to configure the allocations for the different memory types used by Elasticsearch such as the JVM heap and OS swap. The number of indices handled by Elasticsearch affects performance, so you will want to make sure you remove or freeze old and unused indices.
Fine-tuning shard size, configuring partition merges for unused indices, and shard recovery in the case of node failure — these are all tasks that will affect the performance of your ELK Stack deployment and will require planning and implementation.
These are just a few examples of the grunt work that is required to maintain your own ELK deployment. Again, it is totally doable — but it can also be very resource-consuming.
Data retention and archiving
What happens to all of the data once ingested into Elasticsearch? Indices pile up and eventually — if not taken care of — will cause Elasticsearch to crash and lose your data. If you are running your own stack, you can either scale up or manually remove old indices. Of course, manually performing these tasks in large deployments is not an option, so use Elastic’s Curator or set up cron jobs to handle them.
Curation is quickly becoming a de-facto compliance requirement, so you will also need to figure out how to archive logs in their original formats. Archiving to Amazon S3 is the most common solution, but this again costs more time and money. Cloud-hosted ELK solutions such as our Logz.io platform provide this service as part of the bundle.
Handling upgrades
Handling an ELK Stack upgrade is one of the biggest issues you must consider when deciding whether to deploy ELK on your own. In fact, upgrading a large ELK deployment in production is so daunting a task that you will find plenty of companies that are still using extremely old versions.
When upgrading Elasticsearch, making sure that you do not lose data is the top priority — so you must pay attention to replication and data synchronization while upgrading one node at a time. Good luck with that if you are running a multi-node cluster! This incremental upgrade method is not even an option when upgrading to a major version (e.g. 1.7.3 to 2.0.0), which is an action that requires a full cluster restart.
Upgrading Kibana can be a serious hassle with plugins breaking and visualizations sometimes needing total rewrites.
Infrastructure
Think big. As your business grows, more and more logs are going to be ingested into your ELK Stack. This means more servers, more network usage, and more storage. The overall amount of computing resources needed to process all of this traffic can be substantial.
Log management systems consume huge amounts of CPU, network bandwidth, disk space, and memory. With sporadic data bursts being a frequent phenomenon — when an error takes place in production, your system with generate a large amount of logs — capacity allocation needs to follow suit. The underlying infrastructure needed can amount to tens of thousands of dollars per year.
Security
In many cases, your log data is likely to contain sensitive information about yourself, your customers, or both. Just as you expect your data to be safe, so do your customers. As a result, security features such as authorization and authentication are a must to protect both the logs coming into your ELK Stack specifically and the success of your business in general.
The problem is that the open source ELK Stack does not provide easy ways to implement data protection strategies. Ironically, ELK is used extensively for PCI compliance and SIEM but does not include security out of the box. If you are running your own stack, your options are not great. You could try to hack your own solution, but as far as I know there is no easy and fast way to do that. Or, you could opt for using Shield — Elastic’s security ELK add-on.
Conclusion
You’ve probably heard of Netflix, Facebook, and LinkedIn, right? All these companies are running their own ELK Stacks, as are thousands of other very successful companies. So, running ELK on your own is definitely possible. But as I put it at the beginning, it all boils down to the amount of resources at your disposal in terms of time and money.
I have highlighted the main pain points involved in maintaining an ELK deployment over the long term. But for the sake of brevity, I have omitted a long list of features that are missing in the open source stack and but are recommended for production-grade deployments. Some needed additions are user control and user authentication, alerting, and built-in Kibana visualizations and dashboards.
The overall cost of running your own deployment combined with the missing enterprise-grade features that are necessary in any modern centralized log management system make a convincing case for choosing a cloud-hosted ELK platform.
Or do you think you can pull it off yourself?
Logz.io is a predictive, cloud-based log management platform that is built on top of the open-source ELK Stack and can be used for log analysis, application monitoring, business intelligence, and more. Start your free trial today!
↧
↧
Drupal Log Analysis Tutorial

While most developers and DevOps teams will admit that logging is important, many will still insist on avoiding the task if possible. Although log files contain a wealth of valuable information and should therefore be the first place to look at when troubleshooting errors and events, they are often opened only as a last resort.
The reason for this is simple: Log files are not easy. They’re not easy to access, they’re not easy to collect, and they’re not easy to read. Often, they can’t even be found to start with. These problems have only intensified over the past few years, with applications being built on top of distributed infrastructures and containerized architectures.
Drupal applications add another layer of complexity to this, offering basic logging features for developers and being complex creatures to start with. Drupal developers can define the message type and the severity level (for example, “emergency” or “debug”) for logs and have the messages saved to the database. Drupal 8 also provides a logging class (that replaces Watchdog) to write custom logs to the database.
But for modern apps, querying the database for error messages and analyzing Drupal and PHP logs is not enough. There are web server and database logs to sift through as well, and in a normal sized production environment, this means a ton of data. No. A more solid solution is required that will allow you to centralize all of the streams of log data being generated by the app, query this data to identify correlations and anomalies, and monitor the environment for events.
Enter the ELK Stack. The most popular and fastest-growing open source log analytics platform, ELK allows you to build a centralized logging system that can pull logs from as many sources as you define and then analyse and visualise the data.
To show an example of using ELK, this article will go through the steps of establishing a pipeline of logs from your Drupal application into the Logz.io ELK Stack. You can, if you like, use any instance of the stack to perform the exact same procedure.
My environment
A few words on the environment I’m using for this tutorial. I’m using an AWS Ubuntu 14.04 instance and have installed Drupal 8 on top of the standard LAMP stack. For instructions on how to get this set up, I recommend reading this Cloud Academy post.
Note: You will need to install the GD extension because this is a minimum requirement for Drupal 8.
Preparing the log files
My first step is to prepare the log files that we want to track and analyze. In the case of a standard LAMP stack, this usually means web server logs, PHP error logs (which include Drupal errors as well), and MySQL logs.
PHP errors, such as undefined variables and unknown functions, are logged by default into the Apache error log file (/var/logs/apache2/error.log), which is convenient in some cases. But to make our analysis work easier, it’s better to separate the two log streams.
To do this, I’m going to access my ‘php.ini’ file and define a new path for PHP errors:
error_log=/var/log/php_errors.log
Next, I’m going to restart Apache and verify the change using phpinfo().
Installing Filebeat
While there are numerous ways to forward data into ELK, I’m going to ship my log files using Filebeat — which is a log shipper created by Elastic that tails defined log files and sends the traced data to Logstash or Elasticsearch.
To install Filebeat from the repository, I’m going to first download and install the Public Signing Key:
$ curl https://packages.elasticsearch.org/GPG-KEY-elasticsearch | sudo apt-key add -
Next, I’m going to save the repository definition to /etc/apt/sources.list.d/beats.list:
$ echo "deb https://packages.elastic.co/beats/apt stable main" | sudo tee -a /etc/apt/sources.list.d/beats.list
Finally, I’m going to run apt-get update and install Filebeat:
$ sudo apt-get update && sudo apt-get install filebeat
Now, since Logz.io uses TLS as an added security layer, my next step before configuring the data pipeline is to download a certificate and move it to the correct location:
$ wget http://raw.githubusercontent.com/cloudflare/cfssl_trust/master/intermediate_ca/COMODORSADomainValidationSecureServerCA.crt

$ sudo mkdir -p /etc/pki/tls/certs

$ sudo cp COMODORSADomainValidationSecureServerCA.crt /etc/pki/tls/certs/
Configuring Filebeat
My next step is to configure Filebeat to track my log files and forward them to the Logz.io ELK Stack. To demonstrate this configuration, I’m going to show how to define tracking for my PHP and Apache log files. (The process is similar for MySQL logs as well.)
In the Filebeat configuration file at /etc/filebeat/filebeat.yml, I’m going to define a prospector for each type of logs. I’m also going to add some Logz.io-specific fields (codec and user token) to each prospector.
The configuration is as follows:
################### Filebeat Configuration Example ############################

############################# Filebeat #####################################

filebeat:

 # List of prospectors to fetch data.

 prospectors:

   # This is a text lines files harvesting definition

   -

    paths:

      - /var/log/php_errors.log

    fields:

      logzio_codec: plain

      token: tWMKrePSAcfaBSTPKLZeEXGCeiVMpuHb

    fields_under_root: true

    ignore_older: 24h

    document_type: php

   -

   paths:

      - /var/log/apache2/*.log

   fields:

     logzio_codec: plain

     token: tWMKrePSAcfaBSTPKLZeEXGCeiVMpuHb

   fields_under_root: true

   ignore_older: 24h

   document_type: apache

   registry_file: /var/lib/filebeat/registry
In the Output section, I’m going to define the Logz.io Logstash host (listener.logz.io:5015) as the output destination for our logs and the location of the certificate used for authentication.
############################# Output ########################################

# Configure what outputs to use when sending the data collected by the beat.

output:

 logstash:

   # The Logstash hosts

   hosts: ["listener.logz.io:5015"]

   tls:

     # List of root certificates for HTTPS server verifications

     Certificate_authorities: ['/etc/pki/tls/certs/COMODORSADomainValidationSecureServerCA.crt']
Now, if I were using the open source ELK stack, I could ship directly to Elasticsearch or use my own Logstash instance. The configuration for either of these outputs in this case is straightforward:
Output:


  logstash:
    hosts: ["localhost:5044"]

 Elasticsearch:

   hosts: ["localhost:9200"]
Save your Filebeat configuration.
Beautifying the PHP logs
Logstash, the component of the ELK Stack that is in charge of parsing the logs before forwarding them to Elasticsearch, can be configured to manipulate the data to make the logs more readable and easier to analyze (a.k.a., log “beautification” or “enhancement”).
In this case, I’m going to use the grok plugin to parse the PHP logs. If you’re using Logz.io, grokking is done by us. But if you’re using the open source ELK, you can simply apply the following configuration directly to your Logstash configuration file (/etc/logstash/conf.d/xxxx.conf):
if [type] == "php" {

   grok {

      match => [

         "message", "\[%{MONTHDAY:day}-%{MONTH:month}-%{YEAR:year} %{TIME:time} %{WORD:zone}\] PHP %{DATA:level}\:  %{GREEDYDATA:error}"

         ]

   }


   mutate {

      add_field => [ "timestamp", "%{year}-%{month}-%{day} %{time}" ]

      remove_field => [ "zone", "month", "day", "time" ,"year"]

   }

   date {

      match => [ "timestamp" , "yyyy-MMM-dd HH:mm:ss" ]

      remove_field => [ "timestamp" ]

   }

}
Verifying the pipeline
It’s time to make sure the log pipeline into ELK is working as expected.
First, make sure Filebeat is running:
$ cd /etc/init.d

$ ./filebeat status
And if not, enter:
$ sudo ./filebeat start
Next, open up Kibana (integrated into the Logz.io user interface). Apache logs and PHP errors will begin to show up in the main display area.
In this case, we’re getting an undefined variable error that I have simulated by editing the ‘index.php’ file. Note that since I have other logs coming into my system from other data sources, I’m using the following Kibana query to search for the two log types we have defined in Filebeat:
type:php OR type:apache
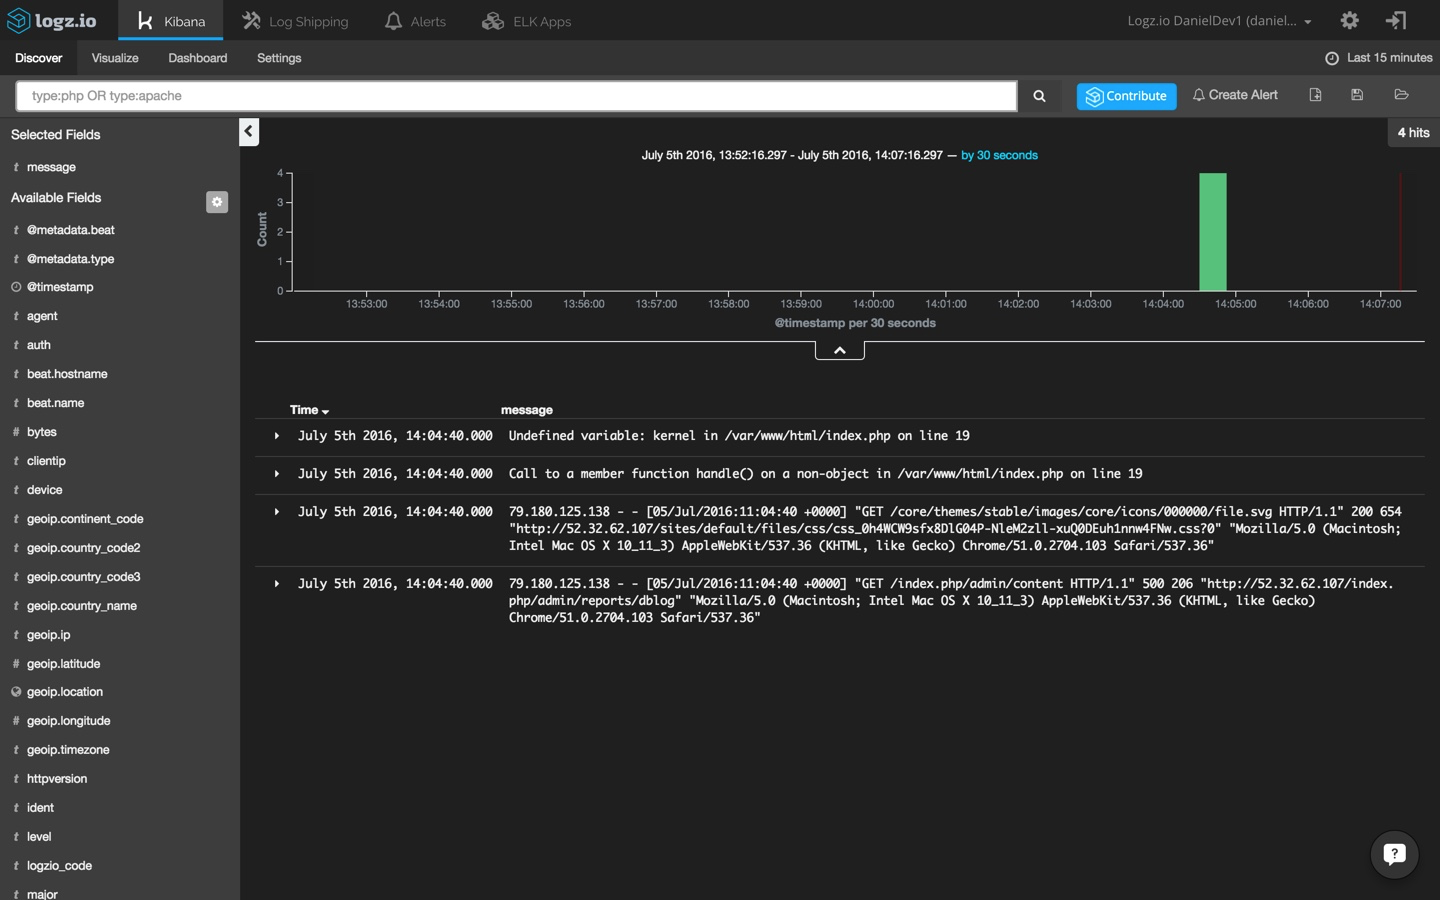
Analyzing the logs
To start making sense of the data being ingested and indexed by Elasticsearch, I’m going to select one of the messages in the main display area — this will give me an idea of what information is available.
Now, remember the different types that we defined for the Filebeat prospectors? To make the list of log messages more understandable, select the ‘type’, ‘response’, and ‘level’ fields from the list of mapped fields on the left. These fields were defined in the grok pattern that we applied to the Logstash configuration.

Open one of the messages and view the information that has been shipped into the system:
{
   "_index": "logz-dkdhmyttiiymjdammbltqliwlylpzwqb-160705_v1",
   "_type": "php",
   "_id": "AVW6v83dflTeqWTS7YdZ",
   "_score": null,
   "_source": {
      "level": "Notice",
      "@metadata": {
         "beat": "filebeat",
         "type": "php"
      },
      "source": "/var/log/php_errors.log",
      "message": "Undefined variable: kernel in /var/www/html/index.php on line 19",
      "type": "php",
      "tags": [
         "beats-5015"
      ],
      "@timestamp": "2016-07-05T11:09:39.000Z",
      "zone": "UTC",
      "beat": {
         "hostname": "ip-172-31-37-159",
         "name": "ip-172-31-37-159"
      },
      "logzio_code": "plain"
   },
   "fields": {
      "@timestamp": [
         1467716979000
      ]
   },
   "highlight": {
      "type": [
         "@kibana-highlighted-field@php@/kibana-highlighted-field@"
      ]
   },
   "sort": [
      1467716979000
   ]
}
Visualizing the logs
One of the advantages of using the ELK Stack is its ability to create visualizations on top the data stored on Elasticsearch. This allows you to create monitoring dashboards that can be used to efficiently keep tabs on your environment.
As an example, I’m going to create a line chart that shows the different PHP and Drupal errors being logged over time.
Selecting the Visualize tab in Kibana, I’m going to pick the line chart visualization type from the selection of available visualizations. Then, I’m going to select to create the visualization based on a new search and use this query to search for PHP and Drupal events only: ‘type:php’.
All that’s left now is to configure the visualization. Easier said than done, right? The truth is that creating visualizations in Kibana can be complicated at times and takes some trial and error testing before fine-tuning it to get the best results.
We’re going to keep it simple. We’re using a simple count aggregation for the Y-axis and a date histogram cross referenced with the ‘level’ field.
The configuration for our line chart visualization looks as follows:
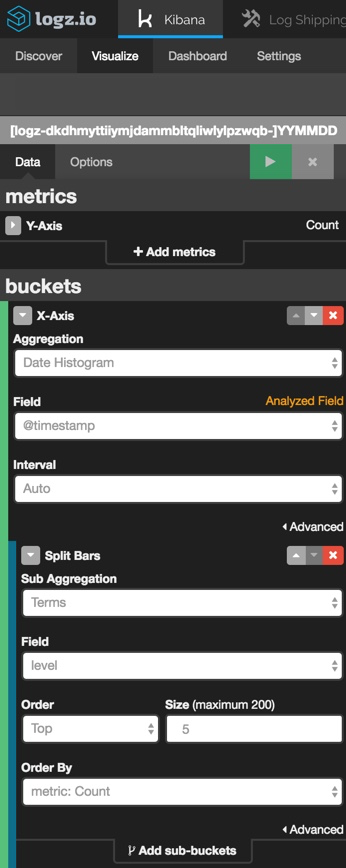
Hit the green Play button to see a preview of the visualization:
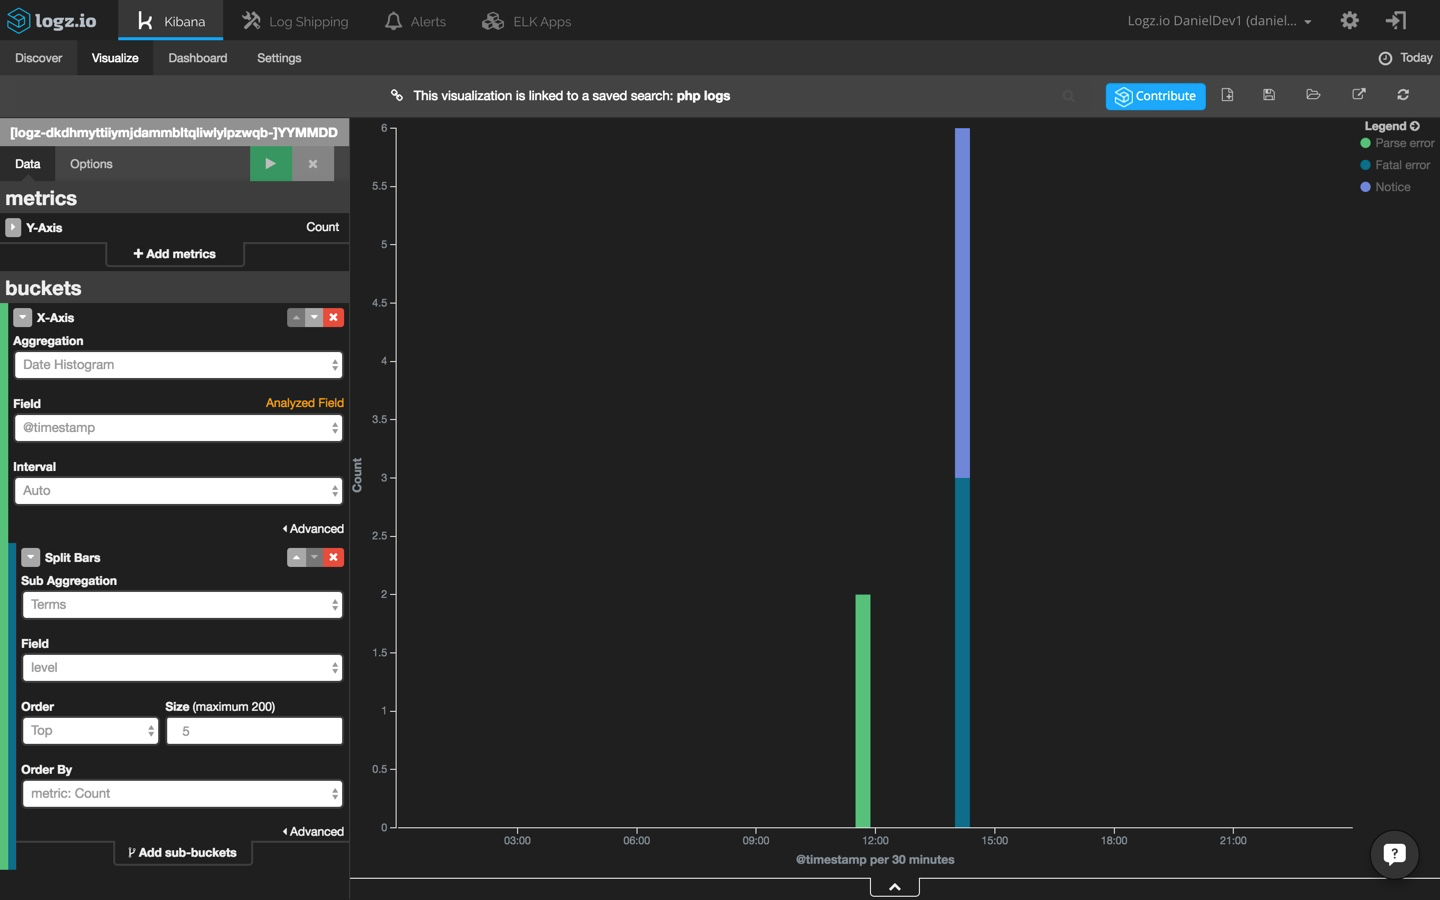
A common visualization for web application environments is a map of web server requests. This gives you a general picture of where requests are coming from (and in this case, from where yours truly is writing this post).
Selecting the Tile Map visualization this time, I’m going to change my Kibana query to:
type:apache
Then, the configuration is simple:
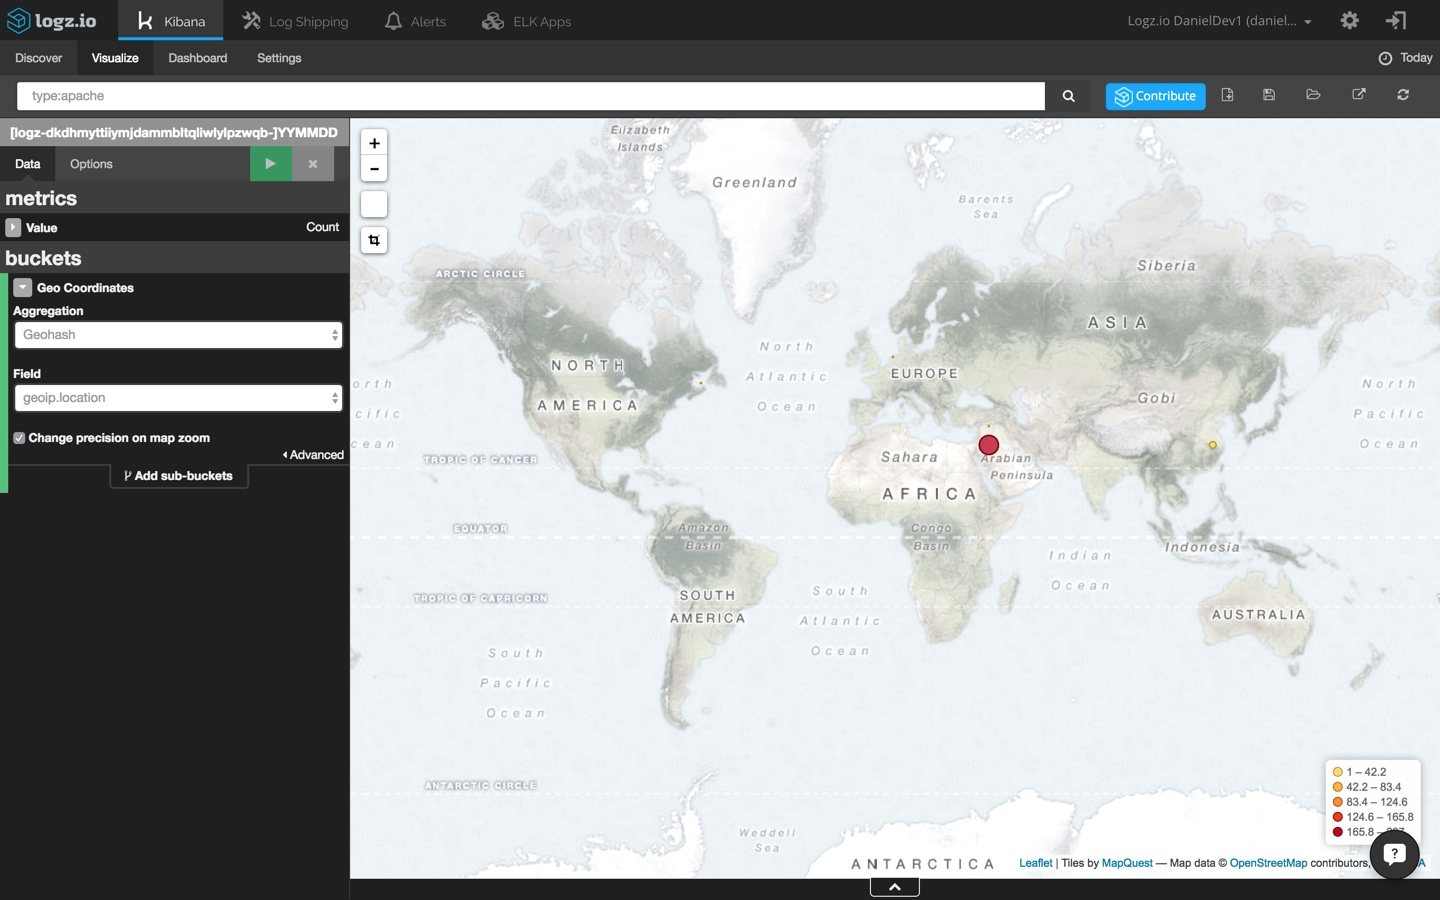
Of course, these are merely basic demonstrations of how to visualize your log data in Kibana and how ELK can be used to analyze and monitor Drupal applications. The sky’s the limit. You can build much more complex visualizations and even create your own custom Kibana visualization type if you like.
Once you have a series of visualizations for monitoring your Drupal app, you can collect them in a dashboard giving you a general overview of your environment.
Logz.io is a predictive, cloud-based log management platform that is built on top of the open-source ELK Stack and can be used for log analysis, application monitoring, business intelligence, and more. Start your free trial today!
↧
How to Install the ELK Stack on Google Cloud Platform

In this article, I will guide you through the process of installing the ELK Stack (Elasticsearch 2.2.x, Logstash 2.2.x and Kibana 4.4.x) on Google Cloud Platform (GCP).
While still lagging far behind Amazon Web Services, GCP is slowly gaining popularity, especially among early adopters and developers but also among a number of enterprises. Among the reasons for this trend are the full ability to customize virtual machines before provisioning them, positive performance benchmarking compared to other cloud providers, and overall reduced cost.
These reasons caused me to test the installation of the world’s most popular open source log analysis platform, the ELK Stack, on this cloud offering. The steps below describe how to install the stack on a vanilla Ubuntu 14.04 virtual machine and establish an initial pipeline of system logs. Don’t worry about the costs of testing this workflow — GCP offers a nice sum of $300 for a trial (but don’t forget to delete the VM once you’re done!).
Setting up your environment
For the purposes of this article, I launched an Ubuntu 14.04 virtual machine instance in GCP’s Compute Engine. I enabled HTTP/HTTPS traffic to the instance and changed the default machine type to 7.5 GB.
Also, I created firewall rules within the Networking console to allow incoming TCP traffic to Elasticsearch and Kibana ports 9200 and 5601 respectively.

Installing Java
All of the packages we are going to install require Java, so this is the first step we’re going to describe (skip to the next step if you’ve already got Java installed).
Use this command to install Java:
$ sudo apt-get install default-jre
Verify that Java is installed:
$ java -version
If the output of the previous command is similar to this, you’ll know that you’re on track:
java version "1.7.0_101"OpenJDK Runtime Environment (IcedTea 2.6.6) (7u101-2.6.6-0ubuntu0.14.04.1)OpenJDK 64-Bit Server VM (build 24.95-b01, mixed mode)
Installing Elasticsearch
Elasticsearch is in charge of indexing and storing the data shipped from the various data sources, and can be called the “heart” of the ELK Stack.
To begin the process of installing Elasticsearch, add the following repository key:
$ wget -qO - https://packages.elastic.co/GPG-KEY-elasticsearch | sudo apt-key add -
Add the following Elasticsearch list to the key:
$ echo "deb http://packages.elastic.co/elasticsearch/1.7/debian stable main" | sudo tee -a /etc/apt/sources.list.d/elasticsearch-1.7.list

$ sudo apt-get update
And finally, install:
$ sudo apt-get install elasticsearch
Before we start the service, we’re going to open the Elasticsearch configuration file and define the host on our network:
$ sudo vi /etc/elasticsearch/elasticsearch.yml
In the Network section of the file, locate the line that specifies the ‘network.host’, uncomment it, and replace its value with “0.0.0.0”:
network.host: 0.0.0.0
Last but not least, restart the service:
$ sudo service elasticsearch restart
To make sure that Elasticsearch is running as expected, issue the following cURL:
$ curl localhost:9200
If the output is similar to the output below, you will know that Elasticsearch is running properly:
{
   "name" : "Hannah Levy",
   "cluster_name" : "elasticsearch",
   "version" :
      {     "number" : "2.3.4",
             "build_hash" : "e455fd0c13dceca8dbbdbb1665d068ae55dabe3f",
             "build_timestamp" : "2016-06-30T11:24:31Z",
             "build_snapshot" : false,
             "lucene_version" : "5.5.0"
         },
   "tagline" : "You Know, for Search"
}
Production tip: DO NOT open any other ports, like 9200, to the world! There are bots that search for 9200 and execute groovy scripts to overtake machines.
Logstash Installation
Moving on, it’s time to install Logstash — the stack’s log shipper.
Using Logstash to parse and forward your logs into Elasticsearch is, of course, optional. There are other log shippers that can output to Elasticsearch directly, such as Filebeat and Fluentd, so I would recommend some research before you opt for using Logstash.
Since Logstash is available from the same repository as Elasticsearch and we have already installed that public key in the previous section, we’re going to start by creating the Logstash source list:
$ echo 'deb http://packages.elastic.co/logstash/2.2/debian stable main' | sudo tee /etc/apt/sources.list.d/logstash-2.2.x.list
Next, we’re going to update the package database:
$ sudo apt-get update
Finally — we’re going to install Logstash:
$ sudo apt-get install logstash
To start Logstash, execute:
$ sudo service logstash start
And to make sure Logstash is running, use:
$ sudo service logstash status
The output should be:
logstash is running
We’ll get back to Logstash later to configure log shipping into Elasticsearch.
Kibana Installation
The process for installing Kibana, ELK’s pretty user interface, is identical to that of installing Logstash.
Create the Kibana source list:
$ echo "deb http://packages.elastic.co/kibana/4.4/debian stable main" | sudo tee -a /etc/apt/sources.list.d/kibana-4.4.x.list
Update the apt package database:
$ sudo apt-get update
Then, install Kibana with this command:
$ sudo apt-get -y install kibana
Kibana is now installed.
We now need to configure the Kibana configuration file at /opt/kibana/config/kibana.yml:
$ sudo vi /opt/kibana/config/kibana.yml
Uncomment the following lines:
server.port: 5601
 server.host: “0.0.0.0”
Last but not least, start Kibana:
$ sudo service kibana start
You should be able to access Kibana in your browser at http://<serverIP>:5601/ like this:

By default, Kibana connects to the Elasticsearch instance running on localhost, but you can connect to a different Elasticsearch instance instead. Simply modify the Elasticsearch URL in the Kibana configuration file that we had edited earlier (/opt/kibana/config/kibana.yml) and then restart Kibana.
If you cannot see Kibana, there is most likely an issue with GCP networking or firewalls. Please verify the firewall rules that you defined in GCP’s Networking console.
Establishing a pipeline
To start analyzing logs in Kibana, at least one Elasticsearch index pattern needs to be defined (you can read more about Elasticsearch concepts) — and you will notice that since we have not yet shipped any logs, Kibana is unable to fetch mapping (as indicated by the grey button at the bottom of the page).
Our last and final step in this tutorial is to establish a pipeline of logs, in this case system logs, from syslog to Elasticsearch via Logstash.
First, create a new Logstash configuration file:
$ sudo vim /etc/logstash/conf.d/10-syslog.conf
Use the following configuration:
input {
   file {
      type => “syslog”
      path => [  “/var/log/messages”, “/var/log/*.log”]
   }
}
filter {}
output {
   stdout {
      codec => rubydebug
   }
   elasticsearch {
      hosts => “localhost”
   }
}
A few words on this configuration.
Put simply, we’re telling Logstash to store the local syslog file ‘/var/log/syslog’ and all the files under ‘/var/log*.log’ on Elasticsearch.
The input section specifies which files to collect (path) and what format to expect (syslog). The output section uses two outputs – stdout and elasticsearch.
I left the filter section empty in this case, but usually this is where you would define rules to beautify the log messages using Logstash plugins such as grok. Learn more about Logstash grokking.
The stdout output is used to debug Logstash, and the result is nicely-formatted log messages under ‘/var/log/logstash/logstash.stdout’. The Elasticsearch output is what actually stores the logs in Elasticsearch.
Please note that in this example I am using ‘localhost’ as the Elasticsearch hostname. In a real production setup, however, it is recommended to have Elasticsearch and Logstash installed on separate machines so the hostname would be different.
Next, run Logstash with this configuration:
$ /opt/logstash/bin/logstash -f /etc/logstash/conf.d/10-syslog.conf
You should see JSON output in your terminal indicating Logstash is performing as expected.
Refresh Kibana in your browser, and you’ll notice that the Create button is now green, meaning Kibana has found an Elasticsearch index. Click it to create the index and select the Discover tab.
Your logs will now begin to appear in Kibana:

Last, but not least
Installing ELK on GCP was smooth going — even easy — compared to AWS. Of course, as my goal was only to test installation and establish an initial pipeline. I didn’t stretch the stack to its limits. Logstash and Elasticsearch can cave under heavy loads, and the challenge, of course, is scaling and maintaining the stack on the long run. In a future post, I will compare the performance of ELK on GCP versus AWS.
Logz.io is a predictive, cloud-based log management platform that is built on top of the open-source ELK Stack and can be used for log analysis, application monitoring, business intelligence, and more. Start your free trial today!
↧
CloudFront Log Analysis Using the Logz.io ELK Stack

Content Delivery Networks (CDNs) play a crucial role in how the Web works today by allowing application developers to deliver content to end users with high levels of availability and performance.
Amazon Web Services users commonly use CloudFront — Amazon’s global CDN service that distributes content across 54 AWS edge locations (PoP).
CloudFront provides the option to create log files that contain detailed information on every user request that it receives. However, the volume, variety, and speed at which CloudFront generates log files presents a significant challenge for detecting and mitigating CDN performance issues.
To overcome this challenge, a more complete and comprehensive logging solution is necessary in which the data can be centralized and analyzed with ease and speed. AWS monitoring services such as CloudTrail and CloudWatch allow you to access the CloudFront logging data, so one option is to integrate these services with a dedicated log management system.
In this guide, we will describe how to use the Logz.io cloud-based ELK-as-a-Service to integrate with CloudFront logs and analyze application traffic. The ELK Stack (Elasticsearch, Logstash, and Kibana) is the world’s most popular open source log analysis platform and is ideal for Big Data storage and analysis.
Note, to follow the steps described here, you will need AWS and Logz.io accounts as well as some basic knowledge of AWS architecture.
Understanding the logging pipeline
Before we start, a few words on the logging process that we will employ to log CloudFront with the ELK Stack.
As shown in the diagram below, when a user requests a web page, the content is delivered from the nearest edge location. Each user request is logged in a predefined format that contains all of the requested information. We will then store all of the generated logs in an S3 bucket and configure our Logz.io account so that the data will ship into the ELK Stack for analysis.
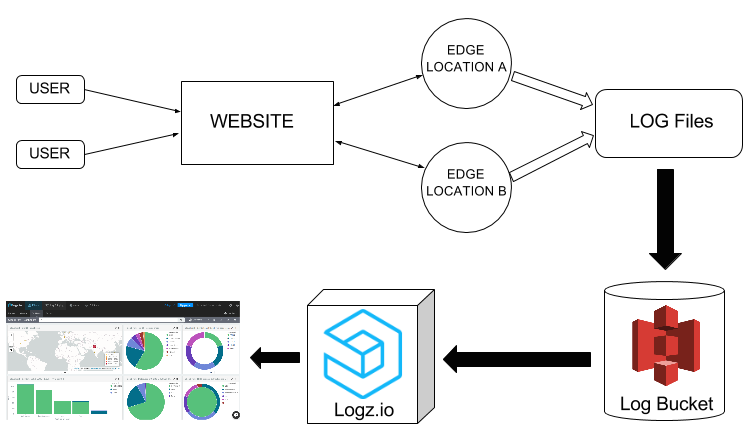
Workflow of log generation and shipping to Logz.io
CloudFront Web Distributions and Log Types
We’re almost there. But before we dive into the tutorial, it’s important to understand how CloudFront distributes content.
CloudFront replicates all files (from either an Amazon S3 bucket or any other content repository) to local servers at the edge locations. Using geo-aware DNS, Amazon CloudFront serves users from the nearest server to them.
The content gets organized into web distributions in which each one has a unique CloudFront.net domain name that is used to access the content objects (such as media files, images, and videos) using the network of edge locations across the globe.
To create a CloudFront web distribution, you can use the CloudFront console. In the console, you will need to specify your origin server that stores the original version of the objects.
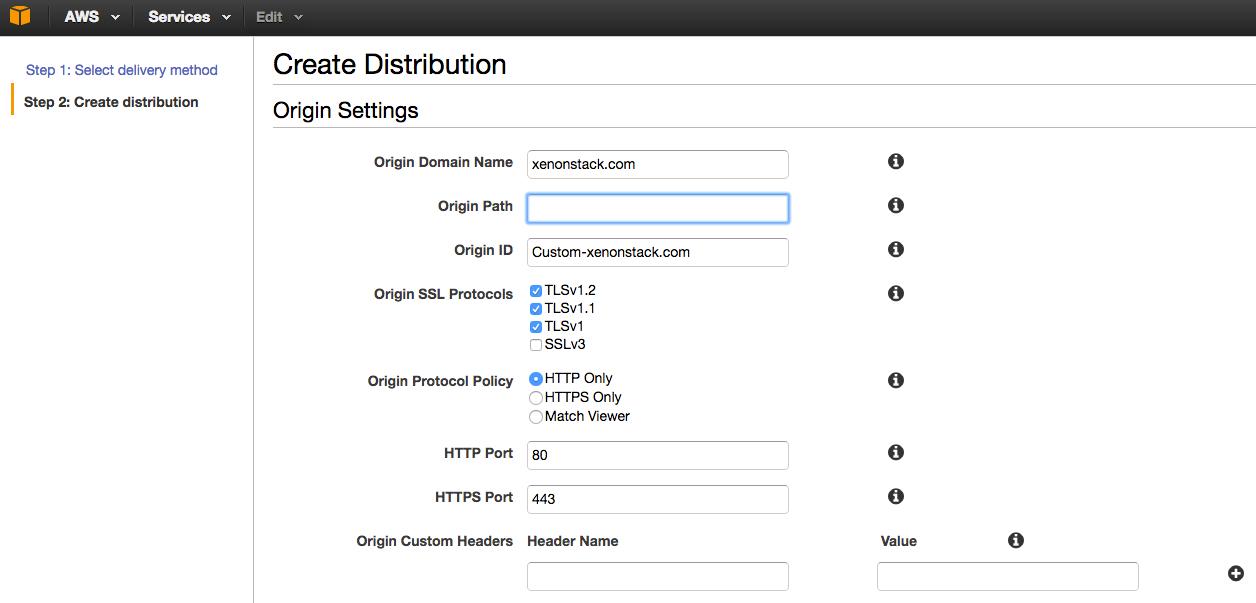
Create a CloudFront distribution
This origin server can be an Amazon S3 bucket or a traditional web server. For example, if you’re using S3 as your origin server, you would need to supply the origin path in the format “yourbucketname.s3.amazonaws.com”.
You will then need to specify Cache Behavior Settings that will let you configure a variety of CloudFront functionalities for a given URL path pattern for pages on your website.
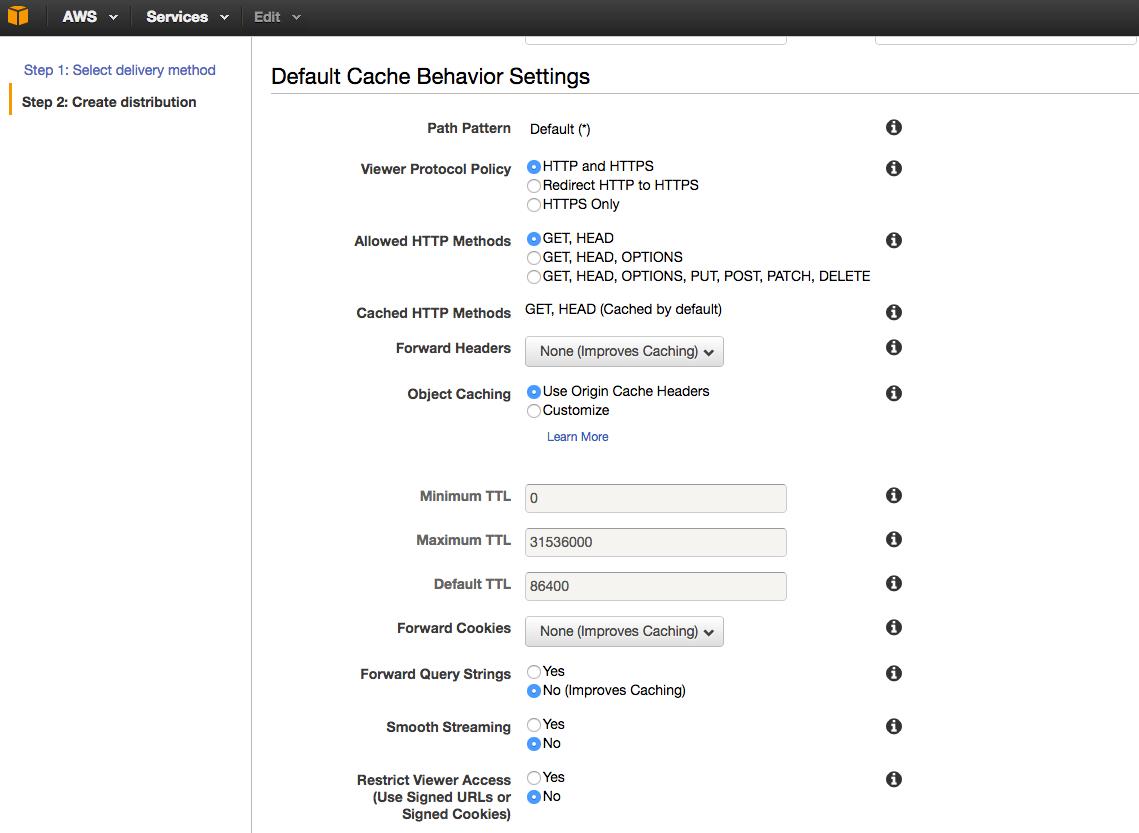
Default cache behavior settings
Where necessary, you’ll also have to define your SSL Certificate and Alternate Domain Names (CNAMEs). You can read more here for further details on setting up a web distribution.
CloudFront Access Log Types
Web Distributions are used to serve static and dynamic content such as .html, .css, .php, and image files using HTTP or HTTPS. Once you’ve enabled CloudFront logging, each entry in a log file will supply details about a single user request. These logs are formatted in the W3C extended log file format.
There are two types of logs: Web Distribution and RTMP Distribution logs.
Web Distribution Logs
Each entry in a log file provides information about a specific user request. It comprises 24 fields that describe that request, as served through CloudFront. These fields include data such as date, time, x-edge-location, client-ip and cs-method. We can use, for example, the edge-location and client-ip to visualize the locations of the IP addresses in real time for proper traffic analysis.
RTMP Distribution Logs
RTMP (Real-Time Messaging Protocol) distributions are used for streaming media files with Adobe Media Server and the Adobe RTMP. The log fields in the RTMP distribution include playback events such as connect, play, pause, stop, and disconnect. These logs are generated each time that a user watches a video, and include stream name and stream ID fields.
If you want to learn more about CloudFront Access Logs then you can find detailed information in the AWS documentation.
Step-by-Step Guide
Now that we’ve learned a bit about how CloudFront works, it’s time to get down to business.
1. Enabling CloudFront Logging
To generate your user request logs, you’ll have to enable logging in CloudFront and specify the Amazon S3 bucket in which you want CloudFront to save your files (as shown below).
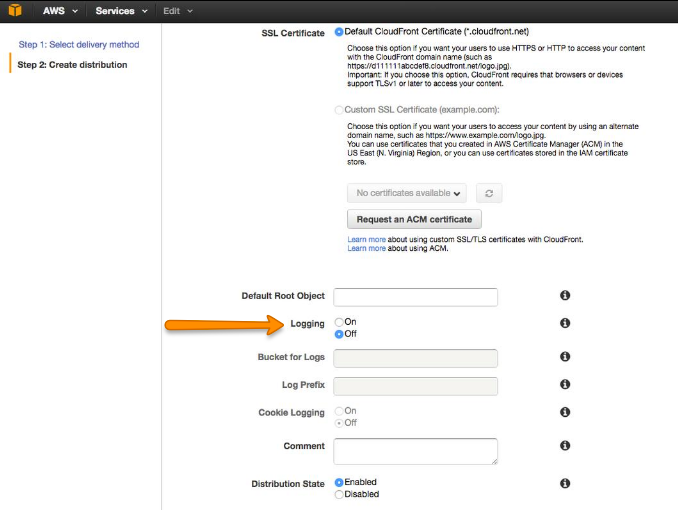
The logging radio button in your CloudFront distribution settings
You can also log several distributions into the same bucket. To distinguish logs from multiple distributions, you can specify an optional prefix for the file names.
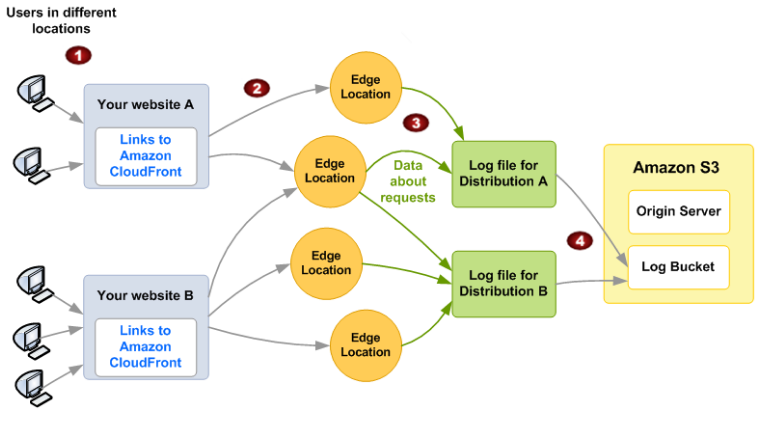
How CloudFront logs information about requests for your objects (image source: AWS)
2. Allowing Log Data Access
To allow the ELK stack to access the log data in your S3 bucket, your AWS user must define Amazon’s S3 FULL_CONTROL permission for the bucket. To do this, you should specify an IAM policy for the user along the lines of the following:
{
   "Version": "2012-10-17",
   "Statement": [
      {
      "Effect": "Allow",
      "Action": [
         "s3:ListBucket"
      ],
      "Resource": [
         "arn:aws:s3:::<BUCKET_NAME>"
      ]
   },
   {
      "Effect": "Allow",
      "Action": [
      "s3:GetObject"
   ],
   "Resource": [
      "arn:aws:s3:::<BUCKET_NAME>/*"
   ]
 }
]
}
Then, insert the code into the policy document in your AWS console to create this IAM policy:
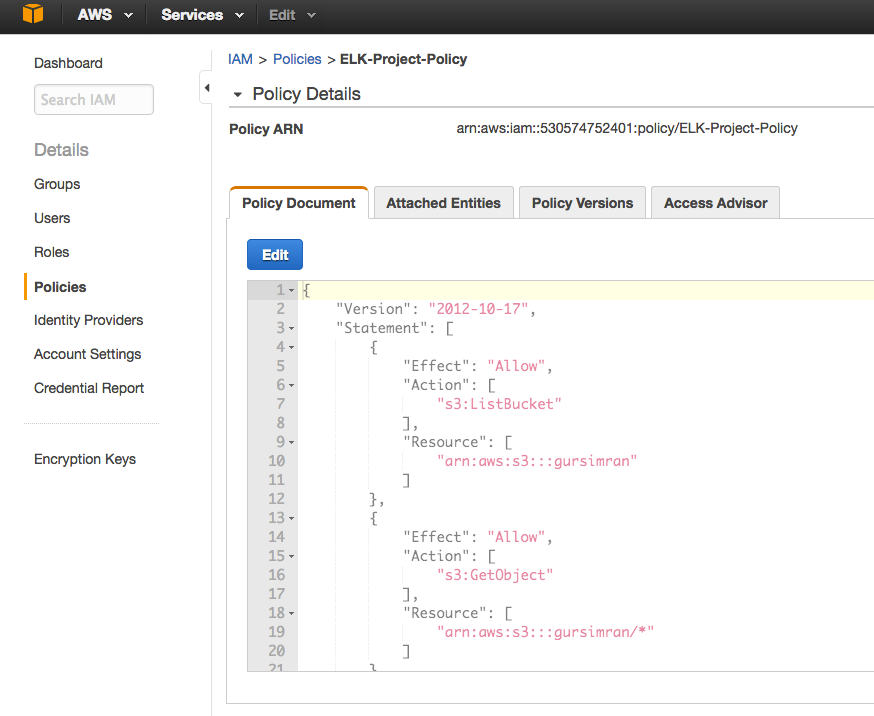
How to create a policy in IAM
If you’re having trouble getting logs from S3, just follow this troubleshooting guide.
3. Shipping Logs from S3 to Logz.io
Once you’ve made sure that CloudFront logs are being written to your S3 bucket, the process for shipping those logs into Logz.io is simple.
First, log into your Logz.io account and open the Log Shipping tab. Then, go to the AWS section and select “S3 Bucket.”
Next, enter the details of the S3 bucket from which you’d like to ingest log files. As shown below, enter your bucket information into the appropriate fields and make sure that for log types, you select “other” in the dropdown and type “cloudfront.”
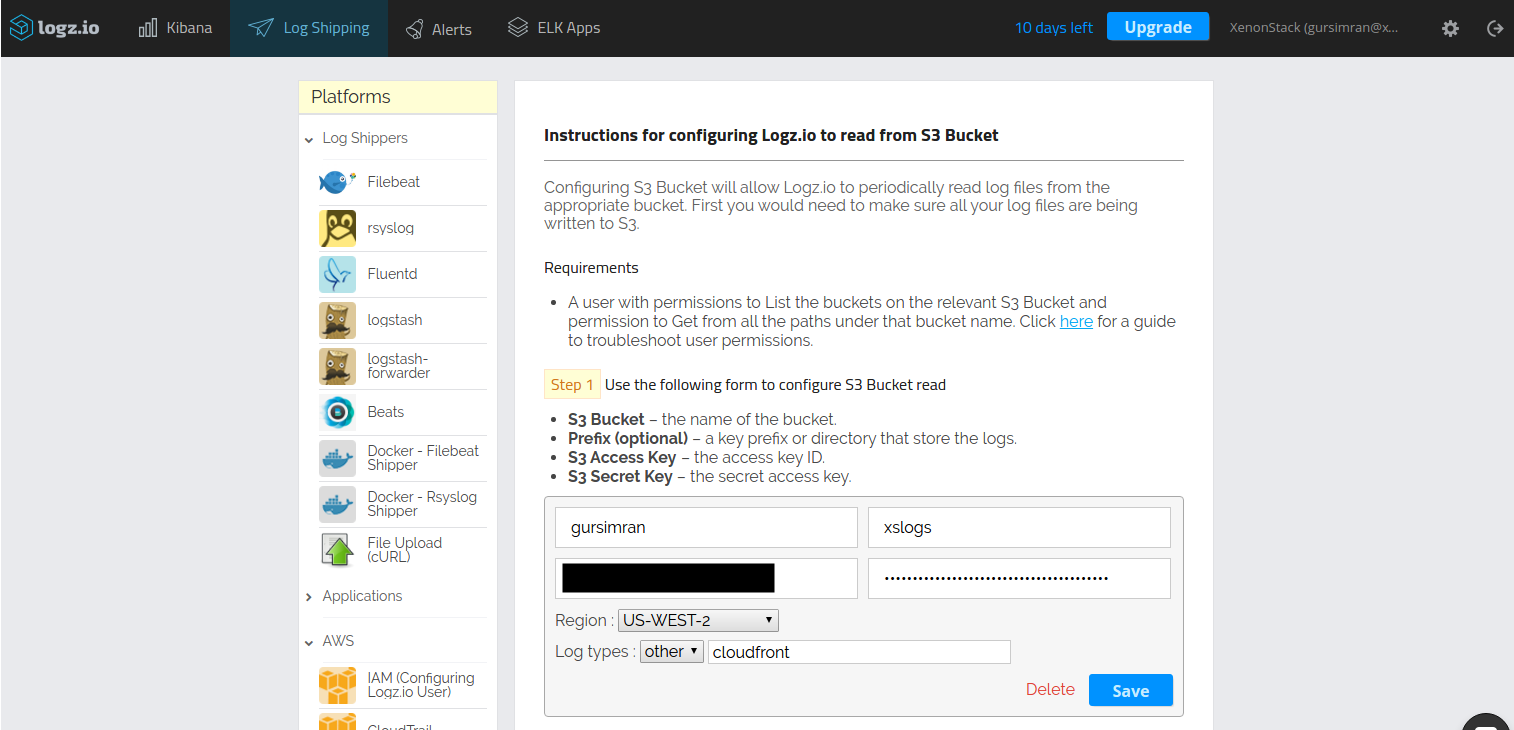
How to configure Logz.io to read from an S3 bucket
4. Building your Dashboard
When you open Kibana, you should be able to see CloudFront log data displayed:
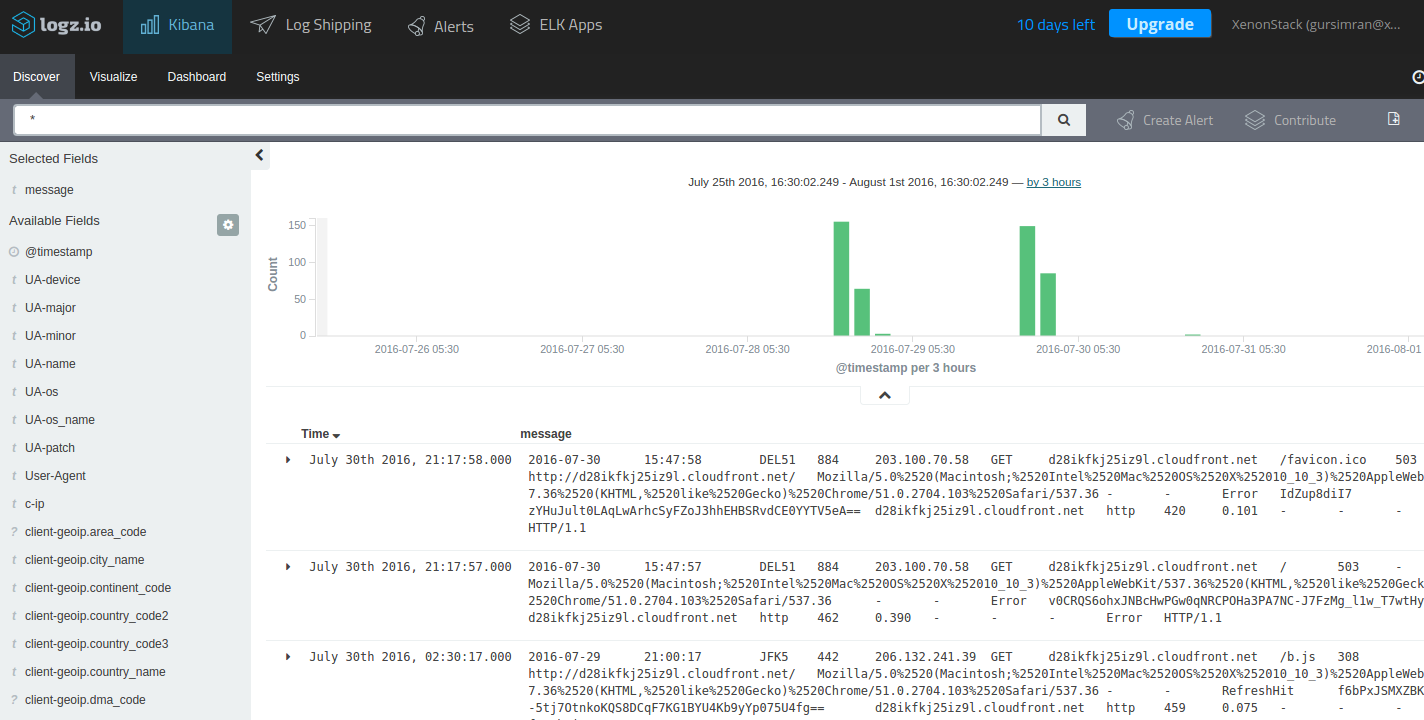
The Kibana discover tab
If you do not see any log data, it may be because the default logs interval is too short. However, you can adjust to a larger interval, if necessary.
Once you can see your logs, you can query them by typing a search in the query bar (more about querying Kibana in this video).
The Logz.io cloud-based ELK Stack comes with a number of handy additional features. One of these is ELK Apps, which is a free library of predefined searches, visualizations, and dashboards tailored for specific log analytics use cases — including CloudFront logs.
To install the CloudFront dashboard, simply search for ‘CloudFront’ on the ELK Apps page and hit the Install button. Once installed, you will be able to set up and use an entire CloudFront monitoring dashboard within seconds:

The CloudFront dashboard
In this dashboard, for example, you can visualize the different locations from where your website was accessed:
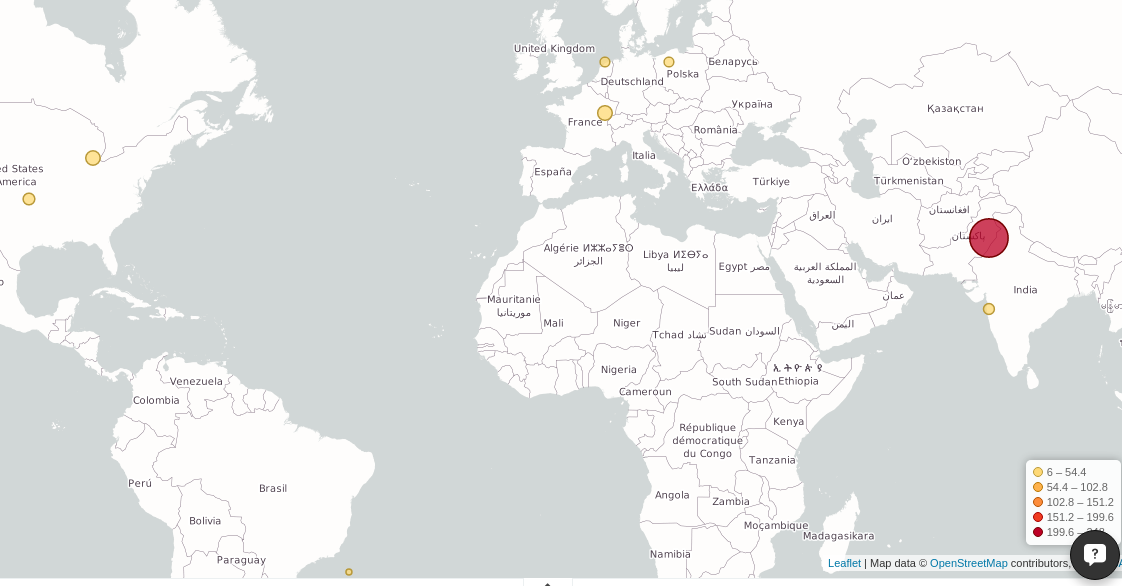
A geographic visualization showing the locations from where your website is accessed
It also provides a pie chart breakdown of your top 10 request origins and the protocols used for access as well as edge locations from where those requests were processed.
These are just a few simple examples of the available information. In total, there are twenty-four indexed fields with information that you can use to create visualizations to monitor your CloudFront logs.
A Final Note
CDNs have complex network footprints, so management and logging are crucial. However, not every developer has the option to collect all this data into an organized and digestible form. AWS provides a relatively simple way to use a CDN service, and combined with Logz.io, virtually any business can monitor their website traffic.
Logz.io is a predictive, cloud-based log management platform that is built on top of the open-source ELK Stack and can be used for log analysis, application monitoring, business intelligence, and more. Start your free trial today!
↧
Windows Event Log Analysis with Winlogbeat & Logz.io

Windows event logs contain a wealth of information about Windows environments and are used for multiple purposes. System administrators and IT managers can use event logs to monitor network activity and application behavior. Event logs can be extremely valuable resources for security incident detection by InfoSec teams when they are ensuring compliance with regulatory requirements such as SOX, HIPAA, and PCI.
Although it is easy enough to configure and view the information logged on Windows systems, it is not as easy to search and analyze that information properly simply because of the large volume of data that is usually involved.
That’s where the ELK Stack can come in handy. It’s designed for Big Data ingestion and fast analysis of log messages. The ability to use Kibana visualizations and dashboards is a huge benefit and another reason that ELK has become the preferred weapon of choice when logging Windows.
This post will describe how to ship event logs into the Logz.io ELK Stack using Winlogbeat.
Winlogbeat is a member of Elastic’s Beats product line — a family of different log shippers, each meant for different purposes (see our posts on using Filebeat, Topbeat and Packetbeat) — and as its name implies, ships Windows event logs to the ELK Stack.
Using Windows APIs, Winlogbeat tracks event logs such as application events, hardware events, security events, and system events), filters the events according to user instructions, and forwards the output to either Elasticsearch or Logstash.
Installing Winlogbeat
Download Winlogbeat 5.0.0-alpha4 from Elastic’s Downloads page and extract the package into C:\Program Files (for the sake of convenience, rename the winlogbeat-<version> directory to Winlogbeat).
Then, install Winlogbeat by opening PowerShell as Administrator and running the following command to set the execution policy for the current session to allow the installation script to run:
cd 'C:\Program Files\Winlogbeat'

PowerShell.exe -ExecutionPolicy UnRestricted -File .\install-service-winlogbeat.ps1
Then, install using:
.\install-service-winlogbeat.ps1
You should get the following output:
Status   Name               DisplayName

------   ----               -----------

Stopped  winlogbeat         winlogbeat
Winlogbeat configuration options
Winlogbeat has a number of configuration options that are worth mentioning before configuring our specific logging pipeline. These configurations are made in the Winlogbeat configuration file at C:\Program Files\Winlogbeat\winlogbeat.yml.
First, in the ‘Winlogbeat specific options’ section, you can define which specific event logs you want to monitor. By default, Winlogbeat is set to monitor application, security, and system logs.
A tip: If you’re not sure which event logs are available, just run Get-EventLog * in PowerShell. You should get an output like this:
Max(K) Retain OverflowAction        Entries Log

------ ------ --------------        ------- ---

20,480      0 OverwriteAsNeeded         386 Application

10,240      0 OverwriteAsNeeded          31 EC2ConfigService

20,480      0 OverwriteAsNeeded           0 HardwareEvents

   512      7 OverwriteOlder              0 Internet Explorer

20,480      0 OverwriteAsNeeded           0 Key Management Serv

20,480      0 OverwriteAsNeeded       1,724 Security

20,480      0 OverwriteAsNeeded         929 System

15,360      0 OverwriteAsNeeded          39 Windows PowerShell
Next, in the General section of the configuration file, you can add the name of the log shipper that is publishing the network data (the name is used for grouping data with a single name identifier). You can also add additional fields to the log messages such as application_name and environment.
The Outputs sections is where we configure the location to which we want to forward the logs. By default, a local Elasticsearch installation is defined as the output:
output.elasticsearch:
   hosts:
      - localhost:9200
Of course, you can decide to output the event logs to Logstash instead — as we will do in the next step.
Last but not least, we can set the logging level in the Logging section to critical, error, warning, info, or debug.
Configuring our logging pipeline
Now that we have understood our configuration options, it’s time to configure Winlogbeat to ship event logs to the Logz.io ELK Stack.
Open the Winlogbeat configuration file at: C:\Program Files\Winlogbeat\winlogbeat.yml and paste the following configuration:
winlogbeat.event_logs:

- name: Application
   ignore_older: 72h
- name: Security
- name: System

fields:
   logzio_codec: json
   token: UfKqCazQjUYnBNcJqSryIRyDIjExjwIZ
fields_under_root: true

output.logstash:
   # The Logstash hosts
   hosts: ["listener.logz.io:5015"]
   # Optional TLS. By default is off.
   # List of root certificates for HTTPS server verifications tls.certificate_authorities: ['c:\Program Files\Winlogbeat\COMODORSADomainValidationSecureServerCA.crt']
A few notes on this configuration.
In this case, we are sending the event logs to the Logz.io ELK, so we commented out the Elasticsearch as an output section. Also, there are additional fields here that are specific to shipping to the Logz.io ELK Stack: logz.io_codec, token, and the TLS certificate path (you will need to download your own certificate to ship to Logz.io).
If you’re shipping to your own Elasticsearch or Logstash instance, you can use the default settings in the file and omit the addition of these additional fields.
Save the file, and start the service. You can use the Windows service manager or PowerShell to do this:
PS C:\Program Files\Winlogbeat> Start-Service winlogbeat
Analyzing and visualizing event logs
Open Kibana, and you should see your event logs displayed. If you’re already shipping logs from a different data source, you can differentiate the two streams of data using the following query in Kibana:
type: wineventlog
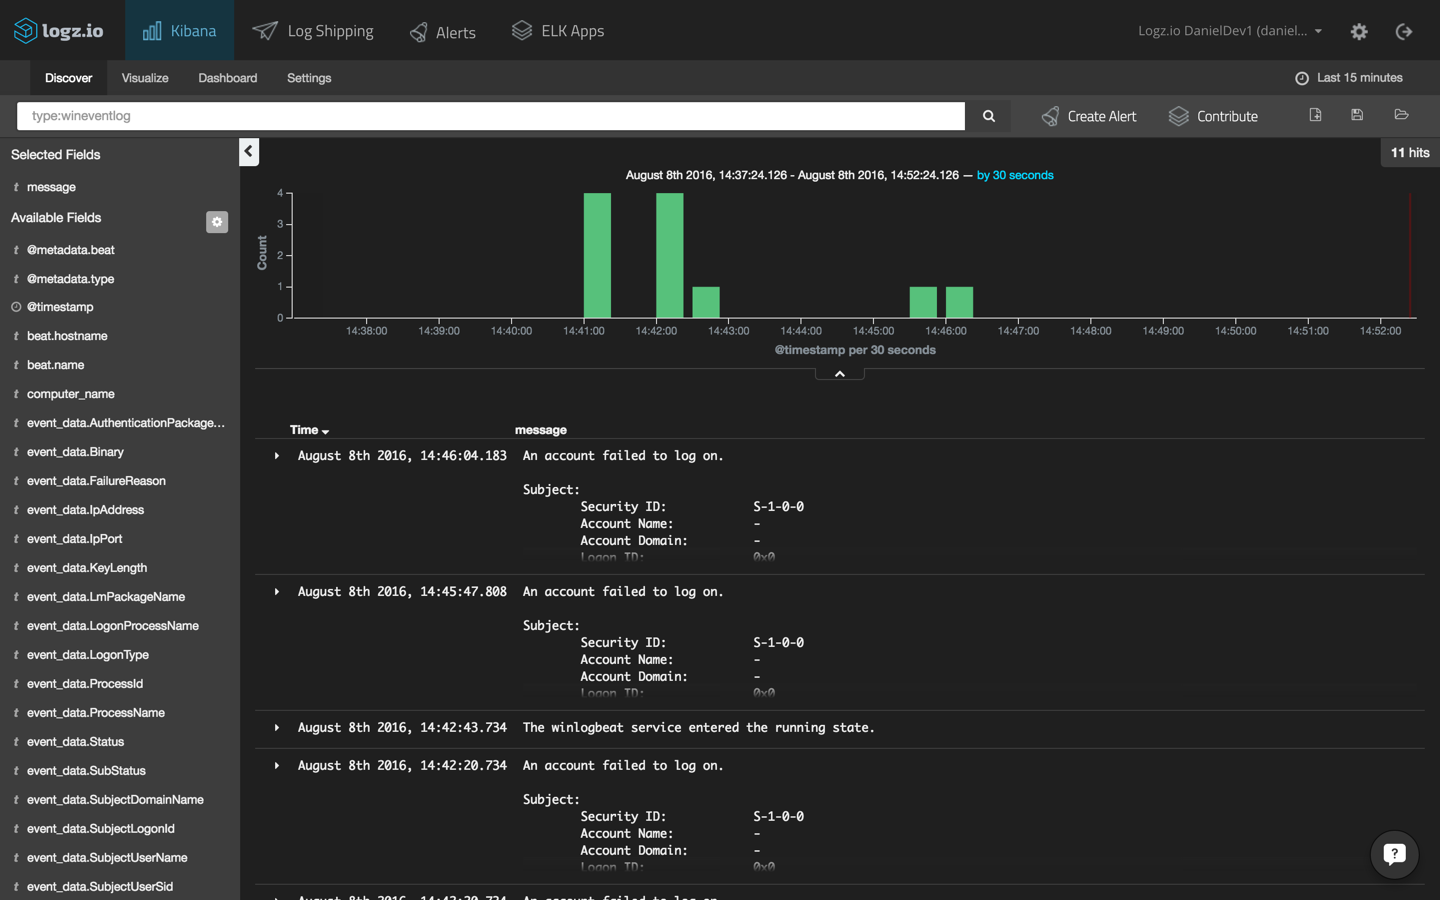
Select one of the entries to view all of the fields that are available for analysis. Select the JSON tab to view the event logs as they are indexed by Elasticsearch. For example, here is the event log report that the Winlogbeat service has begun running:
{
   "_index": "logz-dkdhmyttiiymjdammbltqliwlylpzwqb-160808_v1",
   "_type": "wineventlog",
   "_id": "AVZp9m4P-SDvkjEsrQTt",
   "_score": null,
   "_source": {
      "computer_name": "WIN-E9CD0MMN9GJ",
      "process_id": 676,
      "keywords": [
      "Classic"
   ],
   "logzio_codec": "json",
   "log_name": "System",
   "level": "Information",
   "@metadata": {
      "beat": "winlogbeat",
      "type": "wineventlog"
   },
   "record_number": "24082",
   "event_data": {
      "Binary": "770069006E006C006F00670062006500610074002F0034000000",
      "param1": "winlogbeat",
      "param2": "running"
   },
   "type": "wineventlog",
   "message": "The winlogbeat service entered the running state.",
   "tags": [
      "beats-5015",
      "_logzio_codec_json",
      "_jsonparsefailure"
   ],
   "thread_id": 3876,
   "@timestamp": "2016-08-08T11:42:43.734+00:00",
   "event_id": 7036,
   "provider_guid": "{555908d1-a6d7-4695-8e1e-26931d2012f4}",
   "beat": {
      "hostname": "WIN-E9CD0MMN9GJ",
      "name": "WIN-E9CD0MMN9GJ"
   },
   "source_name": "Service Control Manager"
},
"fields": {
   "@timestamp": [
      1470656563734
   ]
},
"highlight": {
   "type": [

"@kibana-highlighted-field@wineventlog@/kibana-highlighted-field@"
   ]
 },
 "sort": [
    1470656563734
  ]
}
You can now use Kibana to query the data stored in Elasticsearch. Querying is an art unto itself, and we cover some of the common methods in Elasticsearch queries guide.
As an example, say you would like to see a breakdown of the different event types. Using the query above as the basis for a pie-chart visualization, we are going to use the following configuration:
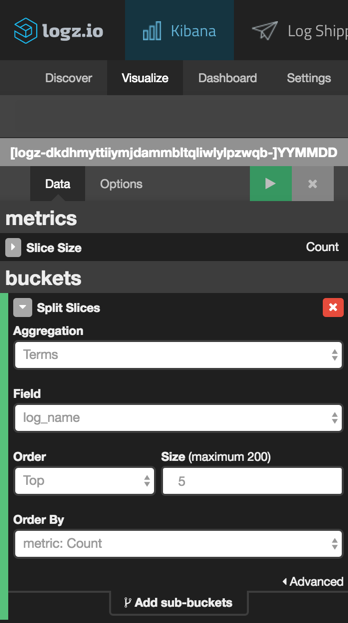
We’re using a split-slice aggregation using the “log_name” field. Here is the result of this configuration (hit the green play button to preview the visualization):
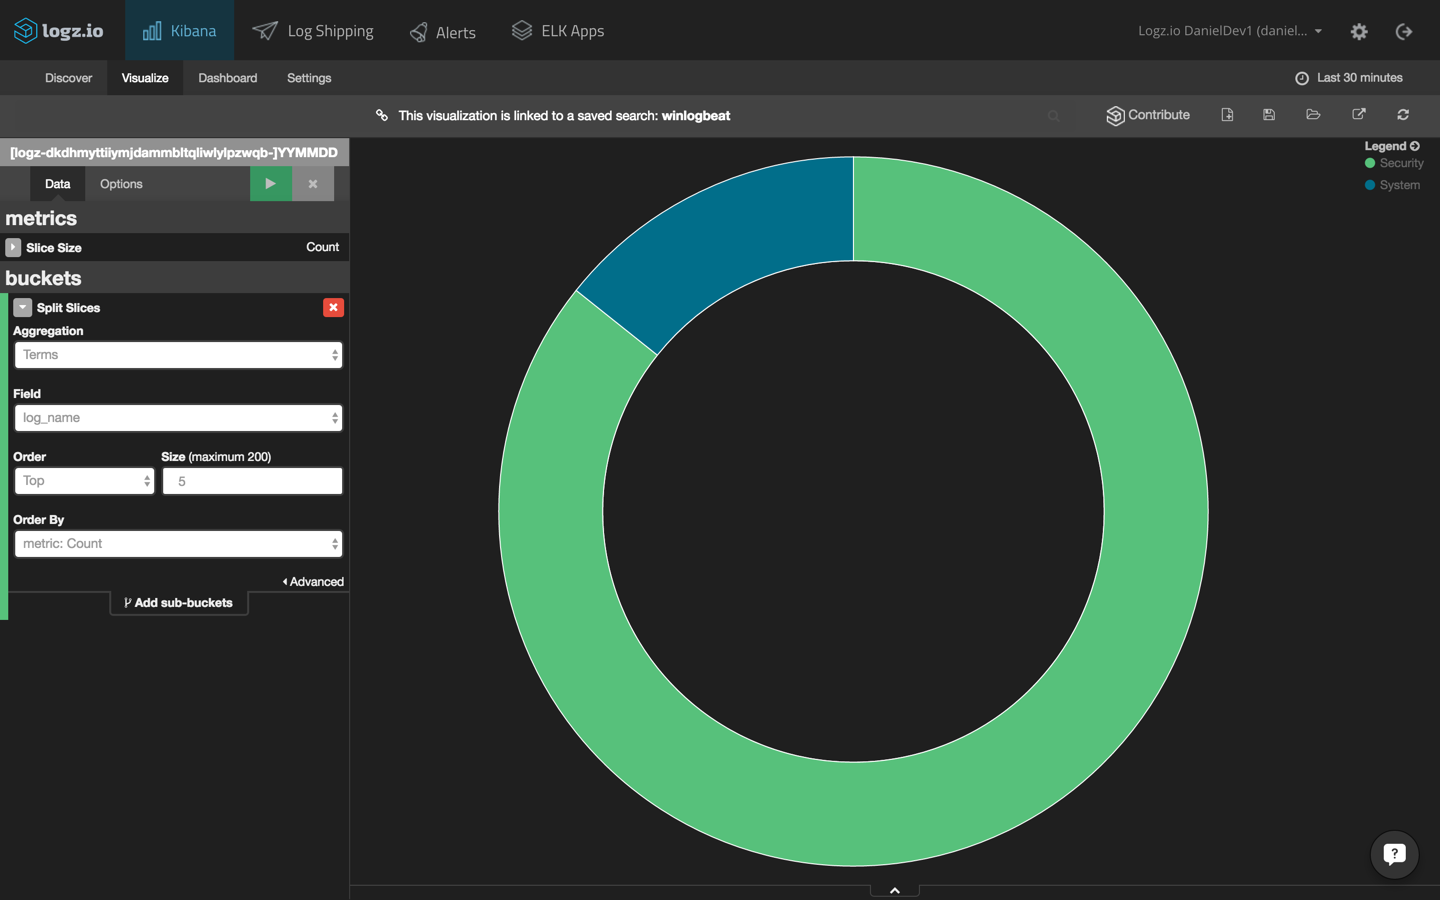
Now, Logz.io ships with a library of pre-made KIbana searches, alerts, visualizations and dashboards tailored for specific log types — including, Windows event logs. Saving you the time for building different visualizations, you can hit the ground running with a ready-made dashboard.
To install this dashboard, simply open ELK Apps, search for Winlogbeat in the search box, and install the dashboard.
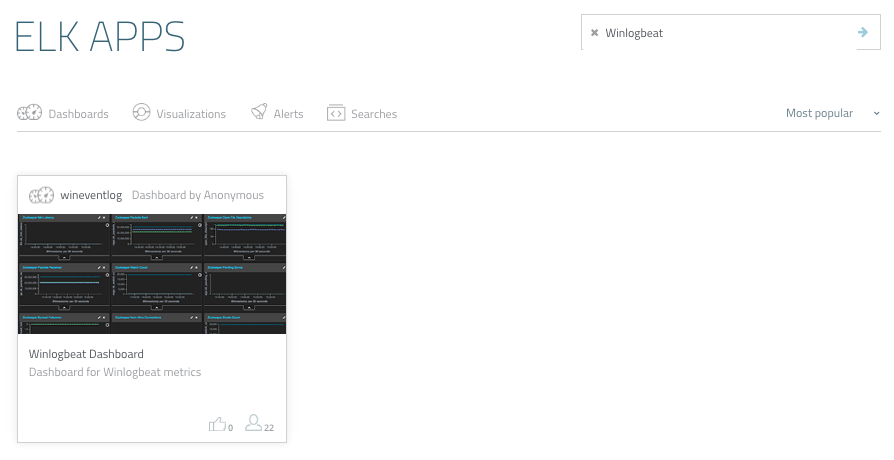
When you open the dashboard, you will see a series of visualizations: number of events over time, number of events, event sources, top event IDs, event levels, and Windows event log searches.
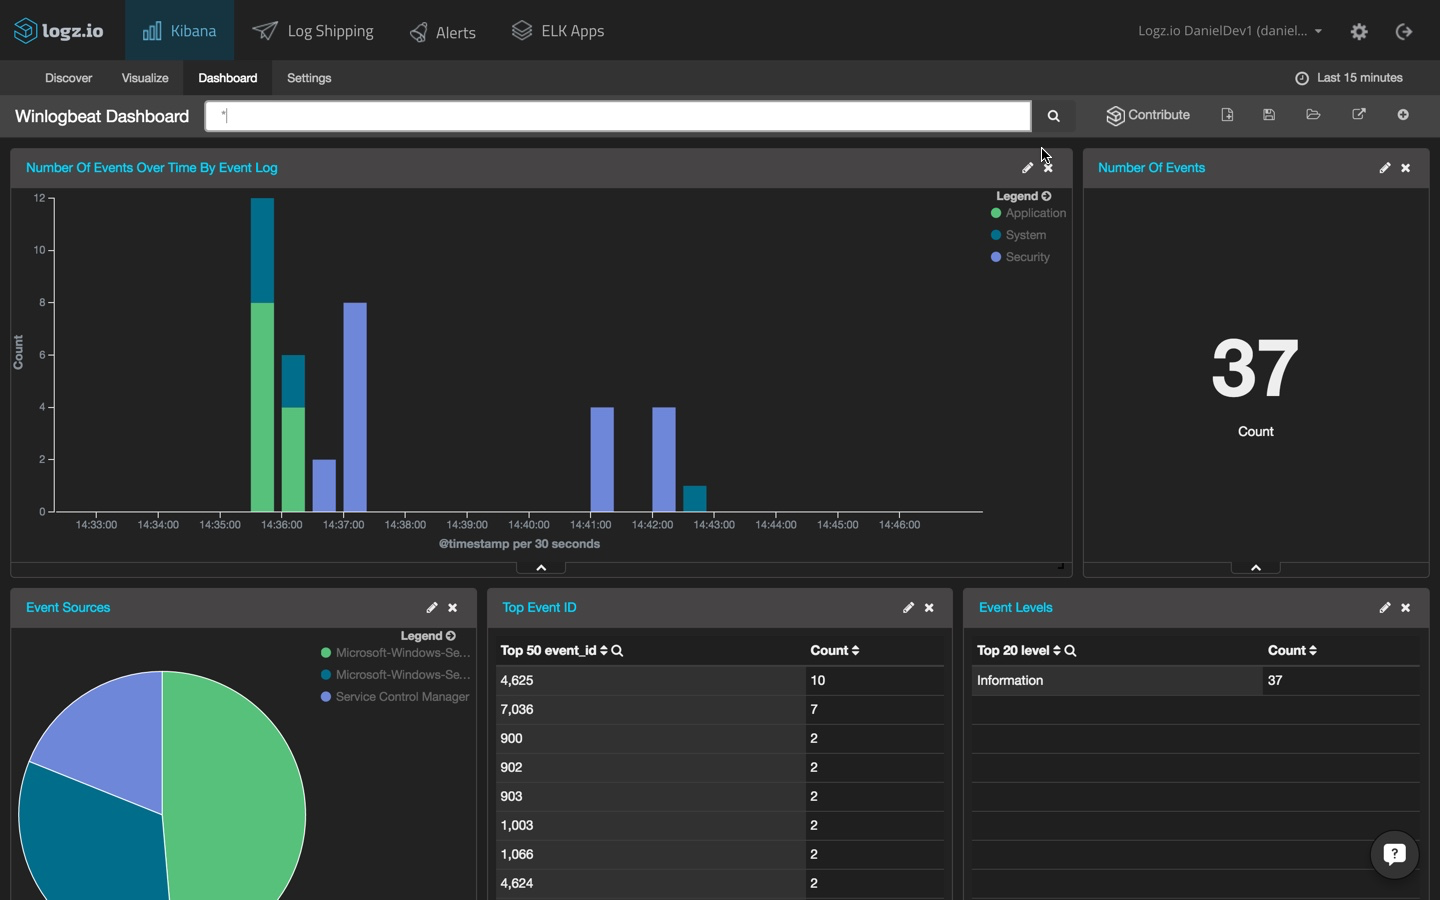
Of course, you can customize these visualizations any way that you like or create various other visualizations based on the indexed fields — this functionality is why Kibana is so powerful.
In Summary
ELK and Windows are being used together more and more for the simple reason that existing solutions are not as flexible as well as the obvious fact that ELK is open source. Windows environments output so much data that using the Windows event viewer is simply not a viable option anymore. The ability to query the data and build rich, beautiful visualizations is a huge benefit that ELK offers.
Logz.io is a predictive, cloud-based log management platform that is built on top of the open-source ELK Stack and can be used for log analysis, application monitoring, business intelligence, and more. Start your free trial today!
↧
↧
Apache Log Analysis with Logz.io

Due to its ease of use, open source nature, and inherent flexibility, Apache is the most popular web server today. Apache log analysis, however, is nowhere near as popular as the web server itself — despite being very important.
In production environments, huge numbers of Apache logs are being generated every second, making keeping track and analyzing all of this data a challenge for even the most experienced DevOps teams out there. That’s where the ELK Stack (Elasticsearch, Logstash, and Kibana) comes in.
The world’s most popular log analysis platform, ELK provides the tools for easily ingesting and monitoring Apache logs — a super-powerful and fast indexing engine, a flexible log shipper and parser, and a rich interface for visualization and querying.
This guide will show you how to ingest Apache logs into the Logz.io ELK Stack using Filebeat and then analyze and visualize that data. Note: You can use any open source ELK installation to follow almost all of the steps provided here.
Installing Apache
If you’ve already got Apache up and running, great! You can skip to the next step.
If you’re not sure (yes, this happens!), use the next command to see a list of all your Apache packages:
dpkg --get-selections | grep apache
If Apache is not installed, enter the following commands:
$ sudo apt-get update
$ sudo apt-get install apache2
This may take a few seconds as Apache and its required packages are installed. Once done, apt-get will exit and Apache will be installed.
By default, Apache listens on port 80, so to test if it’s installed correctly, simply point your browser to: http://localhost:80.
Installing Filebeat
I will assume that you are running Ubuntu 14.04 and are going to install Filebeat from the repository. If you’re using a different OS, additional installation instructions are available here.
First, download and install the Public Signing Key:
$ curl https://packages.elasticsearch.org/GPG-KEY-elasticsearch | sudo apt-key add -
Next, save the repository definition to /etc/apt/sources.list.d/beats.list:
$ echo "deb https://packages.elastic.co/beats/apt stable main" | sudo tee -a /etc/apt/sources.list.d/beats.list
Now, run apt-get update and install Filebeat:
$ sudo apt-get update

$ sudo apt-get install filebeat
Logz.io uses TLS as an added security layer, so the next step before configuring the data pipeline is to download a certificate and move it to the correct location (this step is optional if you’re using the open source ELK):
$ wget http://raw.githubusercontent.com/cloudflare/cfssl_trust/master/intermediate_ca/COMODORSADomainValidationSecureServerCA.crt

$ sudo mkdir -p /etc/pki/tls/certs

$ sudo cp COMODORSADomainValidationSecureServerCA.crt /etc/pki/tls/certs/
Configuring the pipeline
The next step is to configure Filebeat to track your Apache log files and forward them to the ELK Stack.
In the Filebeat configuration file at /etc/filebeat/filebeat.yml, you will define a prospector for each type of logs and add some Logz.io-specific fields (codec and user token) to each prospector. If you were to track other log files, you would need to add a prospector definition for them as well.
So, first:
$ sudo vim <strong>/etc/filebeat/filebeat.yml </strong>
Then, the configuration is as follows:
################### Filebeat Configuration Example ############################

############################# Filebeat #####################################

filebeat:

   # List of prospectors to fetch data.

   prospectors:

      # This is a text lines files harvesting definition

      -

      paths:

         - /var/log/apache2/*.log

      fields:

         logzio_codec: plain

         token: tWMKrePSAcfaBSTPKLZeEXGCeiVMpuHb

         fields_under_root: true

         ignore_older: 24h

         document_type: apache

         registry_file: /var/lib/filebeat/registry
In the Output section, define the Logz.io Logstash host (listener.logz.io:5015) as the output destination for our logs and the location of the certificate used for authentication:
############################# Output ########################################

# Configure what outputs to use when sending the data collected by the beat.

output:

   logstash:

      # The Logstash hosts

      hosts: ["listener.logz.io:5015"]

      tls:

         # List of root certificates for HTTPS server verifications

         Certificate_authorities: ['/etc/pki/tls/certs/COMODORSADomainValidationSecureServerCA.crt']
Now, if you were using the open source ELK stack, you could ship directly to Elasticsearch or use your own Logstash instance. The configuration for either of these outputs is straightforward:
Output:

   logstash:
      hosts: ["localhost:5044"]

   Elasticsearch:
   hosts: ["localhost:9200"]
Save your Filebeat configuration.
Verifying the pipeline
That’s it. You’ve successfully installed Filebeat and configured it to ship logs to ELK! To verify the pipeline is working as expected, make sure that Filebeat is running:
$ cd /etc/init.d
$ ./filebeat status
If not, enter:
$ sudo ./filebeat start
Wait a minute or two, and open the Discover tab in your Kibana dashboard. You should be seeing your Apache logs in the main log messages area. If you’re already shipping different types of logs, it’s best to query the Apache logs using:
type:apache

To make things a bit more interesting and play around with more complex data, download some sample access logs.
If you’re using Logz.io, use the following cURL command. Be sure to replace the placeholders in the command with your info — the full path to the file and a Logz.io token (which can be found in the Logz.io user settings):
curl -T <Full path to file> http://listener.logz.io:8021/file_upload/<Token>/apache_access
If you’re using the open source ELK, you can simply copy the contents of the downloaded file into your Apache access log file:
$ wget http://logz.io/sample-data
$ sudo -i
$ cat /home/ubuntu/sample-data >> /var/log/apache2/access.log
$ exit

Analyzing and visualizing Apache logs
There are various ways to query Elasticsearch for your Apache logs.
One way is to enter a field-level search for the server response. For example, you can search for any Apache log with an error code using this search query:
type:apache AND response:[400 TO *]
You can use Kibana to search for specific data strings. You can search for specific fields, use logical statements, or perform proximity searches — Kibana’s search options are varied and are covered more extensively in our Kibana tutorial.
One of the reasons that the ELK Stack is great for analyzing Apache logs is the ability to visualize the data, and Kibana allows you to create visualizations from your search results — meaning that the specific data in which you’re interested can be reflected in easy-to-use, easy-to-create, and shareable graphical dashboards.
To create a new visualization from a custom search, first save a search by clicking the “Save Search” icon in the top-right corner in the Kibana “Discover” tab.
Once saved, select the Visualize tab:

You have a variety of dashboard types from which to select including pie charts, line charts, and gauge graphs.
You then need to select a data source to use for the visualization. You can choose a new or saved search to serve as the data source. Go for the “From a saved search” option and select the search you saved just a minute ago.
Please note that the search you selected is now bound to this specific visualization, so the visualization will update automatically when you make changes to this search. (Though you can unlink the two, if you like.)
You can now use the visualization editor to customize your dashboard — more information on this will be published soon — and save the visualization. If you wish, you can also add it to your Kibana dashboard or even share it by embedding it in HTML or by sharing a public link.
ELK Apps
Logz.io provides its users with a free library of pre-made Kibana dashboards, visualizations and alerts, called ELK Apps. These apps have already been fine-tuned by Logz.io to suit specific types of log data.
For Apache logs, there are plenty of available ELK Apps to use including an “Apache Average Byte”’ app that monitors the average number of bytes sent from your Apache web server as well as the extremely useful and popular “Apache Access” app that shows a map of your users, response times and codes, and more.
Installing these visualizations is easy — simply select the ELK Apps tab and search for Apache“:

To use a specific visualization, simply click the Install button and then the Open button.
The ELK app will then be loaded in the Visualization editor, so you can then fine-tune it to suit your personal needs and then load it in the Dashboard tab.
What next?
Once you’ve set up your dashboard in Kibana for monitoring and analyzing Apache logs, you can set up an alerting system to notify you (via either e-mail or Slack or other options) whenever something has occurred in your environment that exceeds your expectations of how Apache and the serviced apps are meant to be performing. Logz.io’s alerting feature allows you to do just that, and you can read up on how to create alerts in this video:
↧
Amazon EC2 Container Service (ECS) Log Analysis

Amazon EC2 Container Service (Amazon ECS) is a management service for running, stopping, and managing Docker containers on top of EC2 servers. These containers run on a cluster of EC2 instances, with ECS handling the automation side of things — the installation and operation of the underlying infrastructure.
All of the familiar Amazon services such as IAM, ELB, VPC, and auto scaling can be used with these containers — making it a good solution for managing a containerized app that is scalable and robust enough to handle heavy loads.
Security for Docker containers is a touchy issue and is still very much a work-in-progress. There are a number of ways that ECS can help to alleviate the security issue. VPC and IAM are two examples of how to limit access to the Docker containers and their resources.
Logging is another aspect that makes using ECS for managing containers a safe option. ECS is also integrated with CloudTrail, so you can track all of the API calls made by ECS (both by the ECS console and the ECS API) and ship the resulting logs into S3 (here’s a list of the API calls tracked). These logs will provide you with information on the type of request made to ECS, the IP making the request, who made it and when, and more. All of this information important when you are auditing your system and compliance standards.
This article describes how to use the Logz.io ELK Stack to log ECS. We will be establishing a pipeline of logs from ECS to CloudTrail and from CloudTrail to an S3 bucket. Then, we will pull the data from S3 into Logz.io using the built-in S3 integration.
Note: Analyzing the logs generated by the Docker containers themselves is an entirely different story. I’ll cover this in part two of this series.
Prerequisites
This article assumes that you have an ECS cluster setup in AWS. If you do not have that setup and are just getting started with the service, I highly recommend this Getting Started with ECS console walk-through — it will take you through the steps for setting up a cluster that is servicing a simple web application. I also recommend reading up on the ECS service on the AWS documentation site.
Enabling CloudTrail
Our first step is to enable CloudTrail logging (if you already have this setup, you can skip to the next step).
If CloudTrail has already been enabled, you will be adding a new trail. If this is the first time you are using CloudTrail, just follow the get-started instructions to enable the service. Either way, configuring the new trail is pretty straightforward.

Give a name for the new trail and configure the S3 bucket to which you will forward the logs. This is the bucket from which we will pull the logs to send them to the Logz.io ELK Stack.
Click “Create” (or “Turn On,” if this is the first trail you are creating). Any API call made to AWS ECS will now be logged automatically to S3.
A good way to verify this is by using the AWS CLI command (you will need to install AWS CLI):
$ aws cloudtrail aws cloudtrail lookup-events --lookup-attributes AttributeKey=ResourceName,AttributeValue=ecs
ECS events will be displayed like this:
{
   "EventId": "55627f7e-4d82-487b-9ce9-b3933bfdf4ce",
   "Username": "root",
   "EventTime": 1470751491.0,
   "CloudTrailEvent": "{\"eventVersion\":\"1.04\",\"userIdentity\":{\"type\":\"Root\",\"principalId\":\"011173820421\",\"arn\":\"arn:aws:iam::011173820421:root\",\"accountId\":\"011173820421\",\"accessKeyId\":\"ASIAID2FMU6DNG5NYTIA\",\"sessionContext\":{\"attributes\":{\"mfaAuthenticated\":\"false\",\"creationDate\":\"2016-08-09T07:38:02Z\"}},\"invokedBy\":\"cloudformation.amazonaws.com\"},\"eventTime\":\"2016-08-09T14:04:51Z\",\"eventSource\":\"autoscaling.amazonaws.com\",\"eventName\":\"CreateLaunchConfiguration\",\"awsRegion\":\"us-east-1\",\"sourceIPAddress\":\"cloudformation.amazonaws.com\",\"userAgent\":\"cloudformation.amazonaws.com\",\"requestParameters\":{\"ebsOptimized\":false,\"instanceMonitoring\":{\"enabled\":true},\"instanceType\":\"t2.medium\",\"associatePublicIpAddress\":true,\"keyName\":\"ecs\",\"launchConfigurationName\":\"EC2ContainerService-demo1-EcsInstanceLc-FYYHK63Y9OG\",\"imageId\":\"ami-55870742\",\"userData\":\"\\u003csensitiveDataRemoved\\u003e\",\"securityGroups\":[\"sg-87e71efd\"],\"iamInstanceProfile\":\"ecsInstanceRole\"},\"responseElements\":null,\"requestID\":\"3d806f0f-5e3a-11e6-b769-a5b2e233c878\",\"eventID\":\"55627f7e-4d82-487b-9ce9-b3933bfdf4ce\",\"eventType\":\"AwsApiCall\",\"recipientAccountId\":\"011173820421\"}",
   "EventName": "CreateLaunchConfiguration",
   "Resources": [
      {
         "ResourceType": "AWS::EC2::SecurityGroup",
         "ResourceName": "sg-87e71efd"
      },
      {
         "ResourceType": "AWS::AutoScaling::LaunchConfiguration",
         "ResourceName": "EC2ContainerService-demo1-EcsInstanceLc-FYYHK63Y9OG"
      },
      {
         "ResourceType": "AWS::IAM::InstanceProfile",
         "ResourceName": "ecsInstanceRole"
      },
      {
         "ResourceType": "AWS::EC2::KeyPair",
         "ResourceName": "ecs"
      },
      {
         "ResourceType": "AWS::EC2::Ami",
         "ResourceName": "ami-55870742"
      }
   ]
}
Shipping ECS event logs to Logz.io
Now, it starts to get interesting. We’ve verified that API calls to the ECS service are being tracked by CloudTrail, so our next step is to configure our shipping pipeline from CloudTrail into the Logz.io ELK Stack for further analysis.
To do this, we first need to make sure that you have the correct permissions to list buckets and get objects from all the paths under it.
Make sure that your IAM user has the following policies attached (replace “ecseventlogs” with the name of your S3 bucket):
{
      "Sid": "Stmt1467037144000",
      "Effect": "Allow",
      "Action": [
         "s3:ListBucket"
      ],
      "Resource": [
         "arn:aws:s3:::ecseventlogs"
      ]
   },
   {
      "Sid": "Stmt1467037240000",
      "Effect": "Allow",
      "Action": [
         "s3:GetObject"
      ],
      "Resource": [
         "arn:aws:s3:::ecseventlogs/*"
      ]
   }
 ]
}
Be sure to make note of the user credentials because our next step is to define the bucket in Logz.io (this is under the Security Credentials tab on the User page).
Open the Log Shipping tab in the Logz.io UI, and select the AWS -> CloudTrail Bucket section:

Enter the details of the S3 bucket that contains your ECS CloudTrail logs — the bucket name, the bucket path (e.g. /AWSLogs/011173820421/CloudTrail/), and the user credentials (access and security keys).
Click “save.” You should get a green message that confirms that your S3 bucket can now be accessed. If not, there is most likely a permissions issue — check out this troubleshooting article for more information.
Open the Discover tab in the Kibana dashboard that is built into the Logz.io user interface. Your ECS logs will be displayed:

Logz.io will parse CloudTrail logs for you, but you will need to refresh the mapping by opening the Setting page and clicking the Refresh Mapping button.
Analyzing ECS events
You have successfully established an event logging pipeline from CloudTrail into the Logz.io ELK Stack, so all API calls made to ECS will now be displayed in your Kibana dashboard.
To get better visibility into the messages being logged, add some fields to the message list. For example, select the “eventName” and “eventResource” fields. This will allow you to see which AWS service is generating the event:

Since multiple AWS services including EC2 and ELB are involved in running an ECS cluster, you will see a considerable number of events being tracked by CloudTrail. As an initial step, it’s a good idea to filter the messages using this query in Kibana:
eventSource:ecs.amazonaws.com
You can now see a more distilled view of the API calls to ECS:

Selecting one of the entries, we will be able to view the logged message as it was indexed in Elasticsearch in JSON format:
{
   "_index": "logz-pusfjuomruyfnhdfzltthhjuiogamcvd-160810_v1",
   "_type": "cloudtrail",
   "_id": "AVZza9gdhGlaWDHRdu3A",
   "_score": null,
   "_source": {
      "eventID": "aaa65dc3-18e0-4e2d-b358-5ae7f2b9ff53",
      "awsRegion": "us-east-1",
      "geoip": {
         "city_name": "Tel Aviv",
         "timezone": "Asia/Jerusalem",
         "ip": "37.142.40.241",
         "latitude": 32.0667,
         "country_code2": "IL",
         "country_name": "Israel",
         "country_code3": "ISR",
         "continent_code": "AS",
         "region_name": "05",
         "location": [
            34.766699999999986,
            32.0667
         ],
         "real_region_name": "Tel Aviv",
        "longitude": 34.766699999999986
      },
      "eventVersion": "1.04",
      "responseElements": null,
      "sourceIPAddress": "37.142.40.241",
      "eventSource": "ecs.amazonaws.com",
      "requestParameters": {
         "maxResults": 100
      },
      "userAgent": "console.amazonaws.com",
      "userIdentity": {
         "accessKeyId": "ASIAJVYANKOS2U2EZQDQ",
         "sessionContext": {
            "attributes": {
            "mfaAuthenticated": "false",
      "creationDate": "2016-08-10T06:27:54Z"
         }
      },
      "accountId": "011173820421",
      "principalId": "011173820421",
      "type": "Root",
      "arn": "arn:aws:iam::011173820421:root"
   },
   "eventType": "AwsApiCall",
   "type": "cloudtrail",
   "tags": [
      "cloudtrail-geoip"
   ],
   "@timestamp": "2016-08-10T07:41:30.000+00:00",
   "requestID": "5ffdab4d-fc83-4927-9ad3-4c990daf1a9f",
   "eventTime": "2016-08-10T07:41:30Z",
   "eventName": "ListClusters",
   "recipientAccountId": "011173820421"
 },
 "fields": {
   "@timestamp": [
      1470814890000
   ]
},
"highlight": {
   "eventSource": [

"@kibana-highlighted-field@ecs.amazonaws.com@/kibana-highlighted-field@"
      ]
   },
   "sort": [
      1470814890000
   ]
}
Building an ECS Events dashboard
One of Kibana’s strengths is its easy ability to build beautiful visualizations on top of searches and queries. As an example, here is how you can build a security-oriented dashboard that can track who is accessing your ECS cluster and how.
Source IP Addresses
Let’s start with a simple visualization depicting the top source IP addresses. To do this, save the query above and use it for a new data table visualization (in Kibana, go to Visualize → Pie chart, and select the saved search).
The configuration for the table will display split rows of the top five values for the “sourceIPAddress” field. The configuration and the resulting visualization will look like this:

Geomap for API calls
Our next visualization will create a map that details the geographic location of the ECS service consumers.
Using the same search, this time we’re going to select the “Tilemap” visualization type. The configuration is automatically loaded in this case (using the “geoip.location” field of the CloudTrail logs).
Here is the configuration and the end result:

ECS Events Over Time
Another example is to show the number of calls to ECS over time. To do this, create a line chart visualization with an X axis using the Date Histogram aggregation type.
The configuration and visualization:

These are just three examples of visualizing the data in Kibana. Once you have a number of these visualizations set up, you can combine them into one comprehensive dashboard.
It goes without saying that there are many ways to slice and dice ECS data, and the method that you will use will depend on your use case and what specific information you are trying to analyze and visualize.
Logz.io comes with a built-in ELK Apps library of pre-made visualizations and dashboards — including ones for CloudTrail logs. Saving you the time of constructing visualizations one by one, you can install these apps in one click. A popular ELK app is the CloudTrail security and auditing dashboard, which includes visualizations for login and deletion actions, users, and other security and network related graphs.
Coming Next: Docker
By shipping CloudTrail logs into ELK, you can get a good detailed picture on the API calls made to ECS.
Again, these are high-level logs and do not reveal information on what is transpiring within the Docker containers themselves. To monitor containers, a completely different solution is needed in which Docker logs, together with additional available Docker info (e.g. Docker stats, Docker daemon events) are collected from the containers. The next piece in this series will cover this aspect.
Logz.io is a predictive, cloud-based log management platform that is built on top of the open-source ELK Stack and can be used for log analysis, application monitoring, business intelligence, and more. Start your free trial today!
↧
Overcoming the Biggest Challenge in Log Analysis Using Logz.io Cognitive Insights

In the realm of log analysis, the biggest challenge facing IT and DevOps teams is being able to find the needle in the haystack — to identify that single log message that indicates that something in your environment is broken and is about to crash your application.
Often enough, events that are clear indicators that a crisis is about to occur get lost simply because people don’t know what they’re looking for in the stream of Big Data that is being ingested into their log pipelines. The issues could be something as simple as a maxed-out Linux memory usage error or a simple syntax error in some application code. Troubleshooting after the fact is also a challenge for the very same reason.
But what if there are people out there with similar setups who have already encountered these events, troubleshooted them in their environments, and shared their solutions for the community to use? Wouldn’t it be helpful for people to be able to use this knowledge in their own environments to be able to identify issues before they affect their businesses?
The answer, of course, is yes — and this is where Logz.io’s new Cognitive Insights feature comes into the picture.
Cognitive Insights adds an element of machine understanding and crowdsourcing to the powerful storage and analysis capabilities of the ELK Stack. Built on top of UMI™ — an artificial intelligence engine created and released recently by Logz.io — this feature exposes these “missed” events by correlating your log data with different data sources such as social threads, discussion forums, and open source repositories (learn more about Cognitive Insights and UMI and read our blog post that announced the feature).
This guide will provide a brief demonstration of how to use Cognitive Insights to easily identify issues on time — before they affect the business.

An example environment
This example will use a simple Java application that is based on an Apache web server and MySQL database. In this case, the Logz.io ELK Stack will ingest application logs, Apache logs, database logs, and server performance metrics using the Logz.io performance agent.
Identifying the event
The journey starts, as always, in Kibana. When you open the Kibana Discover tab in the Logz.io UI, something quickly stands out — some of the log buckets are colored differently than with the usual Kibana green. Furthermore, three different event types are displayed above the list of log messages: “APIMismatch,” “RollbackException,” and “SQL”:
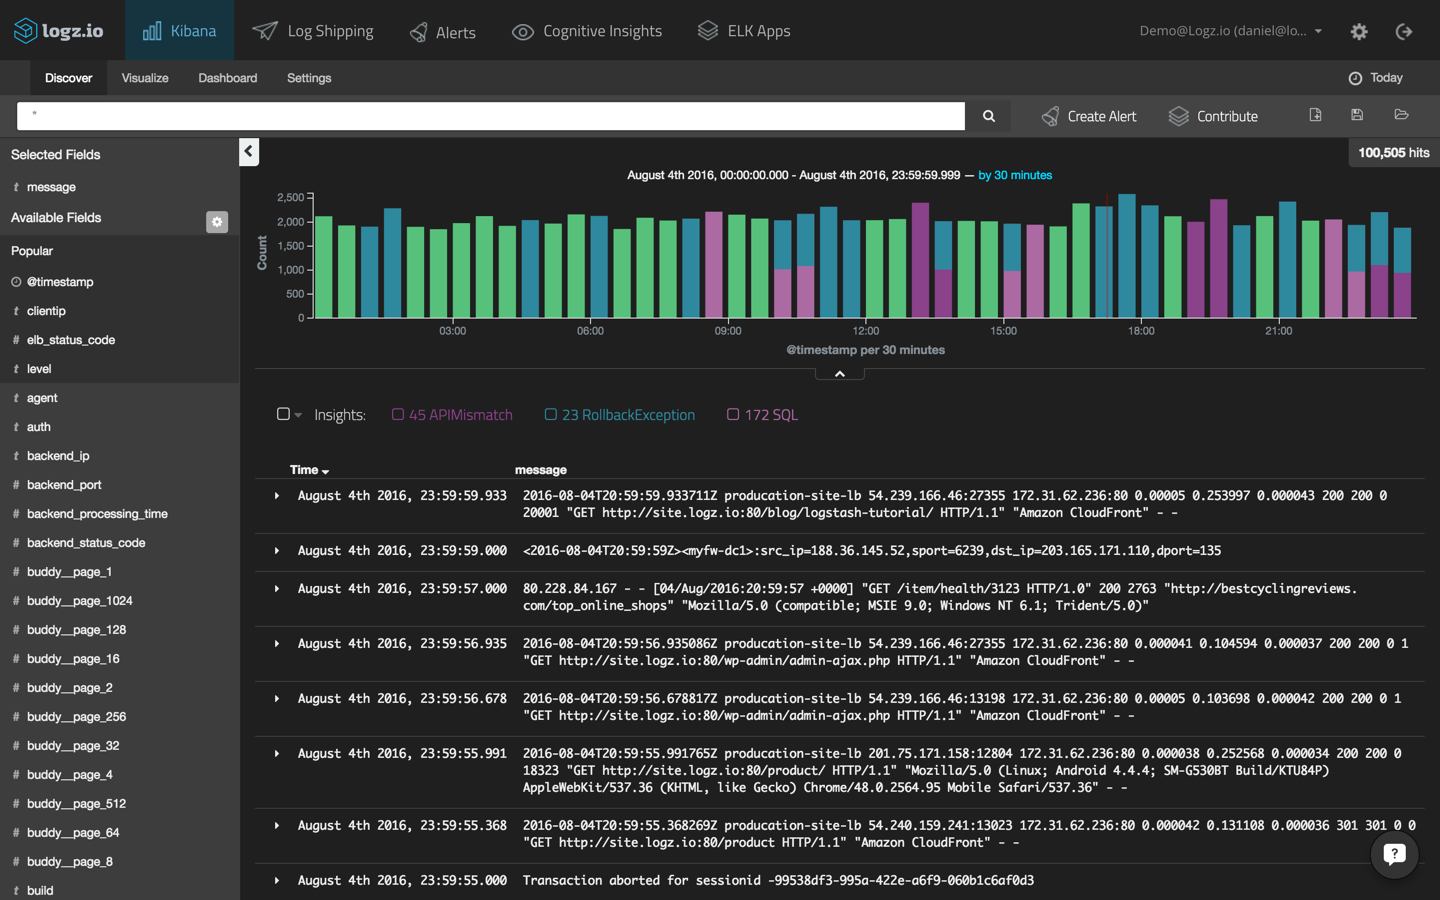
These are the insights identified by the UMI engine. You can see that there are 172 SQL events, so start with this insight by simply selecting the adjacent check-box.
A list of all the SQL events identified is displayed. Drilling down further, select one the SQL events from the list that is displayed:
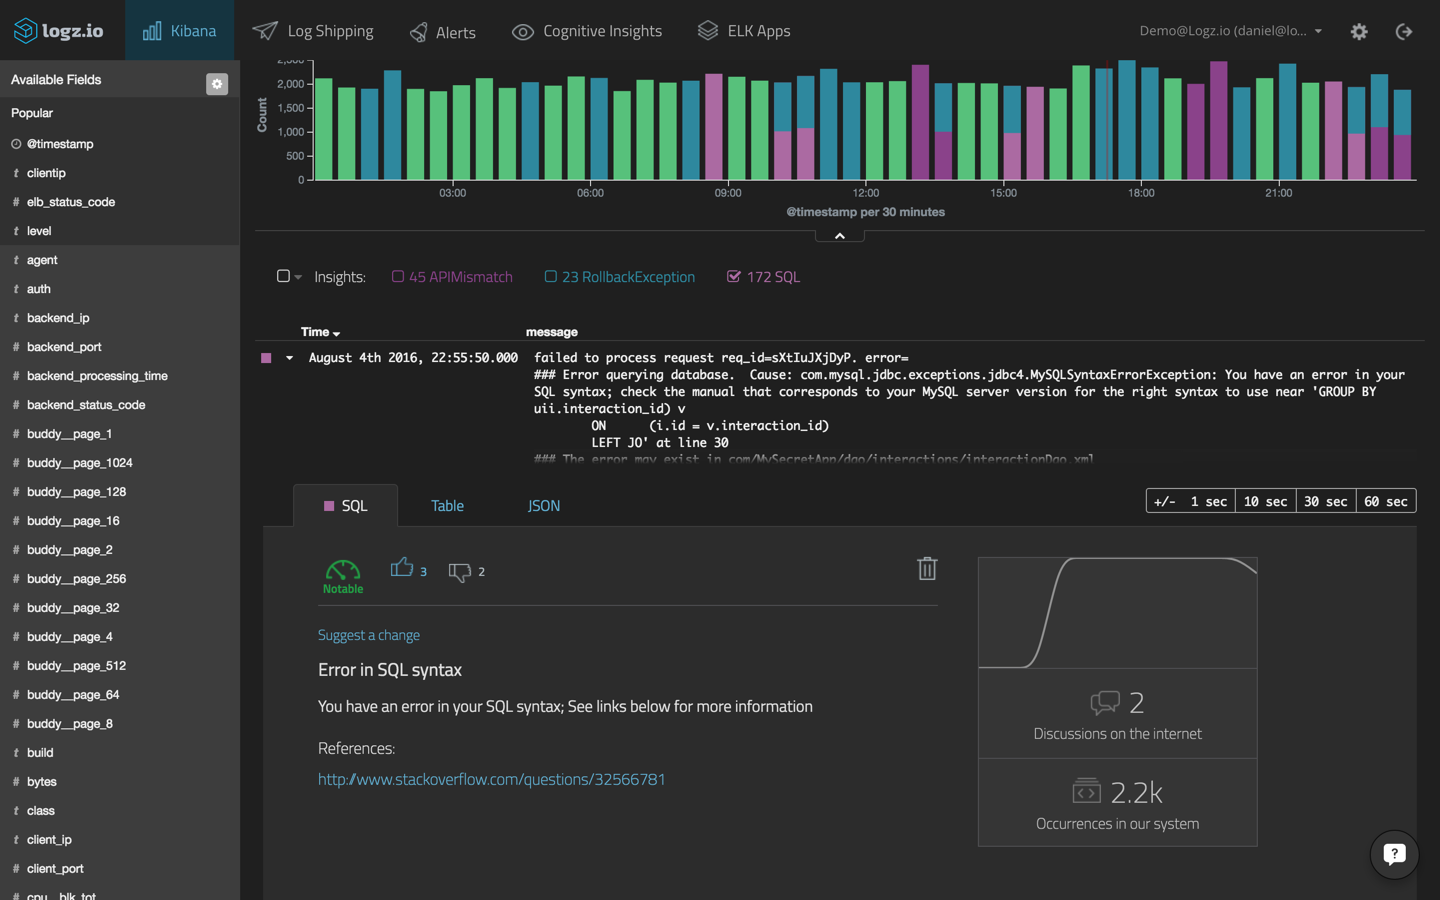
Issue resolution
Before you continue, it’s important to try to understand what has actually happened here.
The UMI engine has correlated the SQL log messages with existing resources on the Web and has found that other people have interacted with this same specific data in their environments, implying that an event is taking place that may need examination.
The information displayed in the Insight box helps you to understand more about the context in which the event was logged, and it lists the resources necessary to take the next step.
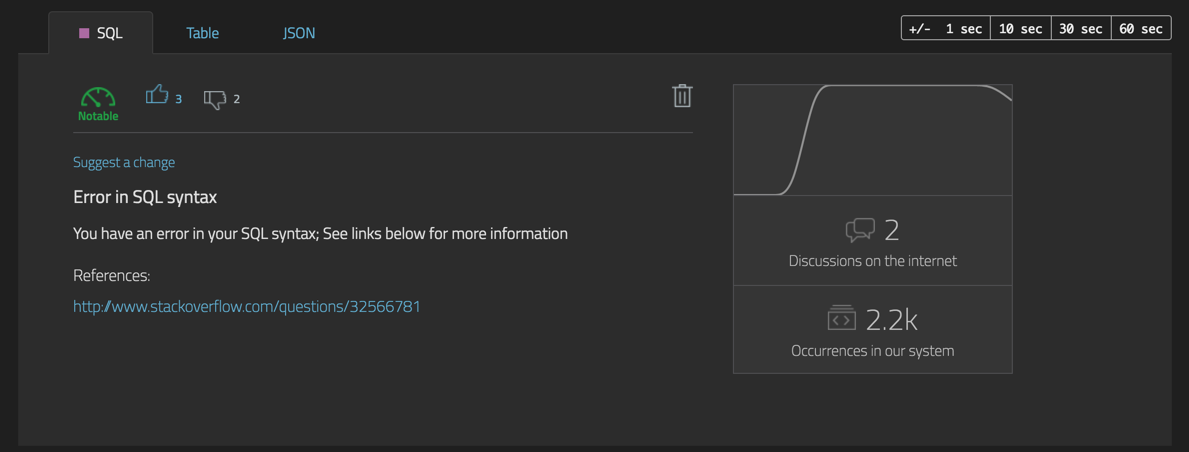
“Error in SQL syntax” is the title of the event, and the short description shows that there is a simple SQL syntax error. The graph on the right is shows the total number of occurrences of this event in the system as well as the number of discussions on the Web involving this very same event.
A reference is listed as well, leading to a resource on the Web — in this case StackOverflow — that contains information on how to resolve the issue.
Scrolling down in the log message itself, you can see that there is an SQL syntax issue on line 30:
Caused by: com.mysql.jdbc.exceptions.jdbc4.MySQLSyntaxErrorException: You have an error in your SQL syntax; check the manual that corresponds to your MySQL server version for the right syntax to use near 'GROUP BY uii.interaction_id) v
        ON      (i.id = v.interaction_id)
        LEFT JO' at line 30
Back in the Insight tab, click the link to the resource that UMI has identified as correlating with the log data.
You can decide whether this insight is relevant or not. If not, you can dismiss it. Either way, your vote will be factored in UMI’s machine learning calculations for when this issue arises in other IT environments in the future.
Managing our insights
In larger environments involving real-life scenarios, you will start to see that list of insights growing. A list of the most frequent events is on the Insights page within the Logz.io UI:
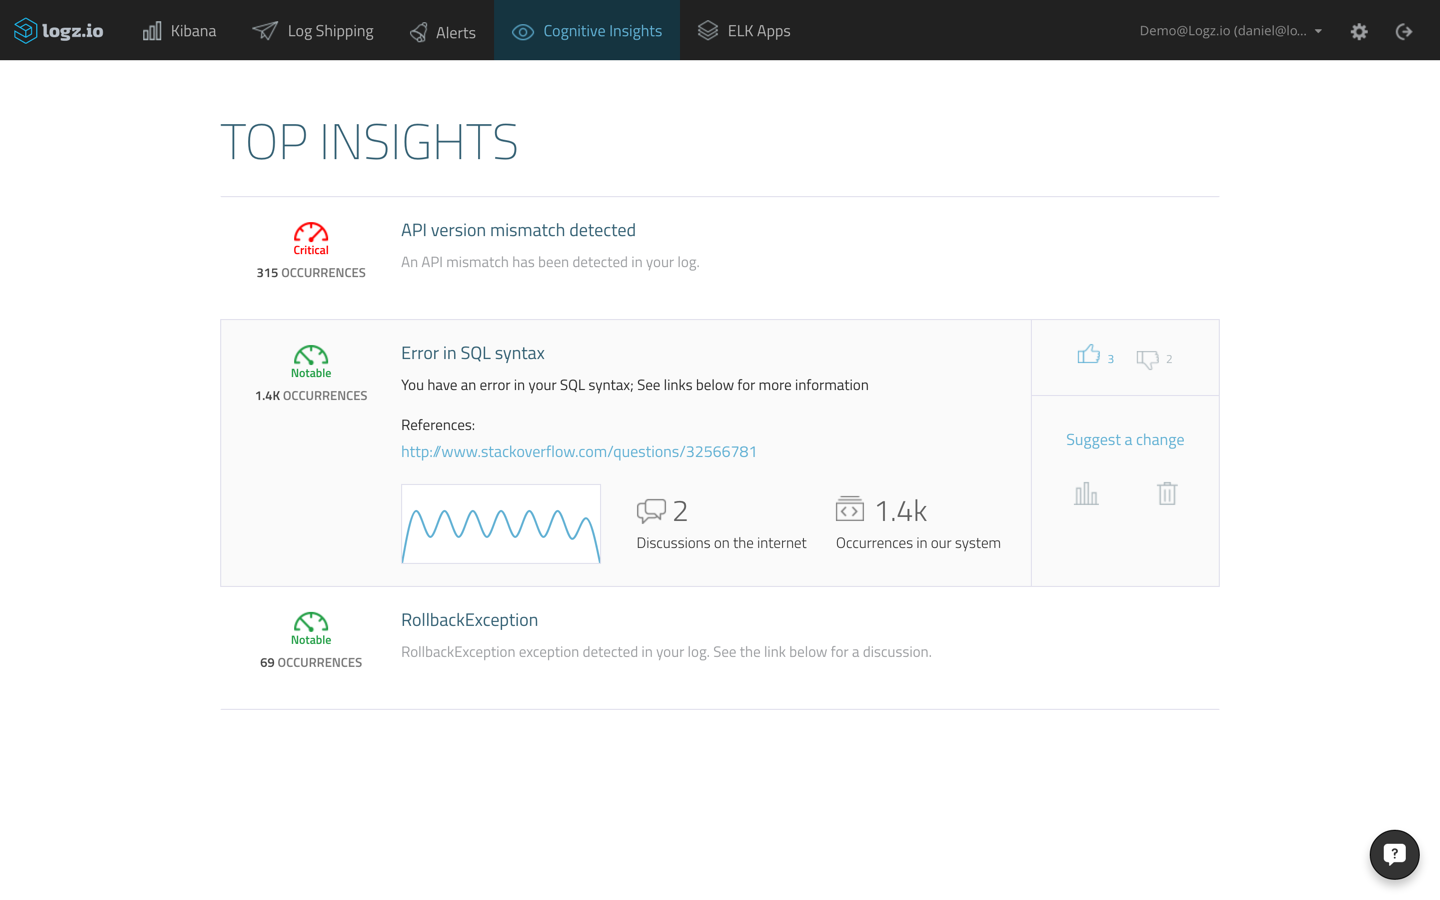
Here, you can open a selected insight in Kibana and read all of the available information.
This is also the place to submit feedback (click “Suggest a change”). So, if there is an issue with an insight’s details (such as a link to the wrong resource), you can tell UMI. The engine is evolving all the time, and getting input from users is the best way to optimize the underlying algorithms.
A summary
It’s as simple as that. Using Cognitive Insights, you will no longer be driving blindfolded — events with the potential of causing real damage to your system will surface up in your Kibana dashboard together with actionable data, and all this by harnessing the knowledge of the community!
It is much more than a simple error alerting mechanism — using machine learning and crowdsourcing, UMI reveals those notices and warnings that would go unnoticed in normal circumstances.
The UMI engine is currently producing a growing pool of hundreds of thousands of known, important, and relevant insights that can be used to troubleshoot any underlying issue quickly before it affects business operations.
Learn more about CI and UMI or create a free demo account to test drive the entire platform for yourself.

↧
5 Features We’ve Added to Kibana

Kibana is one of the major reasons that developers, DevOps engineers, and IT teams opt for using the ELK Stack (Elasticsearch, Logstash and Kibana) for centralized logging.
For those of you who are not acquainted with the tool, Kibana is an open source data visualization tool that is most commonly used in conjunction with Elasticsearch and Logstash (or any other log shipper) as the stack’s “pretty face.” Kibana is popular for many reasons — being able to slice and dice your data in any way you want is probably the most obvious one.
But nothing in life is perfect, and Kibana is no exception to this rule. While relatively simple to use in general, some features require a high technical bar. Take Kibana visualizations, for example. These can be extremely difficult to create for beginners and advanced users alike. More so, Kibana, as supplied out-of-the-box, lacks some capabilities that are crucial in enterprise deployments and that users often complain are missing (such as an alerting mechanism).
Understanding this need — especially following feedback from our users — we at Logz.io have added a number of complementary features that make Kibana an even better tool to use to visualize and analyze Big Data.
1. ELK Apps
While being able to visualize data and build monitoring dashboards is one of Kibana’s most popular features, the truth is that it is not always easy to use. Being able to configure accurate aggregations for the X and Y axes of a specific chart can be extremely time-consuming. This issue is exacerbated by the fact that different logs are built differently, meaning that a configuration for an Apache visualization, for example, will not necessarily work for an IIS or NGINX visualization.
Logz.io includes a library of pre-made Kibana searches, visualizations, and dashboards for different log types called ELK Apps (you can learn more about the collection here).

Since we went live with ELK Apps, we have received dozens of contributions from users. The library currently consists of 142 apps for: Apache, NGINX, AWS (ELB, CloudFront, CloudTrail, VPCFlow, S3), Docker, MySQL, Nagios, IIS, HAProxy, and general system logs. We’d love to see your contribution as well!
Using ELK Apps is extremely simple: Just browse through the library and install your app of choice with one simple click. Users can also contribute their own apps to the library.
2. Cognitive Insights
One of the biggest challenges of analyzing log data in Kibana — and indeed in any log analysis platform — is the ability to find the information that matters. There is simply too much data to sift through, and most of the time people are not even sure what to look for. Even when people do know what log message they need to analyze, querying Kibana to find that specific log is not always the easiest of tasks.
Often enough, events are taking place in your environment that you are not even aware of. These events might not matter, but they also may be indicators of a catastrophe about to take place that will have the potential to seriously affect your business.
Cognitive Insights is a new AI-powered feature by Logz.io that cancels out the noise made by the large volumes of data in systems and pinpoints the log messages that you need to look at. It does this by correlating your log data with a huge (and growing) database of searches, alerts, and forums on the Web.

The result of these correlations are “Insights” — specific log messages that include details and contextual information on events as they occur in real-time, including meta descriptions and a list of online resources where the issue has already been discussed and troubleshooted.
Read more about Cognitive Insights and the artificial intelligence UMI engine that powers it in our news announcement and our detailed tutorial on how to use it.
3. Alerts
Log analysis platforms such as the ELK Stack are mostly used for after-the-fact forensics and troubleshooting. But once you’ve found that one SQL error that caused your website to crash, how do you make sure that you will receive an alert the next time that a catastrophe is taking place?
Kibana does not ship with an out-of-the-box alerting mechanism. Two common solutions are Yelp’s ElastAlert and Elastic’s Watcher. Both involve either additional configurations or additional costs.
Logz.io comes with a built-in alerting mechanism that allows you to create alerts on top of Kibana queries.

Alerts can be sent to your email address or you can use webhooks to send notifications to Slack, HipChat, JIRA, or any other third-party chat platform that works with webhooks.
4. User Management
Being able to manage who has access to the log data is a basic requirement in any company and a crucial element in complying with international security and auditing standards.
Authorization and authentication are key to protecting the logs that are coming into your ELK Stack, but the problem, again, is that there is no easy way to implement a data protection strategy. Elastic offers Shield, an add-on product for controlling and granting access to Kibana, and, of course, you could try to hack your own solution.
As an end-to-end service, Logz.io comes with built-in user control and management. This includes authorization and authentication, as well as simple user management. You can easily invite new users, suspends old users or edit permissions.

In addition, you can safely share Kibana searches and visualizations with user tokens to decide who in the organization can see what. You can read more about that here.
5. Proximity Events
Another nifty feature that we’ve added to Kibana is the ability to easily see the messages that were logged directly before and after a given message in Kibana.

In a centralized logging system in which Kibana displays messages being ingested from multiple data sources, it’s crucial to be able to understand whether there is a relationship between the different messages that are being logged chronologically.
Take, for example, an Apache 500 response that takes place right after a bad MySQL transaction. These are related log messages that point to the exact root cause but may go unnoticed because they are recorded in two different data streams. Being able to see proximity events allows users to see the big picture and the overall context in which a specific event occurs.
What Kibana 5 Will Add
The list above reflects some of the benefits that Logz.io adds to Kibana but it definitely does not include them all.
There is no doubt that Kibana is a rich visualization tool that can be used for multiple use cases, but the truth remains that in large deployments, the features on offer might feel constraining.
It’s worth noting that the upcoming release of Kibana 5 adds plenty of new features and improved UX, but it does not necessarily compensate for the missing functionality described above.
Logz.io is a predictive, cloud-based log management platform that is built on top of the open-source ELK Stack and can be used for log analysis, application monitoring, business intelligence, and more. Start your free trial today!
↧
↧
Installing the ELK Stack on Windows

Windows? ELK? Well, while it would be safe to assume that most ELK Stack deployments are on Linux-based systems, there are certain use cases in which you would want to install the stack on a Windows machine.
If you’re looking to log Windows event logs, for example, and you do not want to ship the logs over the Web to an ELK server for security reasons, you’re going to want to deploy the stack locally.
This article will guide you through the necessary steps to install the ELK Stack’s components as Windows services. Note: This example will use Elasticsearch, 2.3.5, Logstash 2.3.4, and Kibana 4.5.4.
The setup
I’ll be using a Windows 2012 R2 instance on Amazon Web Services. The operating system is just a basic Server 2012 R2 installation — but with updates and a disabled firewall. I’ve also installed an Apache server for the purpose of demonstrating how to log into ELK.
Elasticsearch and Logstash require JavaScript, so you will also need to download and install it — JDK and NOT JRE — and create a JAVA_HOME system variable as well.
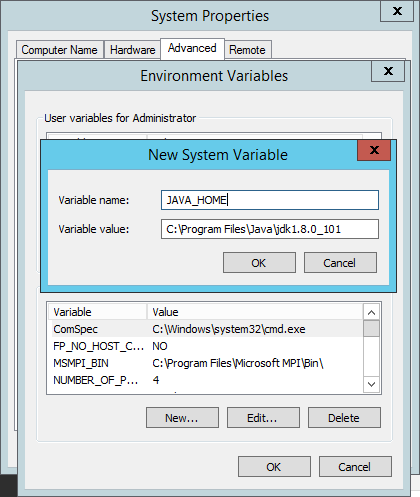
Installing Elasticsearch
Our first step is to install Elasticsearch — the heart of the stack, if you like, that is responsible for storing and indexing the log data.
You can download the latest version of Elasticsearch from Elastic’s Elasticsearch download page. Extract the downloaded package into a designated folder in your file system (e.g. c:\elk).
Next, open a Powershell prompt and enter the following command (be sure to enter your installation path in the command):
$ Invoke-Expression -command “c:\elk\elasticsearch\bin\service install”
You should get an output that looks as follows:
Installing service      :  "elasticsearch-service-x64"

Using JAVA_HOME (64-bit):  "C:\Program Files\Java\jdk1.8.0_1

The service 'elasticsearch-service-x64' has been installed.
Next, we’re going to open the service manager for the Elasticsearch service:
$ Invoke-Expression -command “c:\elk\elasticsearch\bin\service manager”

This is where you customize settings for Elasticsearch. Memory for JVM, for example, can be configured on the Java tab, which is important for when you start to ingest large quantities of data.
On the General tab, we’re going to select the “Automatic” startup type and hit the “Start” button to start Elasticsearch. To make sure that all is running as expected, enter the following URL into your browser:
http://localhost:9200
You should get the following output:
{

 "name" : "Andrew Chord",

 "cluster_name" : "elasticsearch",

 "version" : {

   "number" : "2.3.5",

   "build_hash" : "90f439ff60a3c0f497f91663701e64ccd01edbb4",

   "build_timestamp" : "2016-07-27T10:36:52Z",

   "build_snapshot" : false,

   "lucene_version" : "5.5.0"

 },

 "tagline" : "You Know, for Search"

}
Installing Logstash
Next up is Logstash. Now, there are a number of ways to install Logstash on Windows, but it cannot be installed as a service out-of-the-box. So, I’ll be using a service manager called Non-Sucking Service Manager (NSSM), which I have downloaded and extracted into the folder that contains all of our installed ELK packages.
Now, download and extract Logstash from the Logstash download page to the same folder.
Before installing Logstash NSSM, create a Logstash configuration file called “config.json” and place it in the “bin” directory.
Next, enter the following command in Powershell (be sure to update the paths invoked):
$ Invoke-Expression -command “c:\elk\nssm\win64\nssm install Logstash”
You should see the NSSM dialog:

For the application path, browse to and select the Logstash .bat file. The “Startup” directory field below is completed automatically. In the “Arguments” field, enter:
-f c:\elk\logstash\bin\config.json
There are other options you can configure such as tying the service to Elasticsearch, but for the purpose of this guide, these settings will suffice.
Click the “Install Service” button and a success message will be displayed. In Powershell, you will see the following message:
Service "Logstash" installed successfully!

Open Windows Task Manager and start the service from the “Services” tab.
Installing Kibana
As with Logstash, we will install Kibana as a Windows service using NSSM. Download and extract Kibana from the Kibana download page.
Use this command in Powershell to create the service:
$ Invoke-Expression -command “c:\elk\nssm\win64\nssm install Kibana”
In the NSSM dialog, complete the relevant paths to the Kibana files (there is no need to pass any arguments for Kibana) and click “Install service”:
Service "Kibana" installed successfully!
As with Logstash, start the service from your Task Manager — you should now have all three services up and running!

To verify, open your browser at this address: http://127.0.0.1:5601.

Congrats! You’ve successfully installed the ELK Stack on your Windows server!
As you may notice — Kibana is notifying you that it could not fetch mapping. This is because you have not shipped any data yet. This is, of course, the next step. If you’re trying to set up a pipeline of Windows event logs into ELK, I described how to install and use Winlogbeat (a log shipper by Elastic for shipping event logs into ELK) in this additional guide to Windows event log analysis.
Logz.io is a predictive, cloud-based log management platform that is built on top of the open-source ELK Stack and can be used for log analysis, application monitoring, business intelligence, and more. Start your free trial today!
↧
Building an NGINX Access Log Monitoring Dashboard

NGINX is still trailing relatively far behind Apache, but there is little doubt that it is gaining more and more popularity — w3tech has NGINX usage at 31%, trailing behind Apache’s 51%. This trend contradicts certain difficulties the NGINX community sometimes laments such as its lack of ease-of-use and quality documentation. For now, it seems NGINX’s low memory usage, concurrency, and high performance are good enough reasons to put those issues aside.
Like with any web server, the task of logging NGINX is somewhat of a challenge. NGINX access and error logs can produce thousands of log lines every second — and this data, if monitored properly, can provide you with valuable information not only on what has already transpired but also on what is about to happen. But how do you extract actionable insights from this information? How do you effectively monitor such a large amount of data?
This article describe how we at Logz.io overcome this particular challenge by monitoring our NGINX access log with our ELK Stack (Elasticsearch, Logstash and Kibana).
NGINX access logs contain a wealth of information including client requests and currently-active client connections that if monitored efficiently, can provide a clear picture of how the web server — and the application that it is serving — is behaving.
Analyzing the NGINX access log
By default, NGINX will log information on requests made to the web server to the /logs/access.log file (error logs are written to the /logs/error.log file). As soon as a request is processed by NGINX, the entry is added to the log file in a predefined format:
109.65.122.142 - - [10/Aug/2016:07:06:59 + 000] "POST /kibana/elasticsearch/_msearch?timeout=30000&ignore_unavailable=true&preference=1447070343481 HTTP/1.1" 200 8352 "https://app.logz.io/kibana/index.html" "Mozilla/5.0 (X11; Linux armv7l) AppleWebKit/537.36 (KHTML, like Gecko) Ubuntu Chromium/45.0.2454.101 Chrome/45.0.2454.101 Safari/537.36" 0.465 0.454
You can, of course, configure the format and the location of the log file (more on this in the NGINX documentation), but a quick look at the sample log line above tells us two things. First, there is a lot of useful data to analyze such as the request URL, HTTP response code, and client IP address. Second, analyzing this data together with the data collected from other sources is going to be a huge headache. That’s where ELK comes to the rescue — the stack makes it easy to ship, store, and analyze all the logs being generated by your NGINX web server. It’s NGINX log analysis made easy.
Your first task is to establish a log pipeline from your server to the ELK instance of your choice. This is NOT the focus of this article — but here are few quick tips for setting up the pipeline.
Installing ELK
First, decide which ELK stack you want to use — either a self-hosted one or a cloud-hosted solution such as Logz.io. This decision can save you hours of work, so do your research well, and try and consider the pros and cons (hint: it’s all depends on the amount of resources at your disposal!).
Parsing and shipping
Decide which log forwarder to use to ship the logs into ELK. There are a number of ways to forward the logs into Elasticsearch, the most common one being Logstash — the stack’s workhorse that is responsible for parsing the logs and forwarding them to an output of your choice.
Important! Think carefully how you want to parse your NGINX access logs — parsing makes sure that the access logs are dissected and subsequently indexed properly in Elasticsearch. The more you invest in this, the easier it will be later to analyze the logs in Kibana.
Here is an example of a Logstash configuration file for shipping and parsing NGINX access logs into Elasticsearch. In this case, we’re using a wildcard configuration to monitor both the NGINX access and error logs. The filter used here is the one used by us at Logz.io to parse NGINX logs:
input {
  file {
    type => nginx_web
    path => ["/var/log/nginx/*"]
    exclude => ["*.gz"]
  }
 }

 filter {
  grok {
   match => [ "message" , "%{COMBINEDAPACHELOG}+%{GREEDYDATA:extra_fields}"]
   overwrite => [ "message" ]
 }

 mutate {
   convert => ["response", "integer"]
   convert => ["bytes", "integer"]
   convert => ["responsetime", "float"]
 }

 geoip {
   source => "clientip"
   target => "geoip"
   add_tag => [ "nginx-geoip" ]
 }

 date {
   match => [ "timestamp" , "dd/MMM/YYYY:HH:mm:ss Z" ]
   remove_field => [ "timestamp" ]
 }

 useragent {
 source => "agent"
 }
}

 output {
  elasticsearch { embedded => true }
 }
There are other log shippers you can use — such as Filebeat or Fluentd — but for the sake of simplicity, you’ll probably want to start with Logstash. (See our comparison of Fluentd versus Logstash.)
Creating a monitoring dashboard
Once your NGINX access logs are being shipped into Elasticsearch, it’s just a matter of deciding which data you wish to visualize and monitor in a dashboard. I say “just”, but the truth of the matter is that this task can be extremely time-consuming if you don’t know your way around Kibana or don’t entirely understand how your NGINX access logs are being parsed.
For that reason, Logz.io provides a library of ready-made visualizations and dashboards called ELK Apps. Basically, in just (no quotation marks this time!) one click, you can get started with the NGINX monitoring dashboard described below (learn more about ELK Apps here).
But for those who are not using Logz.io, the next section will show how we created this dashboard as well as explain the metrics that we thought were important to extract and monitor in NGINX access logs.
Geo access
Being able to monitor where requests are being made to the server is the most obvious visualization to include in any monitoring dashboard. Knowing from where in the world people are accessing your website is important not only for troubleshooting and operational intelligence but also for other use cases such as business intelligence (as explained in this article) as well.
Constructing a geo-access visualization is pretty straightforward if the access logs are being parsed correctly.
The configuration for the visualization uses a metric count aggregation (counting the number of requests) and a bucket geohash aggregation of the geoip.location field.

NGINX Average Bytes
Monitoring the average number of bytes being sent by NGINX is a great way to identify when something in your environment is not performing as expected. There are two extremes that may indicate something is wrong — when the number bytes is either drastically lower or drastically higher than average. In both cases, you will first need to be acquainted with the average value during regular circumstances.
The configuration for this line chart visualization includes a Y axis displaying an average value for the bytes field and an X axis using the Date Histogram aggregation type:

NGINX URLs
Which URLs are visited the most times is probably one of the most important metrics to monitor as it gives you an idea of which request to NGINX occurs more often than not. When something goes wrong, this can be a good place to start because it might indicate which service crashed your entire environment.
The configuration for this bar chart visualization includes a Y count axis and an X axis using the Terms aggregation type for the request field (the example is configured to show the top 20 results):
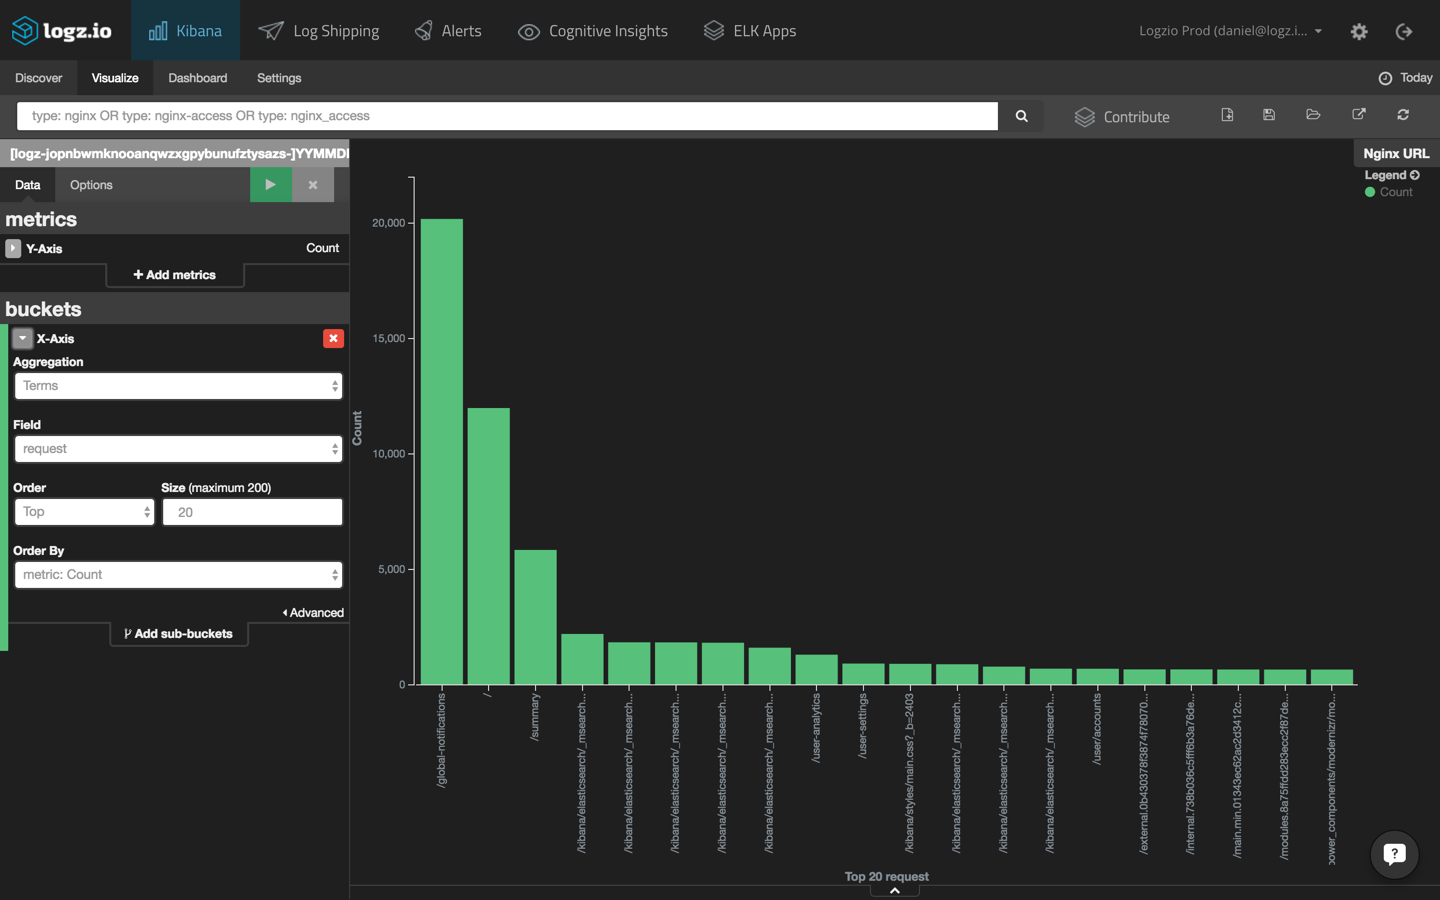
NGINX HTTP Code
Seeing a breakdown of the HTTP codes being returned for requests made to your NGINX web server is extremely important to get a general overview of the health of your environment.
Under regular circumstances, you will expect to see an overwhelming majority of “200” responses. When you begin to see “400” and above responses, you will know something is wrong (ideally, you’d be able to use an alerting mechanism on top of ELK to notify you of such occasions).
The configuration for this bar chart visualization is identical except that this time we are using the “response” field for the X axis:

NGINX Access User Agents
While not crucial for operational intelligence, seeing which client agents are sending requests to NGINX is useful for gathering business intelligence. For example, say you added a new feature only available for a specific newer version of Chrome and want to understand which user segment will not be able to use it — this would be a great way to find out.
The configuration for this data table visualization consists of a metric count aggregation, and a bucket configured to aggregate the agent field (this example is also set to display the top 20 results):
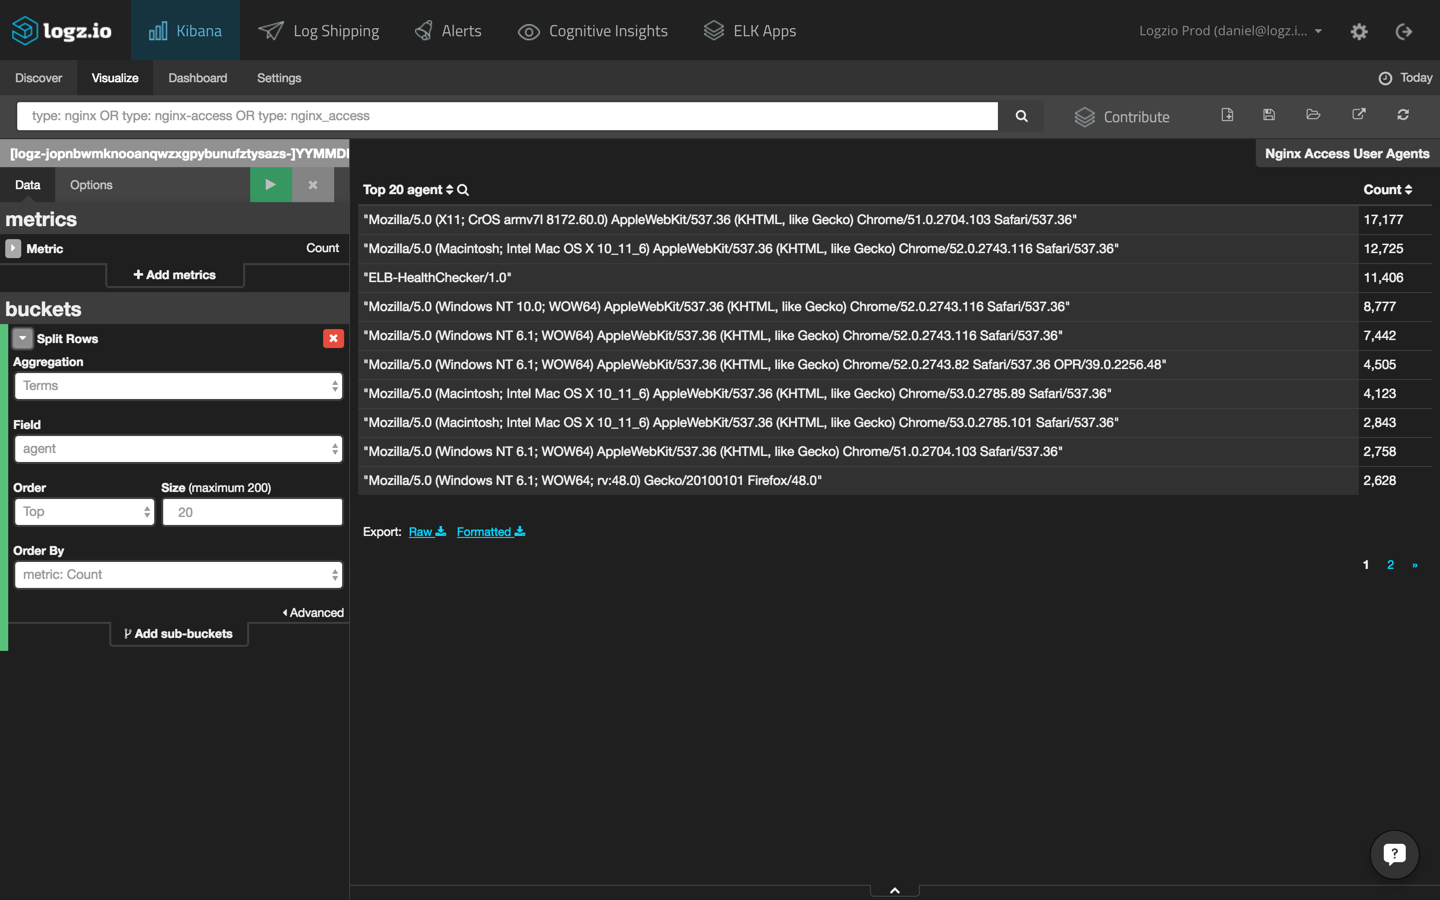
NGINX by OS/Country/Browser
Last but not least, I’ve grouped together these four visualizations since their configurations are almost identical. They all provide the top twenty values for metrics on the client sending out the request to the server — the top twenty operating systems, countries, and browsers.
The configuration for these pie chart visualizations consists of a metric count aggregation and a bucket configured to aggregate the geoip.country_name field (that is set to display the top 20 results).
To build the other visualizations, we simply switched the field to: name (for the top 20 browsers) and os (for the top 20 operating systems):
Once you have all of your visualizations ready, it’s just a matter of going to the Dashboard tab and compiling them together.
The result is a comprehensive monitoring dashboard that gives you real-time data on how your NGINX server is being accessed:
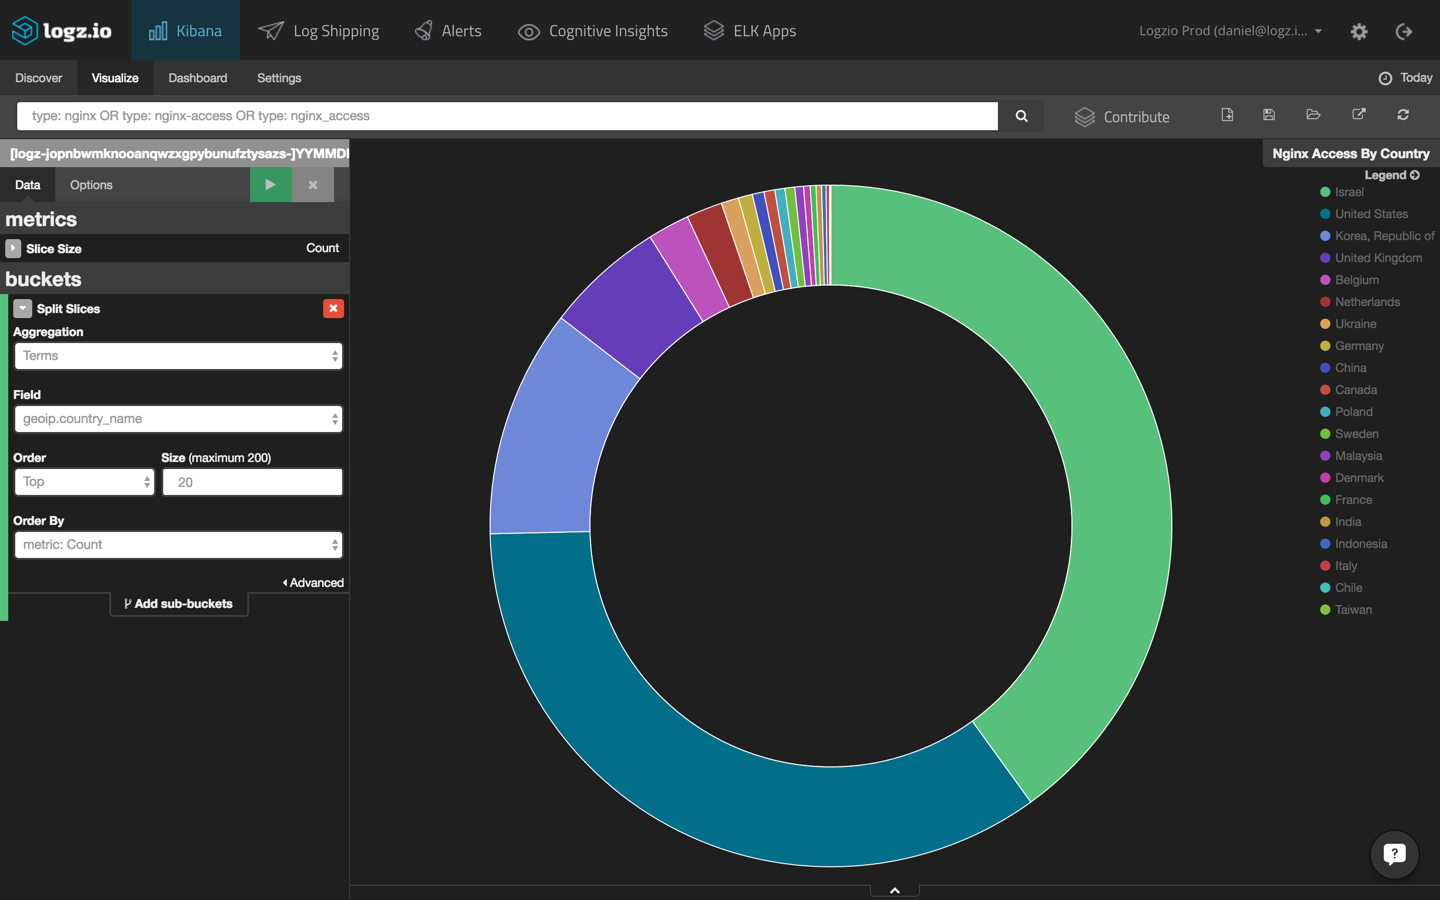
Summary
Analyzing your NGINX access logs provides you with not only good visibility into the health and activity patterns of your environment but also the operational and business intelligence needed to improve and enhance your product. Adding error logs into the picture (by easily shipping the error log into ELK as well) does run the risk of adding another layer to your monitoring but also enables you the option of identifying correlations between the two logs and thus also enables faster troubleshooting.
There are many paid solutions out there for monitoring NGINX such as NGINX Plus — a comprehensive offering that includes monitoring out-of-the-box. Naturally, it all depends on the resources you have available. To construct the dashboard above, you “just” need some time to put together some open source technologies.
Logz.io is a predictive, cloud-based log management platform that is built on top of the open-source ELK Stack and can be used for log analysis, application monitoring, business intelligence, and more. Start your free trial today!
↧
Monitoring Magento Visitor Logs with the ELK Stack

Magento is a powerful eCommerce platform written in PHP that provides merchants with an online shopping cart system. According to w3tech, Magento is the fourth most popular PHP-based CMS in use, trailing after general-purpose platforms WordPress, Joomla, and Drupal.
Magento ships with common e-commerce features such as shopping carts and inventory management and allows site administrators to customize their stores completely to support different business needs. Magento also has a powerful logging system that tracks user activity. The generated event logs can be used to analyze customer behavior, but the main challenge is to aggregate the logs in one centralized platform and quickly get actionable insights.
The ELK Stack (Elasticsearch, Logstash, Kibana) can be used to analyze the large volume of logs that are generated by Magento. Once collected by Logstash and stored in Elasticsearch, these logs can be analyzed in real time and monitored using Kibana’s rich visualization features.
This post will introduce you to Magento logging and describe how to establish a pipeline of visitor logs into the Logz.io ELK Stack.
Enabling Magento visitor logs
Magento provides two types of logging systems out-of-the-box, one for development purposes and the other for tracking visitor activity in the its online store.
The Magento development logging framework is used by developers to log Magento system errors and runtime execution exceptions, so it is not the focus of this article. Magento visitor logging enables site admins to track user logs and provides details on a customer’s activity such as login and logout time, the devices used by the customer, and the specific stores visited by the customer.
The first step is to enable visitor logging in your Magento store. Access the Magento admin panel interface, and go to System -> Configuration:
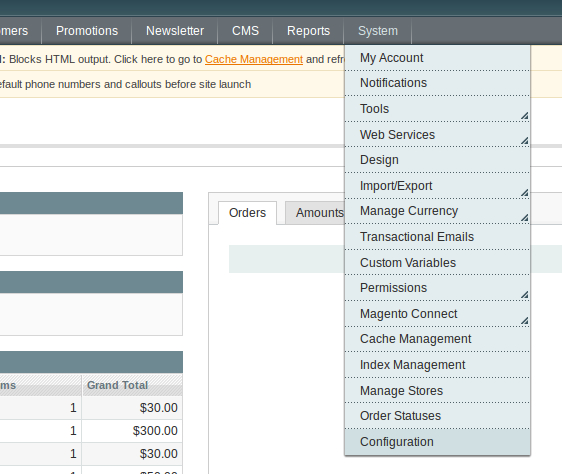
Under the Advanced section, select System from the menu:
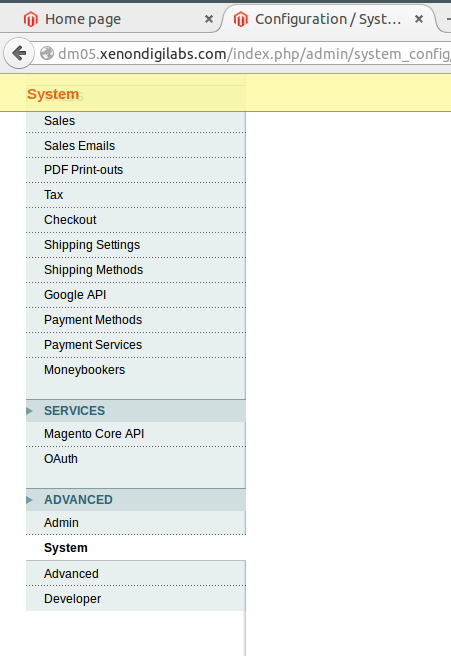
Magento will now display advanced system settings. In the Log section, set the value for “Enable Log” to “Yes.” Save the configuration.
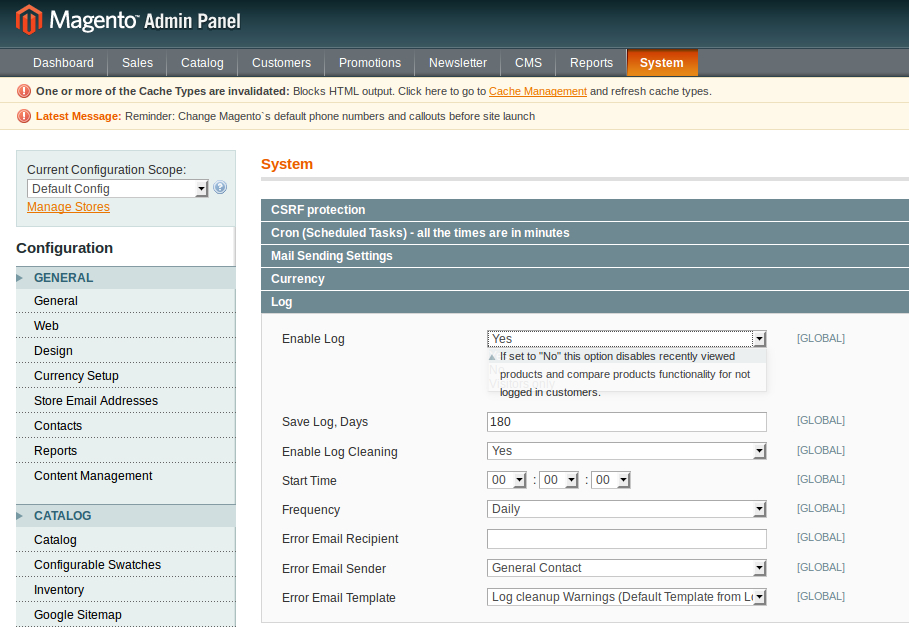
From this point onwards, visitor logs will be generated whenever a user visits the Magento store. As specified above, these logs include information about user login and logout times, customer IDs, the devices used to access the store, store IDs, and more.
These logs are stored in the MySQL database that you had provided when you had set up Magento. If you explore the database, you will find the following tables for logging purposes:
- log_customer – information about customer login/logout times and dates
- log_visitor – information about visitor sessions
- log_visitor_info – visitor location information such as IP addresses and time zones
- log_visitor_online – date and time of the first and last visit as well as the last visited URL
- log_summary – visitor summary report by a date
- log_summary_type – summary types and descriptions
- log_url – visited URLs for each visitor
- log_url_info – information about visited URLs
- log_quote – contains quotes history by visitors
- index_event – events that occurred for products and catalogs
- report_event – history of visitor and customer actions in stores
- report_viewed_product_index – history of viewed products
- report_compared_product_index – history of compared products
- catalog_compare_item – compared products by customer
- dataflow_batch_export – history of batched exports
- dataflow_batch_import – history of batched imports
As an example, access your MySQL database and run the following query:
Select * from log_customer;
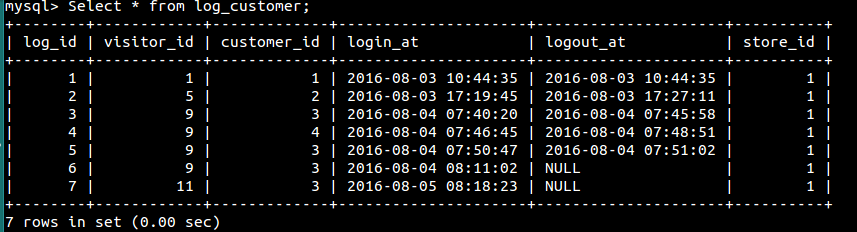
Collecting logs with Fluentd
The next step is to collect the logs using Fluentd, a log collector that aggregates, parses, and forwards logs to an output destination of choice.
There are a number of requirements necessary here before we start.
First, you will need Fluentd running on your system.
Next, you will use a Fluentd MySQL plugin to connect with the database and retrieve visitor logs.
Install the plugin by running the following command:
fluent-gem install fluent-plugin-sql --no-document
We will also need to install the mysql2 adapter because it is a requirement for the Fluentd MySQL plugin. To install use:
fluent-gem install mysql2
Next, we’re going to configure our Fluentd configuration file at /etc/td-agent/td-agent.conf:
<source>
   @type sql

   host <your host>
   adapter mysql2
   database Magento  # your Magento database
   username <mysql username>
   password <mysql password>

   select_interval 4s  # optional
   select_limit 500     # optional

   state_file /tmp/sql_state  # ath to a file to store last rows

   <table>
      table logzio_logs  # table to get data from
      update_column visit_time  # column to track the update
      time_column visit_time
      tag Magento_logs
   </table>
</source>
Enter your MySQL credentials in the file.
Please note that as a table name, we have provided the name of a table that does not exist yet: logzio_logs.
That’s our next step, but instead of creating a table called logzio_logs, we will create a table view with the data from our Magento logs:
<em>create view logzio_logs as select * from log_customer NATURAL JOIN log_url natural join log_visitor natural join log_visitor_info;</em>
Streaming Logs from Fluentd to Logz.io
We’ve collected the logs from MySQL, and the only missing piece is to ship them to ELK.
To stream logs from Fluentd to the Logz.io ELK stack, you will need to install the Fluentd Logz.io output plugin:
gem install fluent-plugin-logzio
We will now update the Fluentd configuration file at /etc/td-agent/td-agent.conf:
<source>
   @type sql

   host <your host>
   adapter mysql2
   database Magento  # your Magento database
   username <mysql username>
   password <mysql password>

   select_interval 4s  # optional
   select_limit 500     # optional

   state_file /tmp/sql_state  # ath to a file to store last rows

   <table>
      table logzio_logs  # table to get data from
      update_column visit_time  # column to track the update
      time_column visit_time
      tag Magento_logs
   </table>
</source>

<match Magento_logs>
      type logzio
      endpoint_url http://listener.logz.io:8090?token=< your Logz.io token >
</match>
After saving the configuration file, restart Fluentd. If all goes as expected, Fluentd will start streaming data from your database into the Logz.io ELK stack.
Open Kibana to view the data:
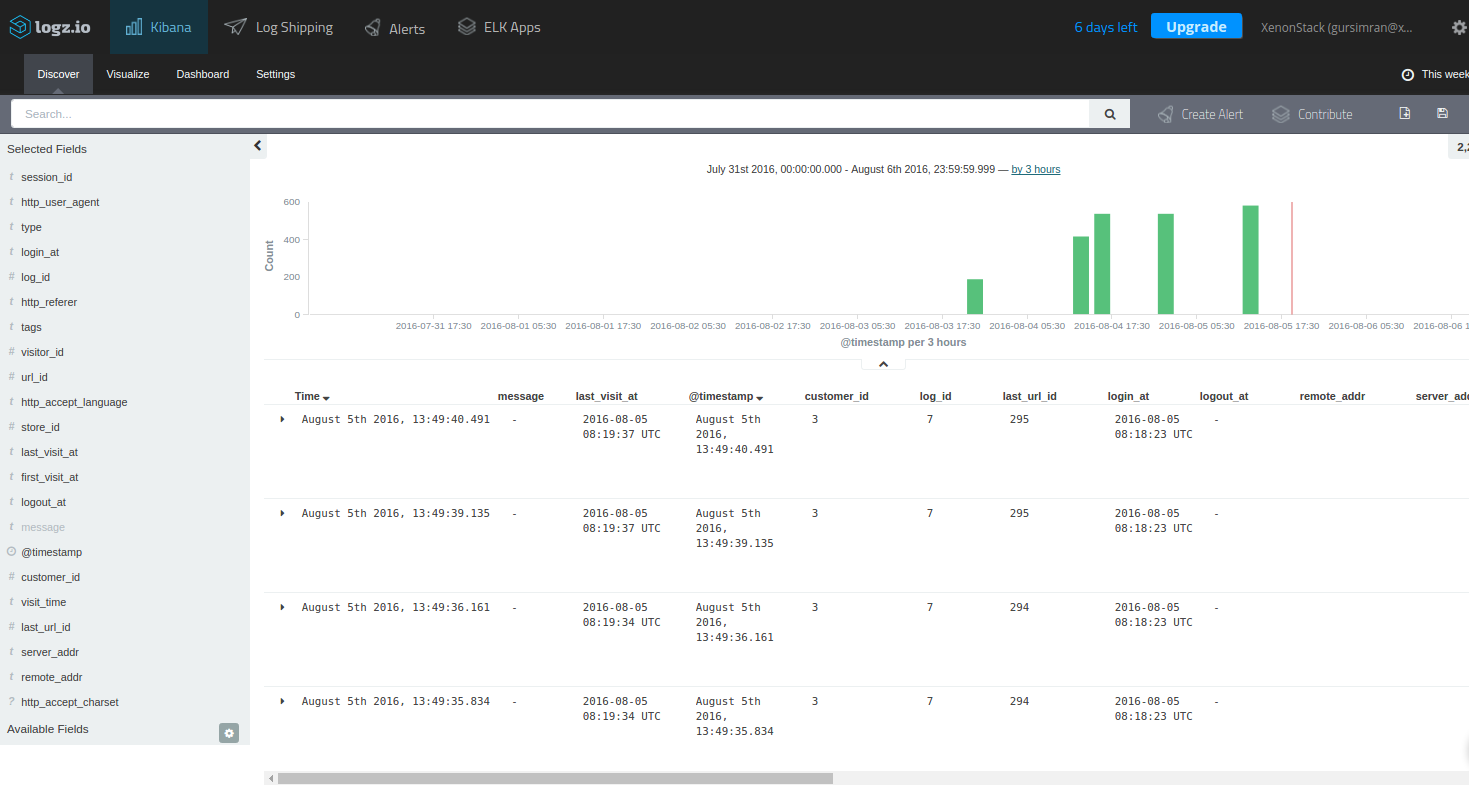
Visualize visitor logs in Kibana
Great! We’ve got the Magento visitor logs stored in ELK. What now?
The next step is to begin to analyze the data. Kibana has extensive querying capabilities including field-level and full-text search, regular expressions, and logical statements. You can use the fields listed on the left to get more insight into the logs and understand how they are indexed in Elasticsearch.
Once you’ve pinpointed the data in which you are interested, the next step is to visualize it. Below are a few examples of how to visualize Magento visitor logs.
Number of visits
The most obvious place to start is to visualize the number of visits made by customers per day.
In Kibana, select the Visualize tab and then the Line Chart visualization type. Under Buckets for the X axis, select the Terms aggregation using the last_visit_at field. You can also select the order (Top or Bottom) and size (how many records to visualize). Here is the configuration:
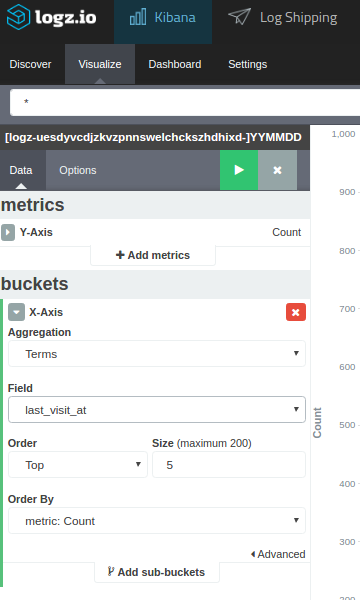
Hit the green play button, and you will see the line chart showing user visits over time:
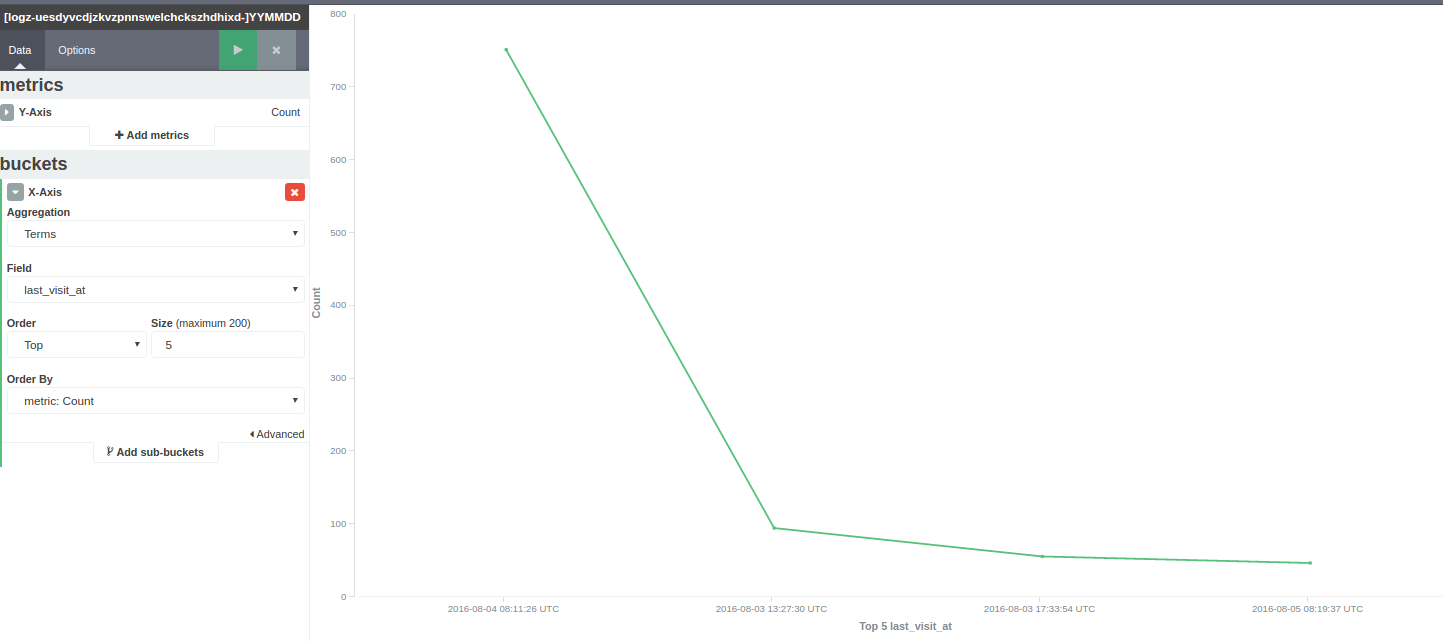
Users by device
Another option is to visualize the devices used by users, this time using the pie chart visualization.
Again, select the Visualize tab and then the pie chart visualization type. This time, we’re going to use the Terms aggregation using the http_user_agent field:
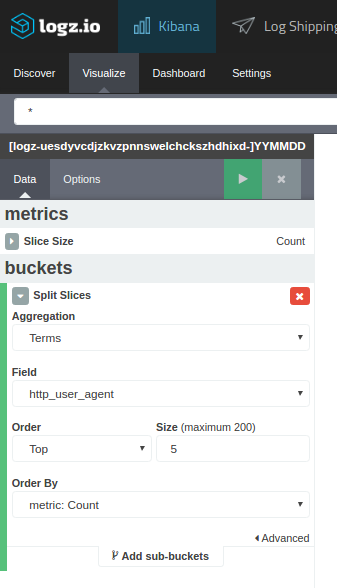
And the visualization:
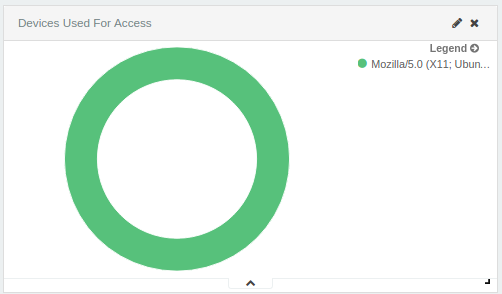
There are plenty of additional visualizations that can be created to see which store is visited the most by the customers, the amount of time spent per visit, a list of usernames, and other information. The sky’s the limit. After creating the visualizations, you can easily consolidate all of them into a single dashboard to monitor visitor activity in your Magento store:
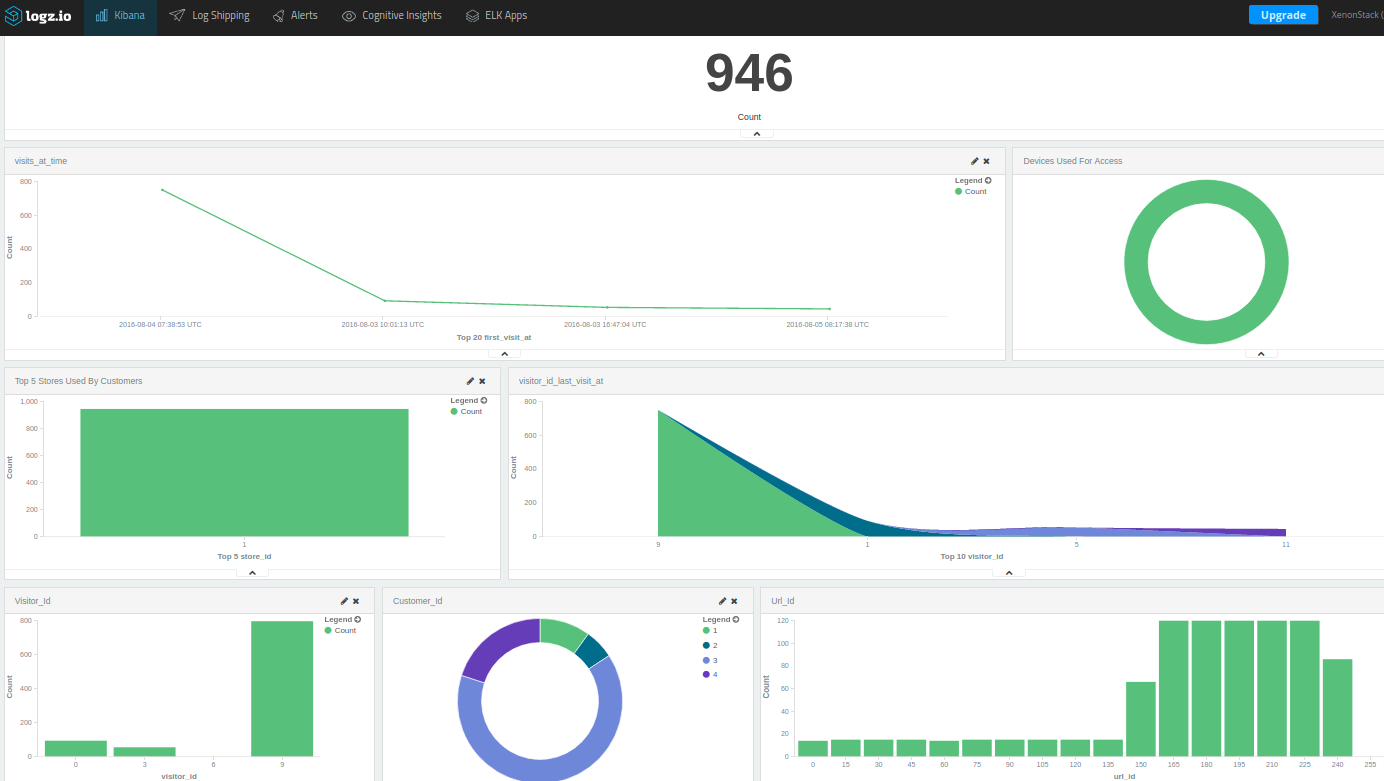
A final note
Magento has some great built-in logging features but as with any streaming of big data, the challenge is how to handle the data and gain actionable insight from it. A centralized logging solution combining Magento with the ELK Stack easily provides the ability to handle the large amount of logs being generated by your visitors and then analyze that information.
Our next Magento post will be more developer-oriented and will focus on logging Magento system and execution logs with ELK. Stay tuned!
Logz.io is a predictive, cloud-based log management platform that is built on top of the open-source ELK Stack and can be used for log analysis, application monitoring, business intelligence, and more. Start your free trial today!
↧