The Payment Card Industry Data Security Standard (PCI-DSS) is a common proprietary IT compliance standard for organizations that process major credit cards such as Visa and MasterCard. The standard was created to increase control of cardholder data to reduce credit card fraud. The PCI-DSS specifies twelve requirements for compliance (PDF) and explicitly requires that organizations implement log management (requirement 10):
Track and monitor all access to network resources and cardholder data. Logging mechanisms and the ability to track user activities are critical in preventing, detecting and minimizing the impact of a data compromise. The presence of logs in all environments allows thorough tracking, alerting and analysis when something does go wrong. Determining the cause of a compromise is very difficult, if not impossible, without system activity logs.
In this post, we will describe how to build a PCI Compliance dashboard with the ELK (Elasticsearch, Logstash, Kibana) log management stack. We will use several tools including OSSEC Wazuh and demonstrate how to build a PCI-DSS dashboard.
For simplicity, we will use the Logz.io-hosted ELK-as-a-Service, but everything that is described below can be done with any installation of the open source ELK Stack. Two additional methods for integrating ELK using the OSSEC Docker image and Logstash are included at the end of this post.
Deploying OSSEC Wazuh
OSSEC is a scalable, multi-platform, open source/intrusion detection system (HIDS). OSSEC helps to implement PCI-DSS by performing log analysis, checking file integrity, monitoring policy, detecting intrusions, and alerting and responding in real time. It is also commonly used as a log analysis tool that supports the monitoring and analyzing of network activities, web servers, and user authentications. OSSEC is comprised of two components: the central manager component, which receives and monitors the incoming log data, and agents that collect and send information to the central manager.
Wazuh has developed modules for OSSEC integration with log management platforms. To integrate OSSEC HIDS with the ELK Stack, we will create the PCI dashboard with Wazuh HIDS modules because they improve the manager.
In our example below, we used two servers – one for the manager and one for a single agent. For testing purposes, it’s also possible to have these both on the same server.
OSSEC is multi-platform, but for the sake of simplicity we will use Ubuntu Servers (in our example, we used AWS EC2 instances).
Start by downloading the OSSEC Wazuh from GitHub and installing the development tools and compilers.
For Ubuntu the commands are:
sudo apt-get update
sudo apt-get install gcc make git
The following are the commands to download the project from GitHub, compile it and install:
mkdir wazuh_ossec && cd wazuh_ossec
git clone https://github.com/wazuh/ossec-wazuh.git
cd wazuh-_ossec
sudo ./install.sh
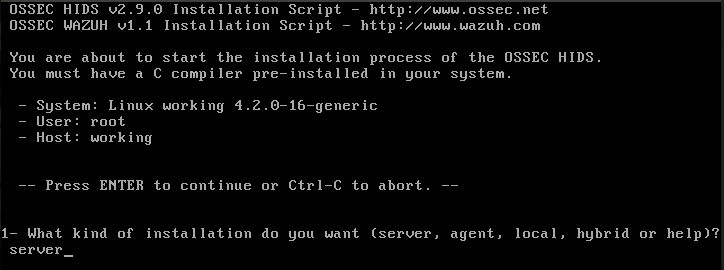
The image below illustrates the Wazuh HIDS installation phase. We want to install the central manager service, and this field in our case will contain the server value.
![]()
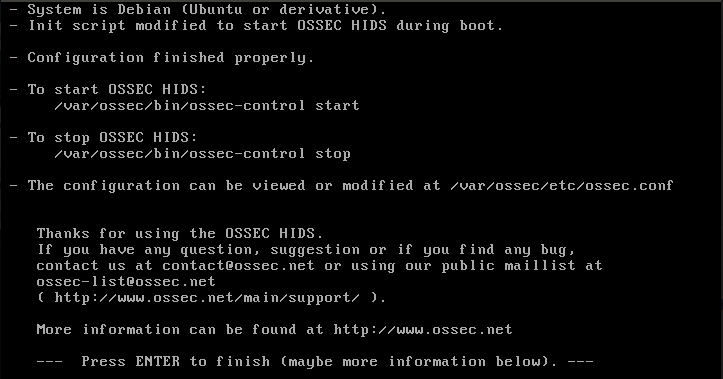
The other settings are related to other services we want to use. These include services such as emailed notifications and file integrity checks, which monitor files on servers and calculate the checksums on every change of a particular file. This is important to detect unauthorized modification of critical OS and other system files (PCI requirement # 11.5).
![]()
Once the installation is done, you can start the OSSEC manager with the command:
sudo /var/ossec/bin/ossec-control start
The following manager commands can validate that everything is working as expected:
$ ps aux | grep ossec
root 1017 0.0 0.1 15024 1524 ? S 23:01 0:00 /var/ossec/bin/ossec-execd
ossec 1021 0.1 0.4 20248 4236 ? S 23:01 0:00 /var/ossec/bin/ossec-analysisd
root 1025 0.0 0.1 31604 1624 ? S 23:01 0:00 /var/ossec/bin/ossec-logcollector
root 1037 0.0 0.1 7380 2732 ? S 23:01 0:00 /var/ossec/bin/ossec-syscheckd
ossec 1040 0.0 0.1 18312 1708 ? S 23:01 0:00 /var/ossec/bin/ossec-monitord
$ sudo lsof /var/ossec/logs/alerts/alerts.json
COMMAND PID USER FD TYPE DEVICE SIZE/OFF NODE NAME
Ossec-ana 1021 ossec 11w REG 252,1 7388 402765 /var/ossec/logs/alerts/alerts.json
$ sudo cat /var/ossec/logs/alerts/alerts.json
{“rule”: {“level”: 3, “comment”: “Login session opened.”, “sidid”: 5501, “firedtimes”: 2, “groups”: [“pam”, “syslog”, “authentication_success”], “PCI_DSS”:[“10.2.5”]....}}
The next step is to install the agent on our second server. For the Ubuntu Server OS (the Wily version — for other Ubuntu version types, check these other Wazuh repositories), you’ll have to add Ubuntu repositories with the following command:
echo -e "deb http://ossec.wazuh.com/repos/apt/ubuntu wily main" >> /etc/apt/sources.list.d/ossec.list
After adding the repositories, update the repository with the command apt-get update and install the OSSEC agent with the commands:
$ apt-get update
$ apt-get install ossec-hids-agent
Just before the end of the installation process, the agent will allow you to enter the manager IP address. Enter the manager IP address or just leave it as 127.0.0.1.
To configure the manager and agent on your OSSEC manager server, run the next command:
$ sudo /var/ossec/bin/manage_agents
Select ‘A’ to add an agent:
(A)dd an agent (A).
(E)xtract key for an agent (E).
(L)ist already added agents (L).
(R)emove an agent (R).
(Q)uit.
Choose your action: A,E,L,R or Q: A
You’ll then need to enter agent A’s name, an IP address, and an ID.
In our case, we needed to enter the agent-001 (note that the ID will be generated for you if you leave that field empty).
The next step is to extract the agent’s key because this is the key we will use to import data from the agent. Now, instead of using the “A” option, we will type “E” and then enter the agent ID.
Note: The configuration file /var/ossec/etc/ossec.conf contains the section client, where you can also type the manager’s IP address (if not done previously):
<ossec_config>
<client>
<server-ip>MANAGER_IP_ADDRESS</server-ip>
</client>
On the agent server, run the program /var/ossec/bin/manage_agents and use option “I” to import the key from the agent’s server (the one we want to monitor):
(I)mport key from the server (I).
(Q)uit.
Choose your action: I or Q: I
* Provide the Key generated by the server.
* The best approach is to cut and paste it.
*** OBS: Do not include spaces or new lines.
Paste it here (or '\q' to quit): <KEY FROM SERVER>
Agent information:
ID:<ID>
Name:<agent name>
IP Address:<agent IP address>
Confirm adding it?(y/n): y
Your agent has now been added, and you should use the following command to restart it to apply the changes:
$ /var/ossec/bin/ossec-control restart
Integrating Wazuh with the ELK Stack
Now that you have Wazuh installed, the next step is to integrate it with the ELK Stack hosted by Logz.io (see the bonus section at the end of the article for different methods of integrating these two stacks). If you do not have a Logz.io account, you can begin your free trial here.
S3 Syncing and Shipping
To ingest your Wazuh data into the Logz.io ELK Stack, you can use the Amazon S3 storage service. Sync the OSSEC folder containing your logs with a specific S3 bucket (which we named ossec-logs, in this example) and then establishing a shipping pipeline from S3 into Logz.io.
Use the AWS CLI sync command to copy all new and updated files consistently from the OSSEC server to a specified S3 bucket. On the OSSEC manager server, we created a job that executes the following command:
$ aws s3 sync /var/ossec/logs/alerts/ s3://ossec-logs/$(date +"%Y-%m-%d-%H")
The $(date + “%Y-%m-%d-%H) portion of the command helps to group the logs hourly on S3.
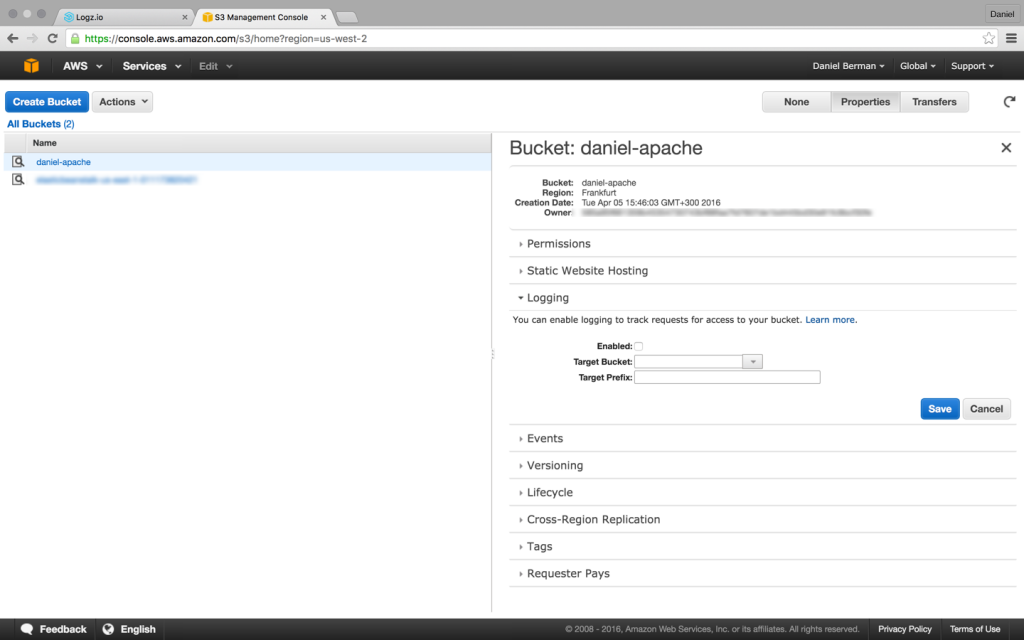
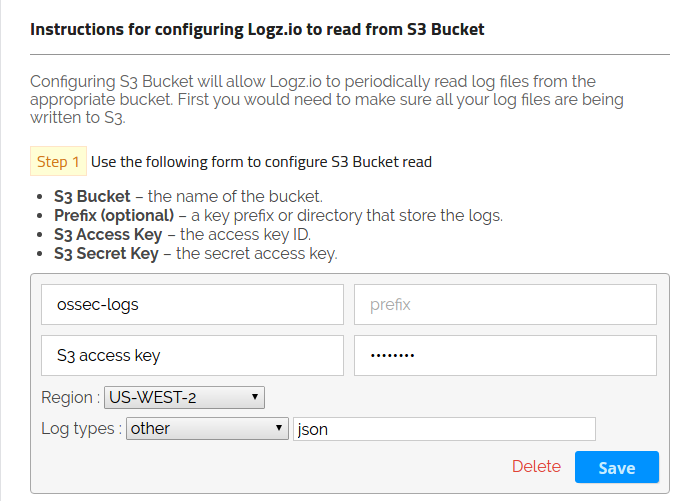
To ship the data from S3 to Logz.io, select the Log Shipping tab located at the top of the Logz.io dashboard, expand the AWS item on the right menu of the Log Shipping page, and click S3 Bucket.
![]()
![]()
As shown above, enter the S3 bucket name and the S3 access secret keys. You can leave the prefix empty; Logz.io will find all sub-groups inside this bucket for you.
Next, select the region where the bucket is located, and in the last step, select other as the log types, and enter the json in the field that appears after selecting other from the drop-down box. This ensures that Logz.io parses the json correctly. Click Save, and you will be ready to ship the logs from S3.
Creating a PCI Compliance Dashboard
Once your pipeline is established, you can begin to analyze the logs in Kibana. Your next step to create a visual dashboard that will contain relevant PCI compliance visualizations for identifying trends and correlations within the data.
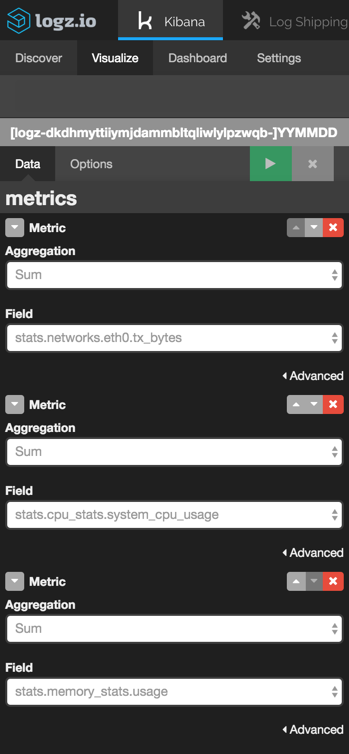
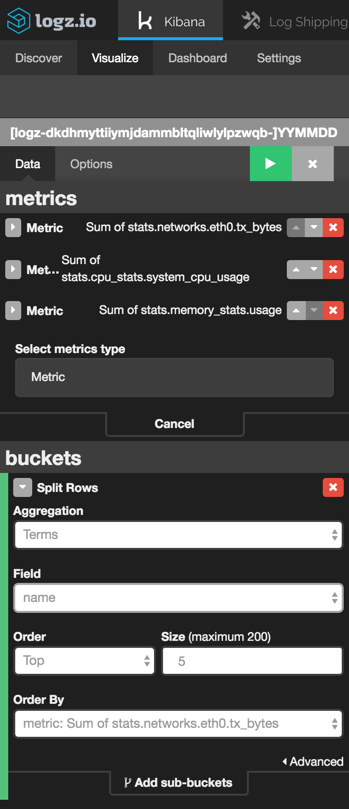
As an example, we’re going to create a line chart depicting PCI requirements over time.
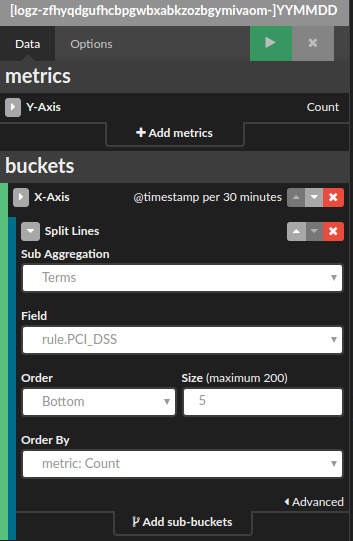
Open the Visualize tab in Kibana and select the Line Chart visualization tab. Configure the X axis of the visualization to aggregate by time and use the field rule.PCI_DSS as a sub-aggregation. The configurations should look as follows:
![]()
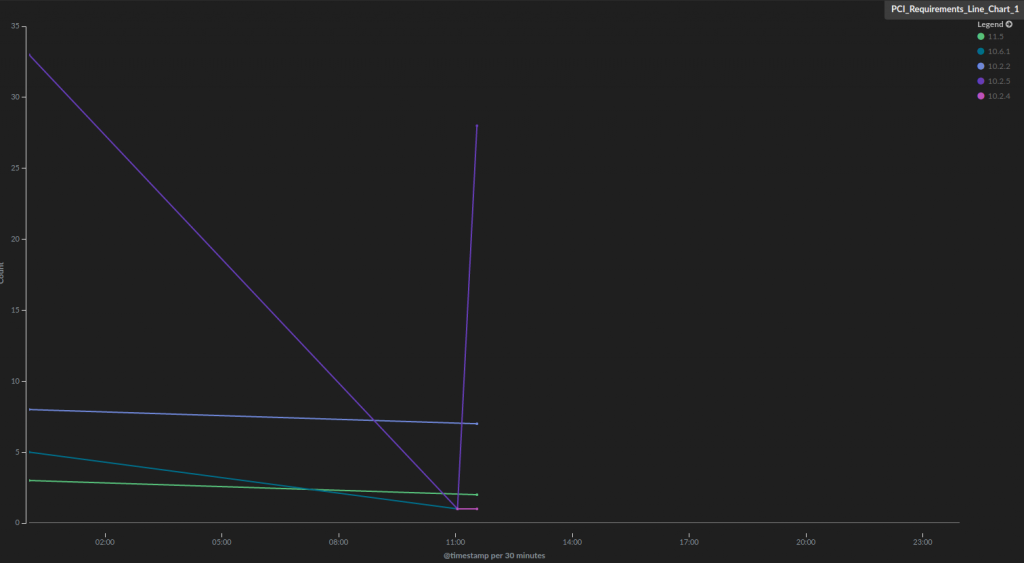
Hit the Play button to view a preview of the visualization.
![]()
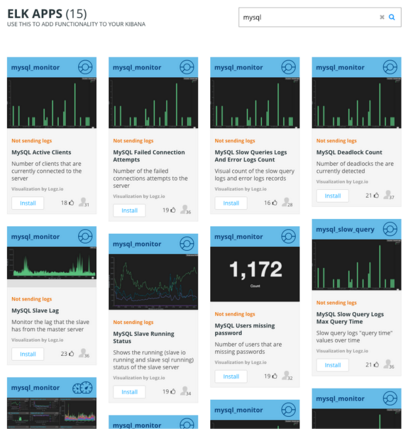
This is one example of visualizing Wazuh data that is being ingested into Elasticsearch. We created a PCI Compliance dashboard that contains a series of relevant PCI compliance visualizations that are all available in the ELK Apps gallery — our library of pre-made Kibana visualizations, dashboards, and searches that are customized for specific types of data.
To install the dashboard, open the ELK Apps tab and search for “PCI Compliance.” All you have to do next is hit the Install button.
![]()
In addition to the PCI Requirements Over Time visualization described above, here’s a list of the other available visualizations in this dashboard:
PCI-DSS Requirements – the time distribution of PCI-DSS requirement
6.1
OSSEC Alerts – alerts triggered by the OSSEC manager
File Integrity – two visualizations that show the number of file changes on the host and a list of files with details on checksums and relevant PCI-DSS requirements
High Risk Alerts – the number of high risk alerts over time (the high risk alerts for the current configuration of Wazuh OSSEC are those that have an
AlertLevel greater than 10)
High Risk Traffic Meter – a general indicator on high risk alerts in your environment
Each OSSEC alert log stored in Elasticsearch is tagged with PCI requirements for where it belongs. As a result, it is possible to track logs based on their PCI requirements number — and that gives you a better picture about the state of the system over time.
Using Wazuh’s PCI Dashboard
Wazuh also provide an easy way of adding a PCI dashboard to Kibana.
In the Objects section of the Kibana Settings, click the Import button to load the dashboard. After clicking the Import button, select the file and then refresh the Kibana page to see the imported dashboards:
![]()
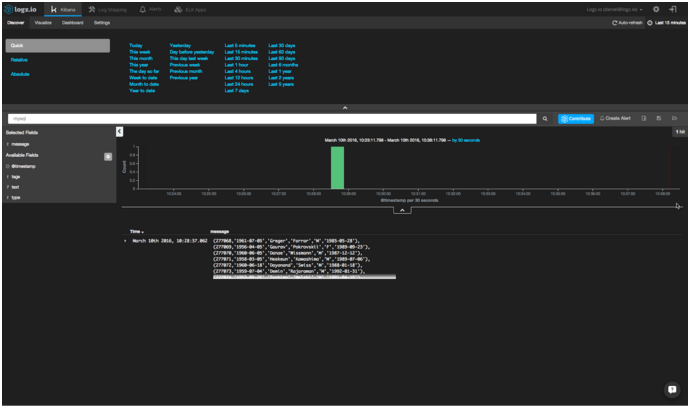
Now, you can go back to the Dashboard section of Kibana and select the PCI Compliance dashboard. To get a list of loaded dashboards, click the Open icon to go to the dashboard:
![]()
PCI-DSS Dashboard for AWS
Amazon physical infrastructure already complies with PCI-DSS; however, you are still responsible for implementing the monitoring and detection of your environment for security misconfiguration and vulnerabilities. To have that, you need to send logs from your account and network security activities. In this section, we will guide you on how to create a few alerts and build a dashboard.
Note: Information on enabling different kind of logs such as CloudTrail and VPC can be found in a prior guide of ours on building a SIEM dashboard for your AWS environment.
In real-life scenarios, it is recommended that you install a vulnerability scanner. For example, rootsh and Snort will prevent intrusions and give you better insights into overall network traffic as well as the intentions of any attackers.
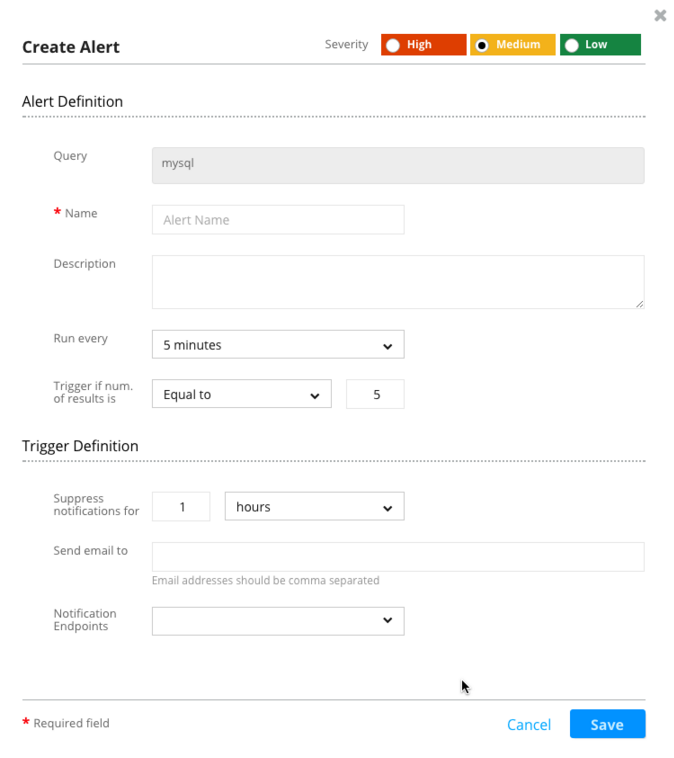
In this example, we will start by creating automated alerts when log data from CloudTrail or VPC Flow logs reveals that specific, defined events are occurring. In this example, we will create two types of alerts: one that uses CloudTrail logs to detect multiple failures when attempting to log into an AWS console, and one that users VPC flow logs to check connection destination ports.
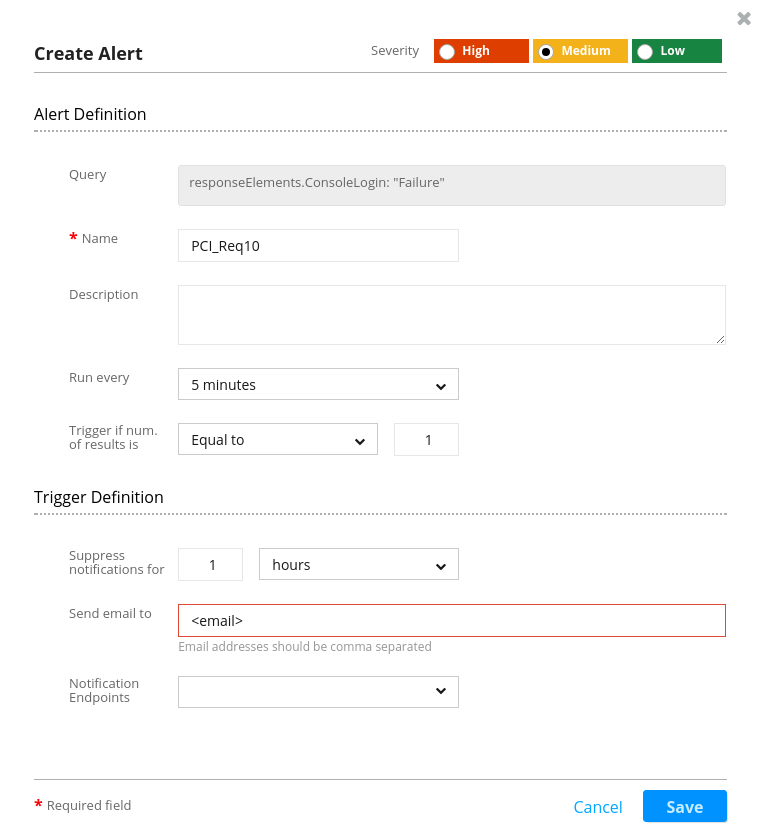
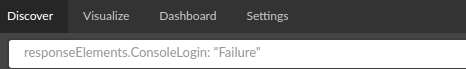
The first alert satisfies the aforementioned PCI-DSS compliance requirement #10 to “track and monitor all access to network resources and cardholder data.” It will track user Login failure from CloudTrail.
The query responseElements.ConsoleLogin:”Failure” is used for filtering logs that contain information on failed logins due to authentication failure:
![]()
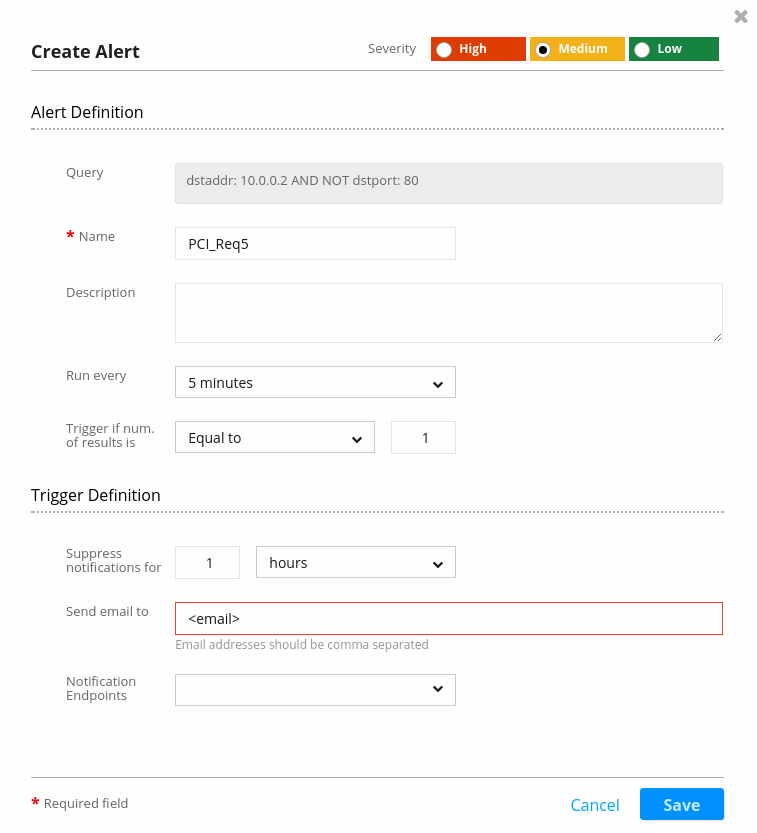
The next alert is the one tagged with PCI requirements #1 and #5. In this case, we created the alert that will check the VPC destination port.
The query in the alert for requirement #5 will check the VPC flow logs and — for server 10.0.0.2 — try to determine whether there some open ports that are not 80 (http):
![]()
![]()
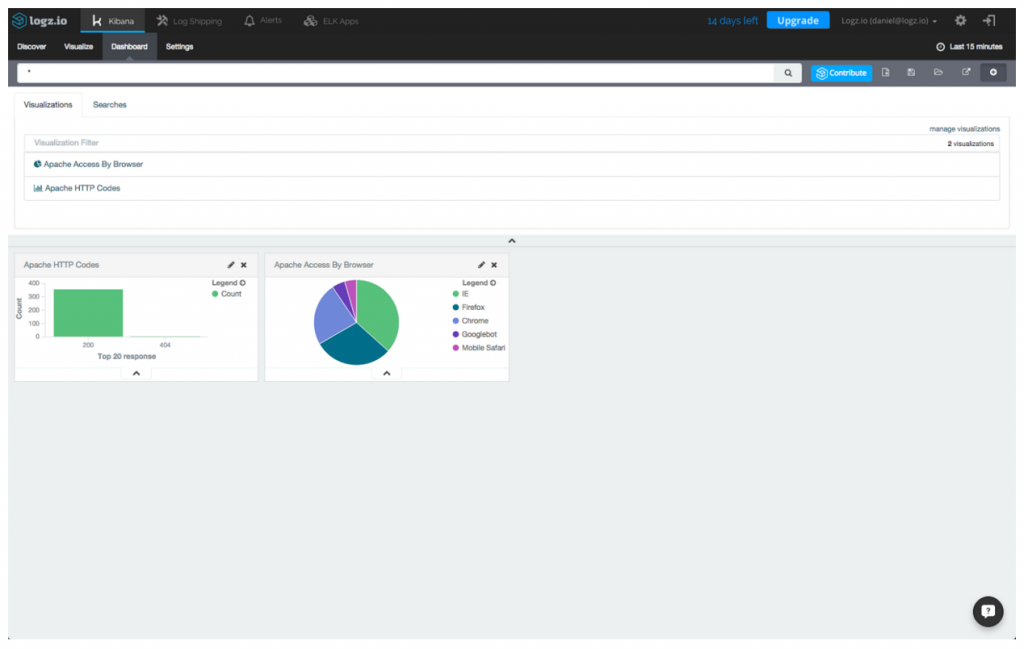
After we created a few charts using existing logs to monitor for login failures, vulnerabilities, and account changes, we can put all of the widgets into a single dashboard:
![]()
A Final Note
We hope that this guide will help you to take the next step in the implementation of PCI-DSS compliance, and we invite you to get in touch with us for any specific questions or support.
Logz.io is a predictive, cloud-based log management platform that is built on top of the open-source ELK Stack. Start your free trial today!
Bonus 1: Using the OSSEC Docker
Another way of integrating Wazuh with the ELK Stack is using the OSSEC Docker image.
The ossec-elk container includes the OSSEC manager and the ELK stack.
To install the ossec-elk container, run the following command:
$ docker run -d -p 55000:55000 -p 1514:1514/udp -p 1515:1515 -p 514:514/udp -p 5601:5601 -v ~/mnt/ossec:/var/ossec/data --name ossec wazuh/ossec-elk
Mounting the /var/ossec/data directory allows the container to be replaced without any configuration or data loss.
The next step is to install the agent as already explained in the sections above. Once done, you will need to add the new agent using the following command:
$ docker exec -it ossec /var/ossec/bin/manage_agent
After adding the new agent, restart the OSSEC manager with the following command:
$ docker exec -it ossec /var/ossec/bin/ossec-control restart
When the manager and agent are ready, we can access Kibana using the URL: http://<your_docker_ip>:5601 to create the dashboard.
![]()
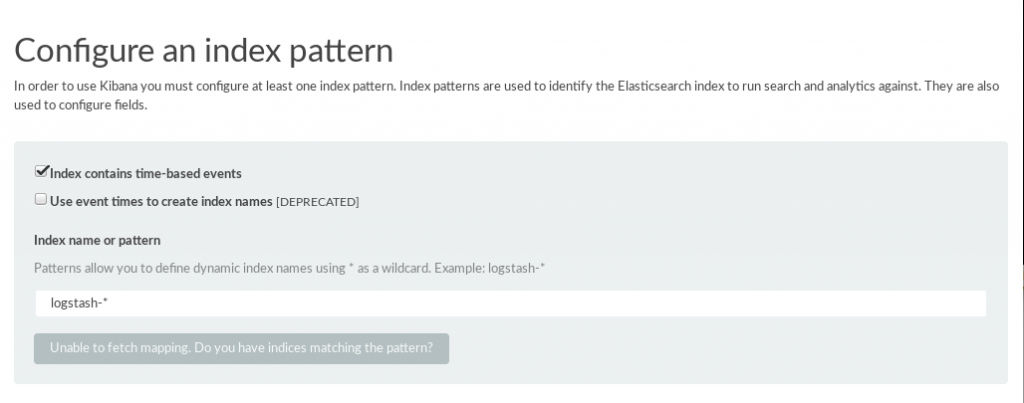
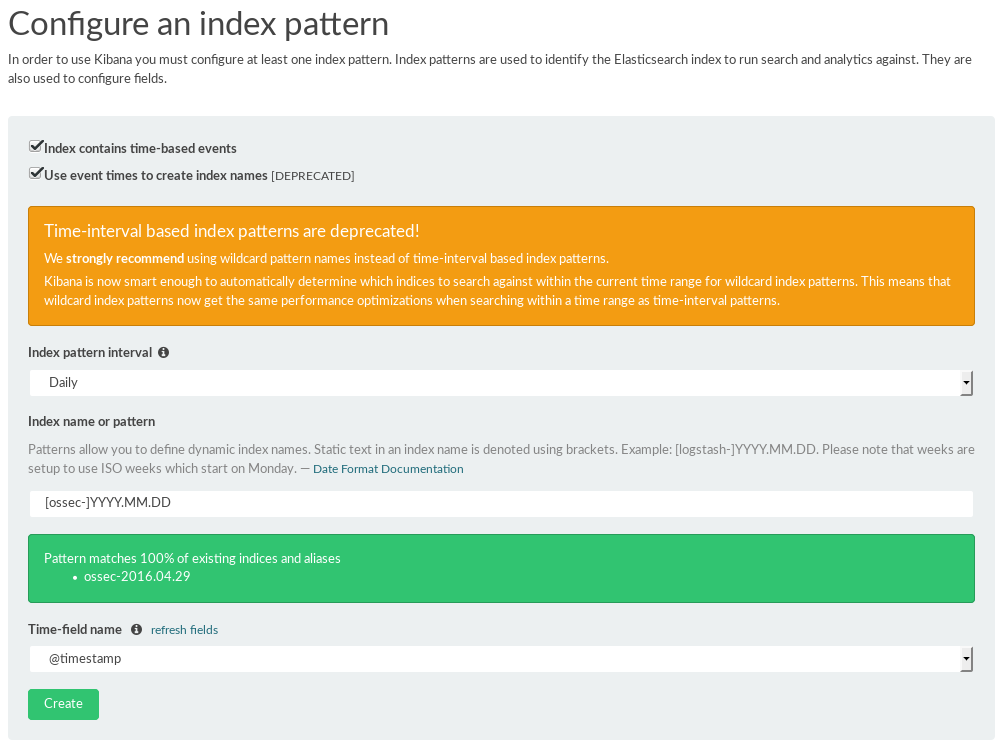
Kibana will ask you to configure the index pattern. Kibana will do this automatically, but we need to point to the correct index pattern. Select the “Use event times to create index names” option, and then select the Daily value (as illustrated in the screen below) in the index pattern interval. For the index name or pattern, enter [ossec-]YYYY.MM.DD. By default, Kibana will select the @timestamp value in the Time-field name box. To finish, click Create.
![]()
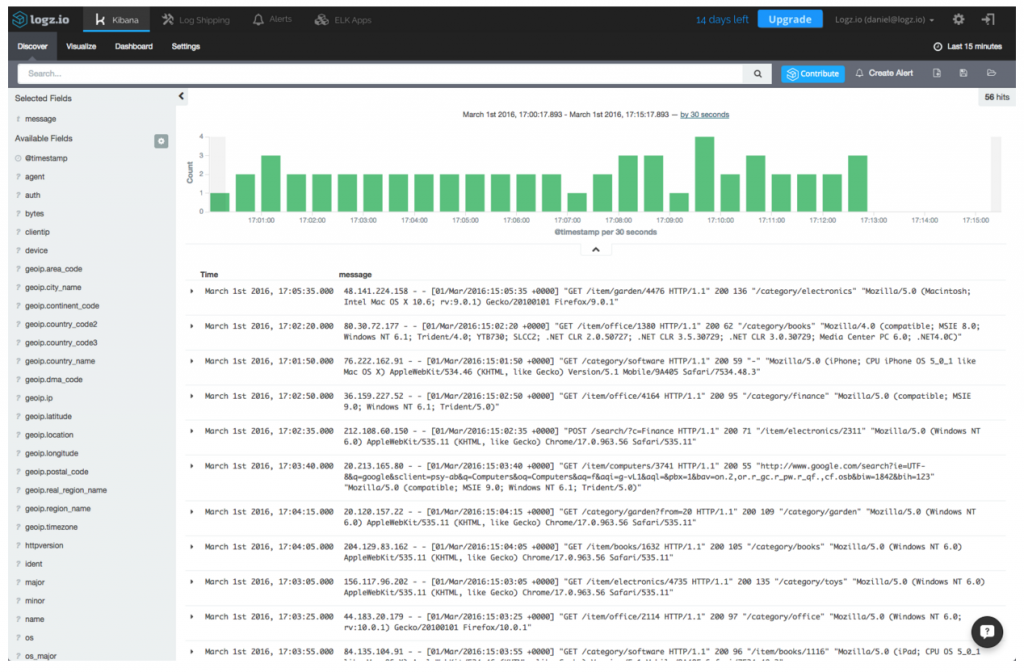
In the Discover section, you will see the log events that the OSSEC manager has received and processed:
![]()
Bonus 2: Using Logstash
One final way to forward Wazuh data into Logz.io or your own ELK Stack is with Logstash.
Depending on whether your architecture is single-hosted or distributed, we will configure the Logstash server to read OSSEC alerts directly from the OSSEC log file.
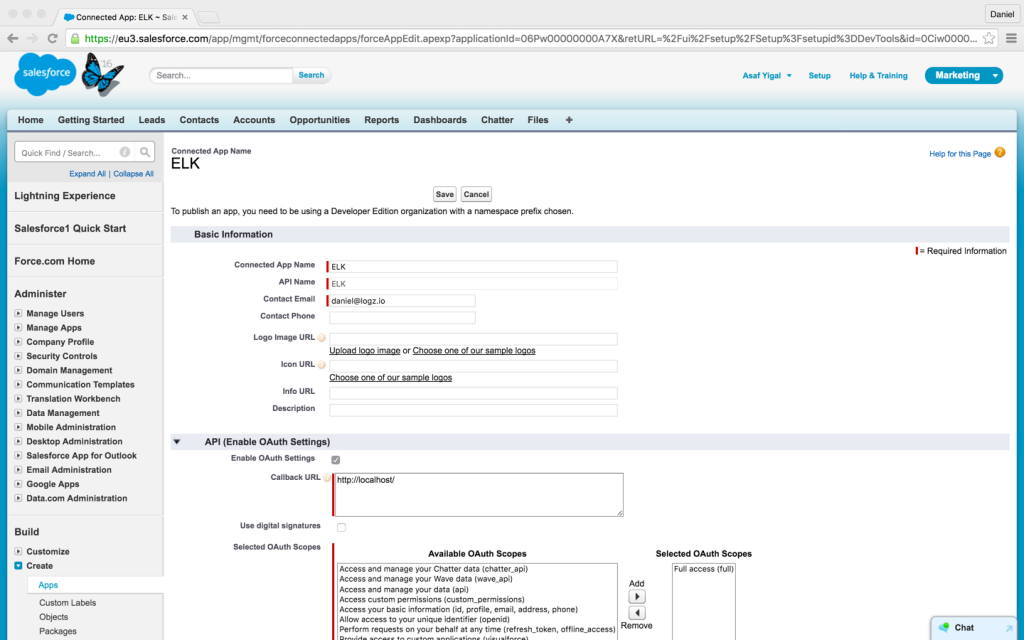
First we will install Logstash on the OSSEC manager server and then configure Logstash to ship the log data to Logz.io. As illustrated in the screen below, we have to use mutate in the filter plugin and add_field with the token:
![]()
The final Logstash configuration for shipping OSSEC alerts to Logz.io is as follows:
input {
file {
type => "ossec-alerts"
path => "/var/ossec/logs/alerts/alerts.json"
codec => "json"
}
}
filter {
geoip {
source => "srcip"
target => "geoip"
database => "/etc/logstash/GeoLiteCity.dat"
add_field => [ "[geoip][location]", "%{[geoip][longitude]}" ]
add_field => [ "[geoip][location]", "%{[geoip][latitude]}" ]
}
date {
match => ["timestamp", "YYYY MMM dd HH:mm:ss"]
target => "@timestamp"
}
mutate {
convert => [ "[geoip][location]", "float"]
rename => [ "hostname", "AgentName" ]
rename => [ "geoip", "GeoLocation" ]
rename => [ "file", "AlertsFile" ]
rename => [ "agentip", "AgentIP" ]
rename => [ "[rule][comment]", "[rule][description]" ]
rename => [ "[rule][level]", "[rule][AlertLevel]" ]
remove_field => [ "timestamp" ]
add_field => { "token" => <TOKEN> }
}
}
output {
   tcp {
      host => "listener.logz.io"
      port => 5050
      codec => json_lines
     }
}
This configuration will send logs from the OSSEC alert file to the Logz.io service, which automatically stores the logs in Elasticsearch with some renamed fields in order to fit with the dashboard that Wazuh created for Kibana. The important piece of the Logstash configuration is the addition of the token field. Without that, Logz.io will discard the logs.
Logz.io offers enterprise-grade ELK as a service
with alerts, unlimited scalability, and collaborative analytics
Start your free trial!
How to Build a PCI-DSS Dashboard with ELK and Wazuh was first posted on May 24, 2016 at 2:22 pm.
©2016 "
Logz.io". Use of this feed is for personal non-commercial use only. If you are not reading this article in your feed reader, then the site is guilty of copyright infringement. Please contact me at shani@anymation.co.il