Quantcast
Channel: Daniel Berman is Product Evangelist at Logz.io
Viewing all 198 articles
Browse latest View live

Comparing Apache Hive vs. Spark

$
0
0

Introduction

Hive and Spark are two very popular and successful products for processing large-scale data sets. In other words, they do big data analytics. This article focuses on describing the history and various features of both products. A comparison of their capabilities will illustrate the various complex data processing problems these two products can address.

What is Hive?

Hive is an open-source distributed data warehousing database which operates on Hadoop Distributed File System. Hive was built for querying and analyzing big data. The data is stored in the form of tables (just like RDBMS). Data operations can be performed using a SQL interface called HiveQL. Hive brings in SQL capability on top of Hadoop, making it a horizontally scalable database and a great choice for DWH environments.

A Bit of Hive’s History 

Hive (which later became Apache) was initially developed by Facebook when they found their data growing exponentially from GBs to TBs in a matter of days. At the time, Facebook loaded their data into RDBMS databases using Python. Performance and scalability quickly became issues for them, since RDBMS databases can only scale vertically. They needed a database that could scale horizontally and handle really large volumes of data. Hadoop was already popular by then; shortly afterward, Hive, which was built on top of Hadoop, came along. Hive is similar to an RDBMS database, but it is not a complete RDBMS.

Why Hive?

The core reason for choosing Hive is because it is an SQL interface operating on Hadoop. In addition, it reduces the complexity of MapReduce frameworks. Hive helps perform large-scale data analysis for businesses on HDFS, making it a horizontally scalable database. Its SQL interface, HiveQL, makes it easier for developers who have RDBMS backgrounds to build and develop faster performing, scalable data warehousing type frameworks.

Hive Features and Capabilities

Hive comes with enterprise-grade features and capabilities which can help organizations build efficient, high-end data warehousing solutions.

Some of these features include:

  • Hive uses Hadoop as its storage engine and only runs on HDFS.
  • It is specially built for data warehousing operations and is not an option for OLTP or OLAP.
  • HiveQL is an SQL engine which helps build complex SQL queries for data warehousing type operations. Hive can be integrated with other distributed databases like HBase and with NoSQL databases like Cassandra

Hive Architecture

Hive Architecture is quite simple. It has a Hive interface and uses HDFS to store the data across multiple servers for distributed data processing.

Hive

Hive for Data Warehousing Systems 

Hive is a specially built database for data warehousing operations, especially those that process terabytes or petabytes of data. It is an RDBMS-like database, but is not 100% RDBMS. As mentioned earlier, it is a database which scales horizontally and leverages Hadoop’s capabilities, making it a fast-performing, high-scale database. It can run on thousands of nodes and can make use of commodity hardware. This makes Hive a cost-effective product that renders high performance and scalability.     

Hive Integration Capabilities

 Because of its support for ANSI SQL standards, Hive can be integrated with databases like HBase and Cassandra. These tools have limited support for SQL and can help applications perform analytics and report on larger data sets. Hive can also be integrated with data streaming tools such as Spark, Kafka and Flume.

Hive’s Limitations

 Hive is a pure data warehousing database which stores data in the form of tables. As a result, it can only process structured data read and written using SQL queries. Hive is not an option for unstructured data. In addition, Hive is not an ideal for OLTP or OLAP kinds of operations.

What is Spark?

Spark is a distributed big data framework which helps extract and process large volumes of data in RDD format for analytical purposes. In short, it is not a database, but rather a framework which can access external distributed data sets using RDD (Resilient Distributed Data) methodology from data stores like Hive, Hadoop, and HBase. Spark operates quickly because it performs complex analytics in-memory.

What Is Spark Streaming?

 Spark streaming is an extension of Spark which can stream live data in real-time from web sources to create various analytics. Though there are other tools, such as Kafka and Flume, that do this, Spark becomes a good option performing really complex data analytics is necessary. Spark has its own SQL engine and works well when integrated with Kafka and Flume.

A Bit of Spark’s History

Spark was introduced as an alternative to MapReduce, a slow and resource-intensive programming model. Because Spark performs analytics on data in-memory, it does not have to depend on disk space or use network bandwidth .

Why Spark?

The core strength of Spark is its ability to perform complex in-memory analytics and stream data sizing up to petabytes, making it more efficient and faster than MapReduce. Spark can pull the data from any data store running on Hadoop and perform complex analytics in-memory and  in parallel. This capability reduces Disk I/O and network contention, making it ten times or even a hundred times faster. Also, data analytics frameworks in Spark can be built using Java, Scala, Python, R, or even SQLs.

Spark Architecture

Spark Architecture can vary depending on the requirements. Typically, Spark architecture includes Spark Streaming, Spark SQL, a machine learning library, graph processing, a Spark core engine, and data stores like HDFS, MongoDB, and Cassandra.

spark

Spark Features and Capabilities

Lightning-fast Analytics

Spark extracts data from Hadoop and performs analytics in-memory. The data is pulled into the memory in parallel and in chunks, then the resulting data sets are pushed across to their destination. The data sets can also reside in the memory until they are consumed.

Spark Streaming

Spark Streaming is an extension of Spark which can live-stream large amounts of data from heavily-used web sources. Because of its ability to perform advanced analytics, Spark stands out when compared to other data streaming tools like Kafka and Flume.

Support for Various APIs

Spark supports different programming languages like Java, Python and Scala which are immensely popular in big data and data analytics spaces. This allows data analytics frameworks to be written in any of these languages.

Massive Data Processing Capacity

 As mentioned earlier, advanced data analytics often need to be performed on massive data sets. Before Spark came into the picture, these analytics were performed using MapReduce methodology. Spark not only supports MapReduce, it also supports SQL-based data extraction. Applications needing to perform data extraction on huge data sets can employ Spark for faster analytics.

Integration with Data Stores and Tools

 Spark can be integrated with various data stores like Hive and HBase running on Hadoop. It can also extract data from NoSQL databases like MongoDB. Spark pulls data from the data stores once, then performs analytics on the extracted data set in-memory, unlike other applications which perform such analytics in the databases.

Spark’s extension, Spark Streaming, can integrate smoothly with Kafka and Flume to build efficient and high-performing data pipelines.

Differences Between Hive and Spark

Hive and Spark are different products built for different purposes in the big data space. Hive is a distributed database, and Spark is a framework for data analytics.

Differences in Features and Capabilities

table

Conclusion

Hive and Spark are both immensely popular tools in the big data world. Hive is the best option for performing data analytics on large volumes of data using SQLs. Spark, on the other hand, is the best option for running big data analytics. It provides a faster, more modern alternative to MapReduce.

Monitor and analyze your machine data at scale with Logz.io!

What’s New in Elastic Stack 7.3

$
0
0

As if the temperature this summer was not high enough, this new major release of the Elastic Stack turns it up a notch with some hot new features. Bundling new ETL capabilities in Elasticsearch, a bunch of improvements in Kibana and a lot of new integration goodness in Filebeat and Metricbeat, Elastic Stack 7.3 is worth 5 minutes of your time to stay up to date.

Elasticsearch

As the heart of the stack, and per usual, I’m going to start with Elasticsearch. There are a lot of new enhancements and improvements on top of existing functionality so I tried to focus on new stuff.

Dataframes

What is probably the biggest Elasticsearch news in this 7.3  release, Dataframes is a new way to summarize and aggregate data in a more analysis-friendly and resource-efficient way. 

Using what is called a “transform” operation, users, in essence, transform an Elasticsearch index into a different format by first defining a “pivot” — a set of definitions instructing Elasticsearch how to summarize the data. The pivot is defined by first selecting one or more fields used to group your data and then the aggregation type (not all aggregation types are currently supported). The result, as said, is the data frame — a summary of your original time series data stored in another index. Transforms can run once or continuously. 

Data Frames is a beta feature which is licensed under the basic license.

New voting-only node type

A new “voting-only master-eligible” node type has been developed. Despite what is implied by the name, this node cannot actually act as a master in the cluster. What it can do is vote when electing a master and this can be useful as a tie-breaker. Because of this, is also takes up less resources and can run on a smaller machine.

Voting-only master-eligible nodes are licensed under the basic license. 

Flattened object type

Another interesting piece of Elasticsearch news is the support for flattened object types. 

Up until now, objects with a large number of fields had to be indexed into separate fields. This, of course, made mapping much more complicated and could potentially also affect the performance of the cluster. 

The new flattened type maps the entire object into a single field, indexing all subfields into one field as keywords (which can then be more easily queried and visualized). For now, only basic searches and aggregations can be used. 

The flattened object type is licensed under the basic license. 

Search improvements

The most important development in Elasticsearch search is a new aggregation type called rare_terms. This aggregation was developed to help identify terms with low document counts, an aggregation that promises to aid security-related searches that often focus on those least occurring events. 

Outlier detection

As the name of this feature implies, Outlier detection helps you identify outliers — data points with different values from those of normal data points. The way this is done is by analyzing the numerical fields for each document and annotating their “unusualness” in an outlier score which can be used for analysis and visualization. 

Outlier detection promises to be of use for both operational and security use cases, helping users detect security threats as well as unusual system performance, and is licensed under the basic license.

Logstash

This old horse is still the cornerstone of many data pipelines, despite the advent of alternative aggregators and enhancements made to Filebeat. Version 7.3 includes two interesting news items — improvements to pipeline-to-pipeline communication and better JMS support. 

Pipeline-to-pipeline communication 

The use case for this feature, as its name implies, is to enable users to connect between different processing pipelines on the same Logstash instance. By doing so, users can break up complicated pipelines into more modular units which can help boost performance and also allows more modular handling of the processing. 

Elastic has taken care of all the outstanding issues in this feature and is now encouraging users to give it a try. Pipeline-to-pipeline communication is still in beta.

JMS input

Logstash 7.3 now bundles the JMS input plugin by default. This plugin, used for ingesting data from JMS deployments, was greatly improved in the previous release of the stack, with the introduction of failover mechanisms, better performance, TLS and more. This article explains how to use this plugin to allow Logstash to act as a queue or topic consumer.
Kibana

Kibana 7.0 was such a huge leap in terms of the changes applied compared to previous versions that one can hardly expect changes of the same order of magnitude to be introduced in each major release. Still, Kibana 7.3 has some interesting new developments worth pointing out. 

Maps goes GA

I have previously mentioned Maps but now that this feature is fully available, I think it this is a great opportunity to dive deeper into this feature. Most Kibana users are familiar with the Coordinate Map and Region Map visualizations that can be used to geographically visualize data. Maps takes geographic visualization to an entirely new level, allowing users to add multiple layers on top of the map to visualize additional geospatial elements.

map

In this 7.3 release, other than going GA, Maps adds new customization options for layers, new ways to import geospatial data, top hits aggregation and enhanced tooltips. 

Maps is licensed under Elastic’s basic license. 

Logs

Kibana’s live tailing page, Logs, now has the ability to highlight specific details in the logs and also includes integration with Elastic APM, allowing users to move automatically from a log message to a trace and thus remain within the context of an event. Logs and APM are licensed under the basic license. 

Misc. usability enhancements

Kibana 7.3 adds a long list of minor but important usability improvements that are worth noting such as the ability to delete and restore Elasticsearch snapshots in the Snapshot and Restore management UI (basic license), export a saved search on a dashboard directly to CSV (basic license), show values directly inside bar charts, and use KQL and auto-complete in filter aggregations. 

Kerberos support

Other big Kibana news in 7.3 is support for a new SSO authentication type – Kerberos. Of course, Kibana already supports other SSO methods, namely SAML and OpenID Connect, all available for Platinum subscribers only and apparently not available for cloud offerings yet.

Beats

Beats have come a long way since first being introduced. Specifically, a lot of functionality has been added to the top two beats in the family — Filebeat and Metricbeat, to support better integration with popular data sources and version 7.3 continues this development line.

Enhanced Kubernetes monitoring

Kubernetes users using the Elastic Stack to monitor their clusters will be thrilled to hear that Metricbeat now includes new metricsets to monitor kube-controller-manager, kube-proxy and kube-scheduler. 

Automating Functionbeat

AWS users can now use a CloudFormation template for deploying Functionbeat. This ability promises to help automate data collection and shipping of data from AWS services instead of manually spawning up Functionbeat. Functionebeat is licensed under the Basic license.

Shipping from Google Cloud 

It appears like the new AWS module in Metricbeat was just the beginning of new integrations between cloud services and the stack. Filebeat now allows ingesting data from Google Cloud using a new Google Pub/Sub input and also support a new module for shipping Google VPC flow logs. These features are in beta and licensed under the basic license

Database support

A series of new features have been added to Filebeat and Metricbeat to better support monitoring specific databases, including Oracle, Amazon RDS, CockroachDB and Microsoft SQL.

Some endnotes

So, as usual, a lot of goodness is yet another feature-packed release. 

Interestingly, the vast majority of the new Elasticsearch, Logstash, Kibana and Beats code is under Elastic’s basic license and is highlighted as such in the respective release notes. This adds some clarity into licensing and usage limitations. I made sure to mention these features and also any feature in beta, but before looking into upgrading be sure to verify these conditions as well as breaking changes.

Enjoy!

Love ELK but hate maintaining it? Try Logz.io's hosted ELK solution.

10 Ways to Simplify Cloud Monitoring

$
0
0

Is monitoring in the cloud special enough to warrant a list of tips and best practices? We think so. On the one hand, monitoring in the cloud might seem easy since there is a large number of solutions to choose from. On the other hand, though, the dynamic and distributed nature of the cloud can make the process much more challenging. In this article, we’ll cover ten tips and best practices that will help you ace your cloud monitoring game.

1. Keep It Super Simple (KISS)

Every second spent on monitoring is a second not spent on your app. You should write as little code as possible, since you’ll have to test and maintain it. The time spent doing this adds up in the long run.

When evaluating a tool, the best question to ask yourself is, “How hard is it to monitor another service?” You will perform this operation very frequently, and the total effort to do so may skyrocket if you multiply it by the number of services under your command. Sure, there is some intrinsic complexity involved in setting up the tool, but if you have a choice between a tool that gets the job done and one that has more features and is harder to use, apply the You Ain’t Gonna Need It (YAGNI) rule.

After the initial setup, there is a maintenance phase. It’s a well-known fact that the only thing that stops planned work is unplanned work. You can minimize outages and failures by simplifying monitoring operations. For example, Prometheus does dependency inversion. It makes monitoring dependent upon your app, not the other way around (pull vs. push model). It also reduces operational complexity by making the collectors totally independent in a high availability (HA) setup—that’s one fewer distributed system for you to manage!

2. Instrumentation Is the Way

Once you choose a simple monitoring tool and set it up, the question of what to monitor arises. The answer? “The Four Golden Signals”, obviously! These are: latency, traffic, errors, and saturation.

But what does “latency” mean for your app, and what values are acceptable? There’s only a handful of people who know that: you, your fellow operators, the business, and the application developers. 

To embed this expertise into a monitoring system application requires instrumentation. This means that the services should expose relevant metrics. An additional value that comes with instrumentation is that every additional metric can be validated by business needs.

3. Automated Infrastructure Monitoring? Leave It to Your Provider

Some tools may tempt you with the promise of zero-configuration monitoring while lacking other features. These may include AI-based anomaly detection and automated altering. Have you ever wondered how can they provide the value if the quirks and the desired behaviors of your system are unknown to the tool?

You might say to yourself that these tools are great for monitoring infrastructure. Indeed, there are common tasks like load balancing or storing relational data that shouldn’t require manual instrumentation. But, if spinning up custom monitoring for your infrastructure is a problem, maybe you should be considering using a hosted solution from your provider instead.

The price tag on a cloud load balancer includes monitoring (as well as upgrades, failovers and fault remediation), so why not consider outsourcing standard utilities and focus on value-adding services instead? When thinking of running infrastructure on your own, make sure that you consider the full cost of maintaining it.

4. Make Sure Monitoring Can Keep Up With You

Everything changes in the cloud. The implications of these constant changes are not always straightforward, though. Another machine or service instance might appear without human interaction. Since changes to the state of your cloud environment are automated (by autoscaling rules, for instance), monitoring has to adjust accordingly. In the ideal world, we’d like to achieve something called location transparency at the monitoring level and refer to services by name, rather than by IP and port. The number of service instances (machines, containers, or pods) isn’t fixed.

The ideal monitoring tool should integrate seamlessly with the currently operating service discovery mechanism (like Consul or Zookeeper), with the clustering software (like Kubernetes), or with the cloud provider directly. According to the KISS principle discussed in the first paragraph, you shouldn’t need to write any adapters for infrastructure purposes.

Integration ubiquity isn’t a must, although it may reduce the amount of moving pieces. There should be no need to change a monitoring tool when switching cloud providers. Prometheus is an example of a product that balances integration and configuration requirements without vendor lock-in. It not only integrates out-of-the-box features with major cloud providers and service discovery tools, it also integrates with niche alternatives via either DNS or a file (via an adapter). Of course, the ELK Stack is also open source and therefore vendor independent. It is also is well-integrated.

5. One Dimension Is Not Enough

Some monitoring systems have a hierarchy of metrics: node.1.cpu.seconds. Others provide labels with dimensions: node_cpu_seconds{node_id=1}. The hierarchy forces an operator to choose the structure. You should consider expressing this measurement in a hierarchical system, such as in the following: node_cpu_seconds{node_id=1, env=”staging”}.

More dimensions allow more advanced queries to be made with ease. The answer to the question, “What is the latency of services in staging with the latest version of the app?” boils down to selecting appropriate label values in each dimension. As a side effect, brittleness is reduced with aggregates. A sum over http_request_count{env=”production”} will always yield correct values, regardless of the actual node IDs.

6. Does It Scale?

It’s great if your tool works in a PoC environment without any problems. However, will that tool scale when the demand for your product skyrockets? The system throughput should increase proportionally with the number of resources added. Consider vertical scaling before horizontal. Machines are cheap (compared to person-hours) and available at a Terraform rerun (if you practice infrastructure as code).

Also, don’t think of scale in a Google sense. We love to think big, but it’s more practical to keep things realistic. Complicating the monitoring infrastructure is rarely worth it. You can counter many scaling issues by taking a closer look at the collected metrics. Do you actually need all the unique metrics? Extensive metric cardinality is a simple recipe for spamming even the most performant systems.

7. Recycle and Reuse

There may be valid reasons for running the infrastructure yourself. Maybe none of the databases offered by your provider have the desired business-critical features, for example. However, there should be very few such cases in your system. If you are running applications on-premises, just grab ready-made monitoring plugins and tune them to your needs.

Doing so reduces the need for instrumentation. You will still have to manually fine-tune the visualization and alerting. Adding custom monitoring on top of custom infrastructure is rarely justified by business needs.

8. Knock, Knock

Monitoring without alerts is like a car without gasoline—you’re not going anywhere with it. Indeed, there is some value in the on-the-spot root cause analysis, but you can crunch the same data from the logs. The true value of monitoring is letting the human operator know when their attention is required.

What should alerting look like, then? Ideally, human operators should only be alerted synchronously on actionable, end-user, system-wide symptoms. Being awakened at 3am without a good reason isn’t the most pleasant experience. Beware of the signal-to-noise ratio; the only thing worse than not having monitoring is having monitoring with alerts that people ignore because of a high false-positive rate.

9. Beware of Vendor Lock-in

Although the application monitoring solutions readily available from your cloud provider may look dazzling and effortless to set up, they don’t necessarily allow instrumentation (principle #2). Even if they do, they will be tied to a particular cloud provider.

Beyond crippling your ability to migrate or go multi-cloud should the need arise, vendor lock-in will keep you from being able to assemble your system locally. This can raise your costs (since every little experiment has to be run in the cloud), operational complexity (the need to manage few accounts for development, staging, and production), and iteration cycle time (provisioning cloud resources is usually an order of magnitude slower than provisioning local resources, even accounting for automation).

10. Dig a Well Before You Get Thirsty

You may be tempted to put off creating a proper monitoring system, especially if you’re running a startup. After all, it’s a non-functional requirement and the customers won’t be paying extra for it. However, you want to have that monitoring in place so that you are aware when an outage happens before an enraged customer lets you know. The best time to set up a monitoring system is right now.

You can start off with a simple non-HA setup without any databases and then talk to the business about what to monitor first. As you likely know by now, monitoring is driven by business requirements, even if the business does not always recognize that. Starting early will let you amortize the cost of implementation and gradually build up your monitoring capabilities while you learn from every outage (not if, but when they happen). In the process, you will gain agility and confidence in the knowledge that you’re monitoring the right things.

Summing it up

By trying to apply these ten principles to your own projects, we believe you’ll be able to make the most out of your monitoring and logging. These are not the only ideas out there, of course, and you may find that not all of them apply to your specific workflows or the organization as a whole. There is no true one-size-fits-all solution, and nobody but you knows your business. 

Remember, you can start this process gradually! After all, imperfect monitoring is better than no monitoring at all. 

Easily monitor, troubleshoot, and secure your cloud environment with Logz.io!

Introducing On-Demand Logging with Logz.io Drop Filters

$
0
0

Logs need to be stored. In some cases, for a long period of time. Whether you’re using your own infrastructure or a cloud-based solution, this means that at some stage you’ll be getting a worried email from your CFO or CPO asking you to take a close look at your logging architecture. This, in turn, will push you to limit some data pipelines and maybe even totally shut off others. Maybe we don’t need those debug logs after all, right? 

Wrong. 

Logs, just like any other commodity, change in value. Sure, some logs might not be important 100% of the time. But the last thing you need when troubleshooting an issue in production is that single message holding a critical piece of the puzzle not available. The result of compromising over what data to log, because of costs, is a dent in your system’s observability. 

That’s why we’re happy to announce the availability of a new feature called Drop Filters that allows you to ship all the logs you want in a cost-efficient manner. 

We call this On-Demand Logging.

Ingesting ≠ indexing

As the name implies, Drop Filters allows you to define what logs to “drop”. This means you can decide what specific logs you don’t want to be stored and indexed by Logz.io. 

You can still keep the log shipping pipelines up and running. The logs simply won’t be stored and therefore will not be held against your overall logging quota and you will not be charged for them. 

If you’ve got archiving set up, the logs will continue to be stored on your Amazon S3 bucket and are available to be ingested into Logz.io when necessary, so you’re not compromising on your system’s observability. 

Ship it all but don’t pay for it all!

Granular & dynamic filtering

You can decide exactly what logs to drop using a new page in the UI. Open the page by clicking the cogwheel in the top-right corner of the page and selecting Tools → Drop filter

drop filter

To begin, simply click the + Add drop filter button:

filter add fields

As a first step, you can select to filter a specific log type or choose to filter all your logs. Then, you can select a specific field and corresponding value to filter the selected log type by. 

apache access

That’s all there is to it. Select the confirmation checkbox and hit the Apply the filter button to create the filter: 

apply filter

Logz.io will immediately stop indexing any logs according to the filtering rule you set up. You can toggle this rule on and off as required (i.e. On-Demand Logging) using the control button displayed on the rule or delete it completely. You can create up to 10 drop filters.

Dropping logs with Drop Filters does not change your log shipping pipelines. However, keep in mind that since dropped logs are not stored by Logz.io they cannot be searched or used to trigger alerts.

Log without limits

A lot of pain in the world of log management stems from the ever-increasing amount of operational noise created by logs. This noise poses an analytics challenge — how does one sift through millions of log messages a day — but also a very real cost challenge. Data storage can cost organizations millions a year. 

Logz.io invests a lot of time and resources into helping our users overcome these two challenges. Insights™ was developed to reveal hidden issues hiding within the data and cut troubleshooting time. In addition, a series of cost optimization features, such as Data Optimizer™ and Volume Analysis were developed to help build cost-efficient and optimized data pipelines. Drop Filters complements these features by allowing you to log without limits. 

In the example below, I’m asking Logz.io to drop Apache access logs with a 200 response:

Drop Filters is available in both our Pro and Enterprise plans.

Nginx Web Server Monitoring with the ELK Stack and Logz.io

$
0
0

Nginx is an extremely popular open-source web server serving millions of applications around the world. Second only to Apache, Nginx’s owes its popularity as a web server (it can also serve as a reverse proxy, HTTP cache and load balancer) to the way it efficiently serves static content and overall performance.

From an operational and security perspective, Nginx sits at a critical juncture within an application’s architecture and requires close monitoring at all times. The ELK Stack (Elasticsearch, Logstash, Kibana and Beats) is the world’s most popular open-source log management and log analysis platform, and offers engineers with an extremely easy and effective way of monitoring Nginx. 

In this article, we’ll provide the steps for setting up a pipeline for Nginx logs and beginning the monitoring work. To complete the steps here, you’ll need a running Apache web server and your own ELK Stack or Logz.io account.

Nginx logging basics

Nginx provides users with various lodging options, including logging to file, conditional logging and syslog logging. Nginx will generate two log types that can be used for operational monitoring and troubleshooting: error logs and access logs. Both logs are typically located, by default, under /var/log/nginx but this location might differ from system to system. 

Nginx error logs

Error logs contain diagnostic information that can be used for troubleshooting operational issues. The Nginx error_log directive can be used to specify the log file path and severity and can be used in the main, http, mail, stream, server, location context (in that order).

Example log:


2019/07/30 06:41:46 [emerg ] 12233#12233: directive “http” has no opening “{” in /etc/nginx/nginx.conf:17

This example emerg (the most severe logging level) error log is informing us that a directive is misconfigured.

Nginx access logs

Access logs contain information on all the requests being sent to, and served by, Nginx. As such, they are a valuable resource to use for performance monitoring but also security. The default format for Nginx access logs is the combined format but this may change from distribution to distribution. As with error logs, you can use the access_log directive to set the log file path and log format. 

Example log:

199.203.204.57 - - [30/Jul/2019:06:35:54 +0000] "GET /hello.html HTTP/1.1" 200 63 "-" "Mozilla/5.0 (Macintosh; Intel Mac OS X 10_13_6) AppleWebKit/537.36 (KHTML, like Gecko) Chrome/75.0.3770.142 Safari/537.36"

Shipping to ELK

The simplest way of shipping Nginx logs into the ELK Stack (or Logz.io) is with Filebeat. 

In previous versions of the ELK Stack, Logstash played a critical part in Nginx logging pipelines — processing the logs and geo enhancing them. With the advent of Filebeat modules, this can be done without Logstash, making setting up an Nginx logging pipeline much simpler. The same goes if you’re shipping to Logz.io — parsing is handled automatically. More about this later. 

Installing Filebeat

First, add Elastic’s signing key so that the downloaded package can be verified (skip this step if you’ve already installed packages from Elastic):

wget -qO - https://artifacts.elastic.co/GPG-KEY-elasticsearch | sudo apt-key add -

Next, add the repository definition to your system:

echo "deb https://artifacts.elastic.co/packages/7.x/apt stable main" | sudo tee -a /etc/apt/sources.list.d/elastic-7.x.list

Update and install Filebeat with:

sudo apt-get update && sudo apt-get install filebeat 

Enabling the Nginx Module

Our next step is to enable the Filebeat’s Nginx module. To do this, first enter: 

sudo filebeat modules enable nginx 

Next, use the following setup command to load a recommended index template and deploy sample dashboards for visualizing the data in Kibana:

sudo filebeat setup -e 

And last but not least, start Filebeat with:

sudo service filebeat start 

It’s time to verify our pipeline is working as expected. First, cURL Elasticsearch to verify a “filebeat-*” index has indeed been created:

curl -X GET "localhost:9200/_cat/indices?v"
health status index                uuid                   pri rep docs.count docs.deleted store.size pri.store.size
green  open   .kibana_1            RjVOETuqTHOMTQZ8GiSsEA   1   0        705          153    900.1kb        900.1kb
green  open   .kibana_task_manager L78aE69YQQeZNLgu9q_7eA   1   0          2            0     30.4kb         30.4kb
yellow open   filebeat-7.2.0       xVZdngF6TX-EiRm2e-HuCQ   1   1          5            0     92.9kb         92.9kb


Next, open Kibana at: http://localhsot:5601 — the index will be defined and loaded automatically and the data visible on the Discover page:

Discover

Shipping to Logz.io

As mentioned above, since Logz.io automatically parses Nginx logs, there’s no need to use Logstash or Filebeat’s Nginx module. All we have to do is make some minor tweaks to the Filebeat configuration file. 

Downloading the SSL certificate

For secure shipping to Logz.io, we’ll start with downloading the public SSL certificate:

wget https://raw.githubusercontent.com/logzio/public-certificates/master/COMODORSADomainValidationSecureServerCA.crt && sudo mkdir -p /etc/pki/tls/certs && sudo mv COMODORSADomainValidationSecureServerCA.crt /etc/pki/tls/certs/

Editing Filebeat 

Next, let’s open the Filebeat configuration file:

sudo vim /etc/filebeat/filebeat.yml 

Paste the following configuration:

filebeat.inputs: - type: log paths: - /var/log/nginx/access.log fields: logzio_codec: plain token: type: nginx_access fields_under_root: true encoding: utf-8 ignore_older: 3h - type: log paths: - /var/log/nginx/error.log fields: logzio_codec: plain token: type: nginx_error fields_under_root: true encoding: utf-8 ignore_older: 3h #For version 6.x and lower uncomment the line below and remove the line after it #filebeat.registry_file: /var/lib/filebeat/registry filebeat.registry.path: /var/lib/filebeat #The following processors are to ensure compatibility with version 7 processors: - rename: fields: - from: 'agent' to: 'beat_agent' ignore_missing: true - rename: fields: - from: 'log.file.path' to: 'source' ignore_missing: true output.logstash: hosts: ['listener.logz.io:5015'] ssl: certificate_authorities: ['/etc/pki/tls/certs/COMODORSADomainValidationSecureServerCA.crt']

A few things about this configuration are worth pointing out:

  • The configuration defines two file inputs, one for the Nginx access log and the other for the error log. If you need to change the path to these files, do so now.
  • Be sure to enter your Logz.io account token in the relevant placeholders. You can find this token in the Logz.io UI.
  • The processors defined here are used to comply with the new ECS (Elastic Common Scheme) and are required for consistent and easier analysis/visualization across different data sources.
  • The output section defines the Logz.io listener as the destination for the logs. Be sure to comment out the Elasticsearch destination.

Save the file and restart Filebeat with:

sudo service filebeat restart 

Within a minute or two, you will begin to see your Nginx logs in Logz.io:

15 hits

Analyzing Nginx logs

Kibana is a pretty powerful analysis tool that provides users with rich querying options to slice and dice data. The auto-suggest and auto-complete features added in recent versions turn the experience of sifting through the logs much simpler and easier.

Let’s take a look at some examples.

The simplest search method, of course, is free text. Just enter a search query in the search field as follows:

sydney

sydney

Field-level searches allow us to be a bit more specific. For example, we can search for any Nginx access log with an error code using this search query:

type : "nginx_access" and response > 400

query

There are plenty of other querying options to choose from. You can search for specific fields, use logical statements, or perform proximity searches — Kibana’s search options are extremely varied and are covered more extensively in this Kibana tutorial.

Visualizing Nginx logs

Things get more interesting when we start to visualize Nginx logs in Kibana. Kibana is infamous for its beautiful dashboards and visualizations that help users depict their data in many different ways. I’ll provide four simple examples of how one can visualize Nginx logs using different Kibana visualizations.

Request map

For Nginx access logs, and any other type of logs recording traffic for that matter, the usual place to start is a geographic map of the different locations submitting requests. This helps us monitor regular behavior and identify suspicious traffic. Logz.io will automatically geo enrich the IP fields within the Nginx access logs so you can use a Kibana Coordinate Map visualization to map the requests as shown below:

map

If you’re using your own ELK Stack and shipped the logs using Filebeat’s Nginx module, the fields will also be geo enriched.

Responses over time

Another common visualization used for Nginx access logs monitors response codes over time. Again, this give us you a good picture of normal behavior and can help us detect a sudden spike in error response codes. You can use Bar Chart, Line Chart or Area Chart visualizations for this:

response over time

Notice the use of the Count aggregation for the Y-Axis, and the use of a Date Histogram aggregation and Terms sub aggregation got the X-Axis.

Top requests

Data table visualizations are a great way of breaking up your logs into ordered lists, sorted in the way you want them to be using aggregations. In the example here, we’re taking a look at the requests most commonly sent to our Nginx web server:

requests

Errors over time

Remember — we’re also shipping Nginx error logs. We can use another Bar Chart visualization to give us a simple indication for the number of errors reported by our web server:

errors over time

Note, I’m using a search filter for type:nginx_error to make sure the visualization is showing only depicting the number of Nginx errors.

These were just some examples of what can be done with Kibana but the sky’s the limit. Once you have your visualizations lined up, add them up into one comprehensive dashboard that provides you with a nice operational overview of your web server. 

dashboard

Endnotes

Logz.io users can install the dashboard above, and many other Nginx visualizations and dashboards, using ELK Apps — a free library of pre-made dashboards for various log types, including Nginx of course. If you don’t want to build your own dashboard from scratch, simply search for “nginx” in ELK Apps and install whichever dashboard you fancy.

To stay on top of errors and other performance-related issues, a more proactive approach requires alerting, a functionality which is not available in vanilla ELK deployments. Logz.io provides a powerful alerting mechanism that will enable you to stay on top of live events, as they take place in real-time. Learn more about this here. 

Monitor, troubleshoot, and secure your environment with one unified platform.

Enhancing Support for Zeek (Bro) in Logz.io Security Analytics

$
0
0

We’re happy to announce official support for Zeek in Logz.io Security Analytics for easier security monitoring!

Logz.io Security Analytics provides a unified platform for security and operations designed for cloud and DevOps environments. It’s built on top of Logz.io’s enterprise-grade ELK Stack and is extremely easy to set up and integrate with. Advanced security features include preconfigured rules and threat intelligence that together help organizations identify and mitigate threats more efficiently.

Zeek, formerly known as Bro, is an open-source network analysis tool used for security monitoring. When deployed, Zeek generates an extensive set of log files that contain in-depth information on a network’s activity that can be used to identify signs of suspicious activity such as port scanning or brute force logins. 

Zeek has come a long way since Bro was first introduced in 2005.  It has now become an extremely popular tool for security monitoring and we are now offering enhanced support for Zeek in Logz.io Security Analytics, including easy integration, new correlation rules, and a built-in monitoring dashboard.

Get started in mins

Installing Zeek can be a time-consuming task in and of itself without needing to spend additional time and resources on setting up a logging pipeline. Integrating with Logz.io is simple and can be done by installing Filebeat on the edge hosts in your environment. 

Filebeat is an ELK-native log forwarder with an extremely small footprint and is easy to configure. In just a few steps, you’ll be able to establish a pipeline of logs from Zeek into Logz.io.  

New correlation rules

Zeek logs contain a wealth of information on potentially malicious activity. To get notified in real-time when Zeek identifies suspicious behavior, we’ve added some Zeek-specific rules that will trigger alerts when the conditions defined in these rules are met.

For example, an alert will be triggered when Zeek identifies a vulnerability scan by a user for exploitable RDP services.  As the rule explains, unauthenticated RDP connections can be used to perform remote code execution and are therefore very dangerous. 

security demo

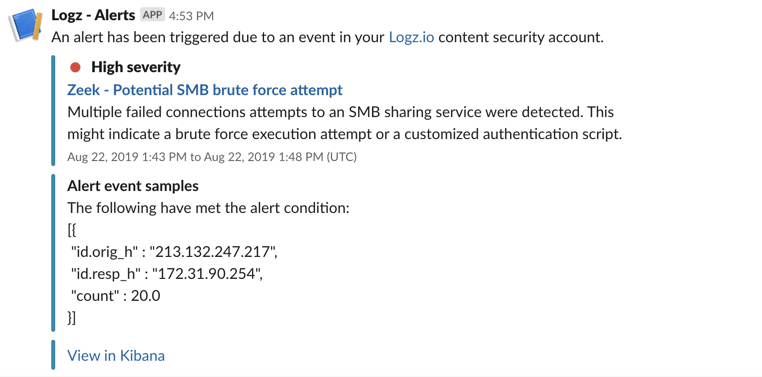
Another example is the rule identifying a potential SMB brute force attempt. Using Zeek logs, Logz.io will alert you on failed attempted connections to a shared service in your network. 

high severity

As seen in these examples, Logz.io sending out these alerts via Slack but you can, of course, configure the rule to send an alert to any endpoint of your choice. 

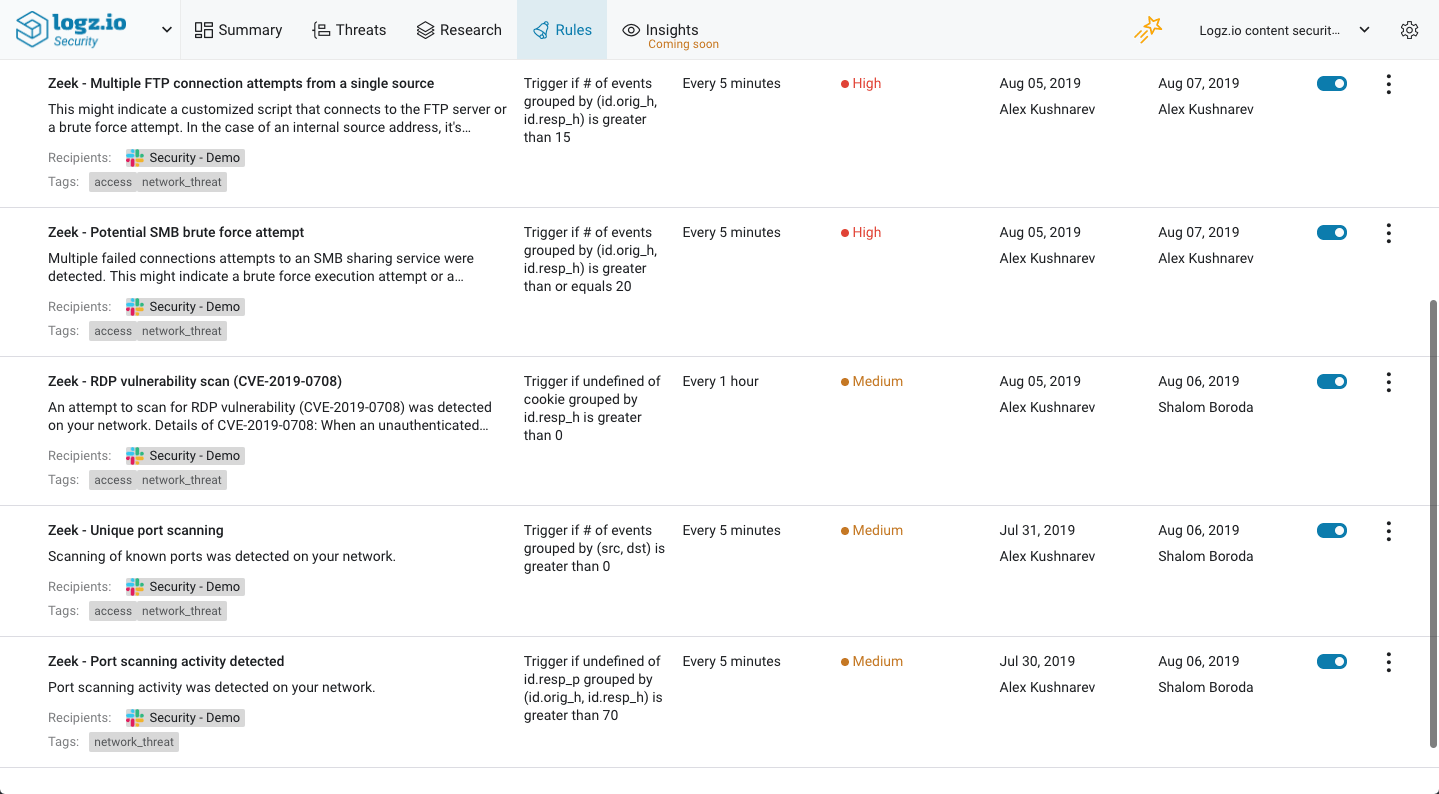
This initial batch of Zeek rules includes:

  • Potential SMB brute force attempt
  • Port scanning activity detected
  • RDP vulnerability scan (CVE-2019-0708)
  • Multiple failed SSH authentication attempts
  • Multiple FTP connection attempts from a single source
  • Unique port scanning

All these rules can be found together on the Rules page in Logz.io Security Analytics. 

rules

New Zeek dashboard

Based on Kibana,  Logz.io Security Analytics enables you to visualize your security data in any way you like. To help you hit the ground running and to help you begin your monitoring as fast as possible, we provide canned Kibana dashboards for various security and compliance environments and scenarios. Zeek users can now use one such dashboard to monitor their network for security events!

dashboard

The dashboard provides the following information:

  • Alerts over time – a line chart showing the total amount of correlation rules being activated over time, both those triggering an alert and those suppressed.
  • Malicious IPs – a table showing a list of malicious IPs, based on automatic correlations with public feeds such as alienvault reputation and blocklist.de. 
  • Malicious IPs origins – a map showing the geographical origin of malicious IPs.
  • RDP users by IP chart/RDP users per IP – two visualizations displaying information on RDP users. 
  • Port scanning activity – a line chart showing port scanning activity identified over time.
  • Rule triggering history – a line chart showing correlation rules triggered and not triggered.
  • All logs – a saved search showing all Zeek logs being shipped to Logz.io.

To use this dashboard, simply go to the Dashboard page under the Research tab and look for ‘zeek’.

Endnotes

This is the first version of our support for Zeek, and it complements our existing integrations with other security monitoring tools such as OSSEC, GuardDuty, FortiGate, and Wazuh. Down the road, we plan on adding new integrations and enhancing support for existing integrations. 

As usual, we’d love to hear about specific integrations and support you would like us to develop. Feel free to send us feedback and questions to: info@logz.io

Enjoy!

Identify and mitigate threats with one unified platform for operations and security.

A Basic Guide To Elasticsearch Aggregations

$
0
0

Elasticsearch Aggregations provide you with the ability to group and perform calculations and statistics (such as sums and averages) on your data by using a simple search query. An aggregation can be viewed as a working unit that builds analytical information across a set of documents. Using aggregations, you can extract the data you want by running the GET method in Kibana UI’s Dev Tools. You can also use CURL or APIs in your code. These will query Elasticsearch and return the aggregated result.

Here are two examples of how you might use aggregations:

  1. You’re running an online clothing business and want to know the average total price of all the products in your catalog. The Average Aggregation will calculate this number for you.
  2. You want to check how many products you have within the “up to $100” price range and the “$100 to $200” price range. In this case, you can use the Range Aggregation.

This article will describe the different types of aggregations and how to run them. It will also provide a few practical examples of aggregations, illustrating how useful they can be.

Getting Started

In order to start using aggregations, you should have a working setup of ELK. If you don’t, step-by-step ELK installation instructions can be found at this link.

You will also need some data/schema in your Elasticsearch index. You can use any data, including data uploaded from the log file using Kibana UI. In this article, we are using sample eCommerce order data and sample web logs provided by Kibana.  

To get this sample data, visit your Kibana homepage and click on “Load a data set and a Kibana dashboard.” There, you will see the sample data provided for eCommerce orders and web logs. This process is shown in Screenshots A and B below.


add data

Screenshot A


data Kibana

Screenshot B

The Aggregation Syntax

It is important to be familiar with the basic building blocks used to define an aggregation. The following syntax will help you to understand how it works:

-----
"aggs”: {
    “name_of_aggregation”: {
      “type_of_aggregation”: {
        “field”: “document_field_name”
}
-----

aggs—This keyword shows that you are using an aggregation.

name_of_aggregation—This is the name of aggregation which the user defines.

type_of_aggregation—This is the type of aggregation being used.

field—This is the field keyword.

document_field_name—This is the column name of the document being targeted.

A Quick Example 

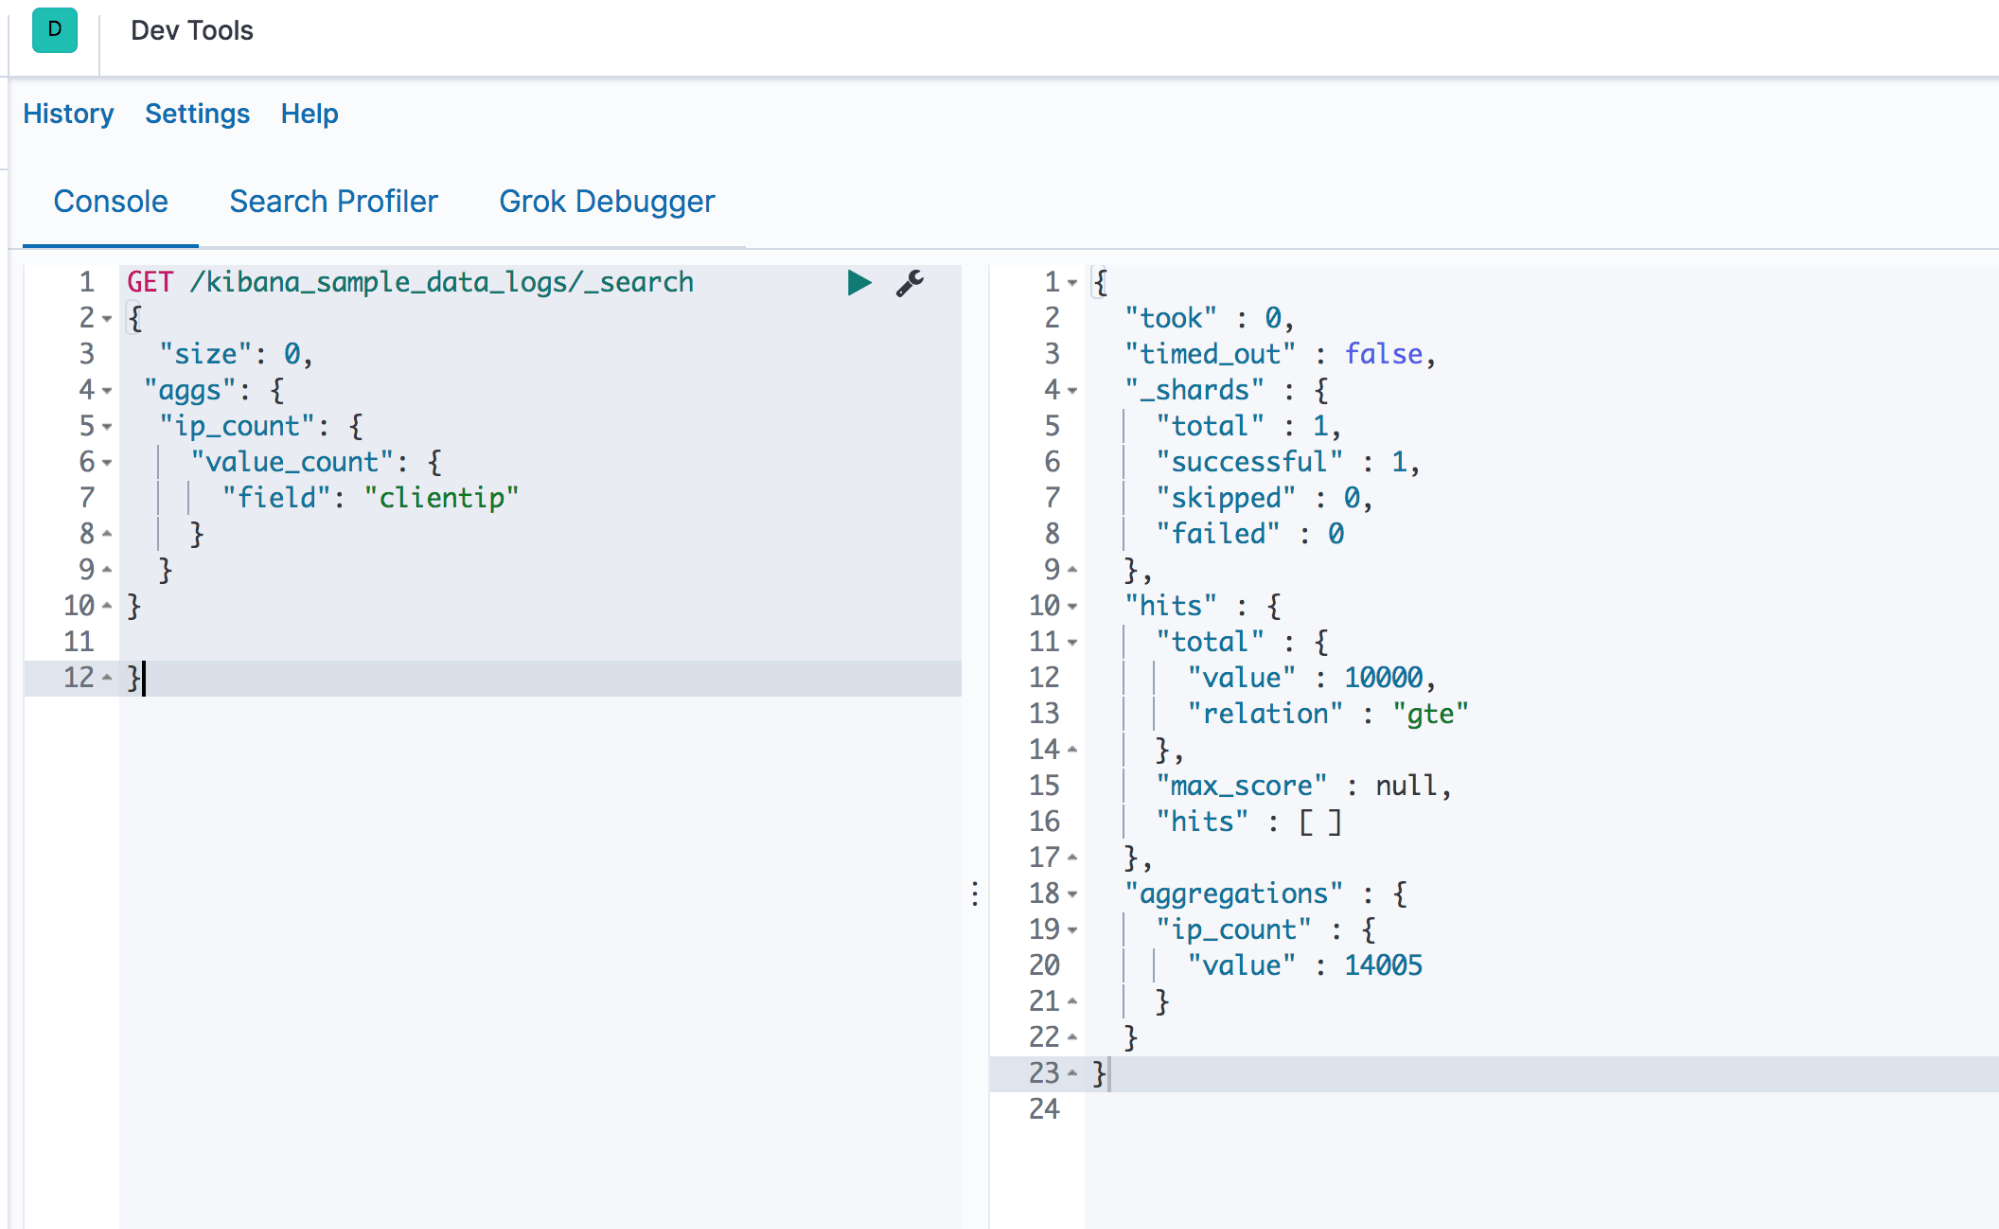
The following example shows the total counts of the “clientip address in the index “kibana_sample_data_logs.”

The code written below is executed in the Dev Tools of Kibana. The resulting output is shown in Screenshot C.

GET /kibana_sample_data_logs/_search
{ "size": 0, 
 "aggs": {
  "ip_count": {
    "value_count": {
      "field": "clientip" 
                    }
               }
          }
}

Output

output

Screenshot C

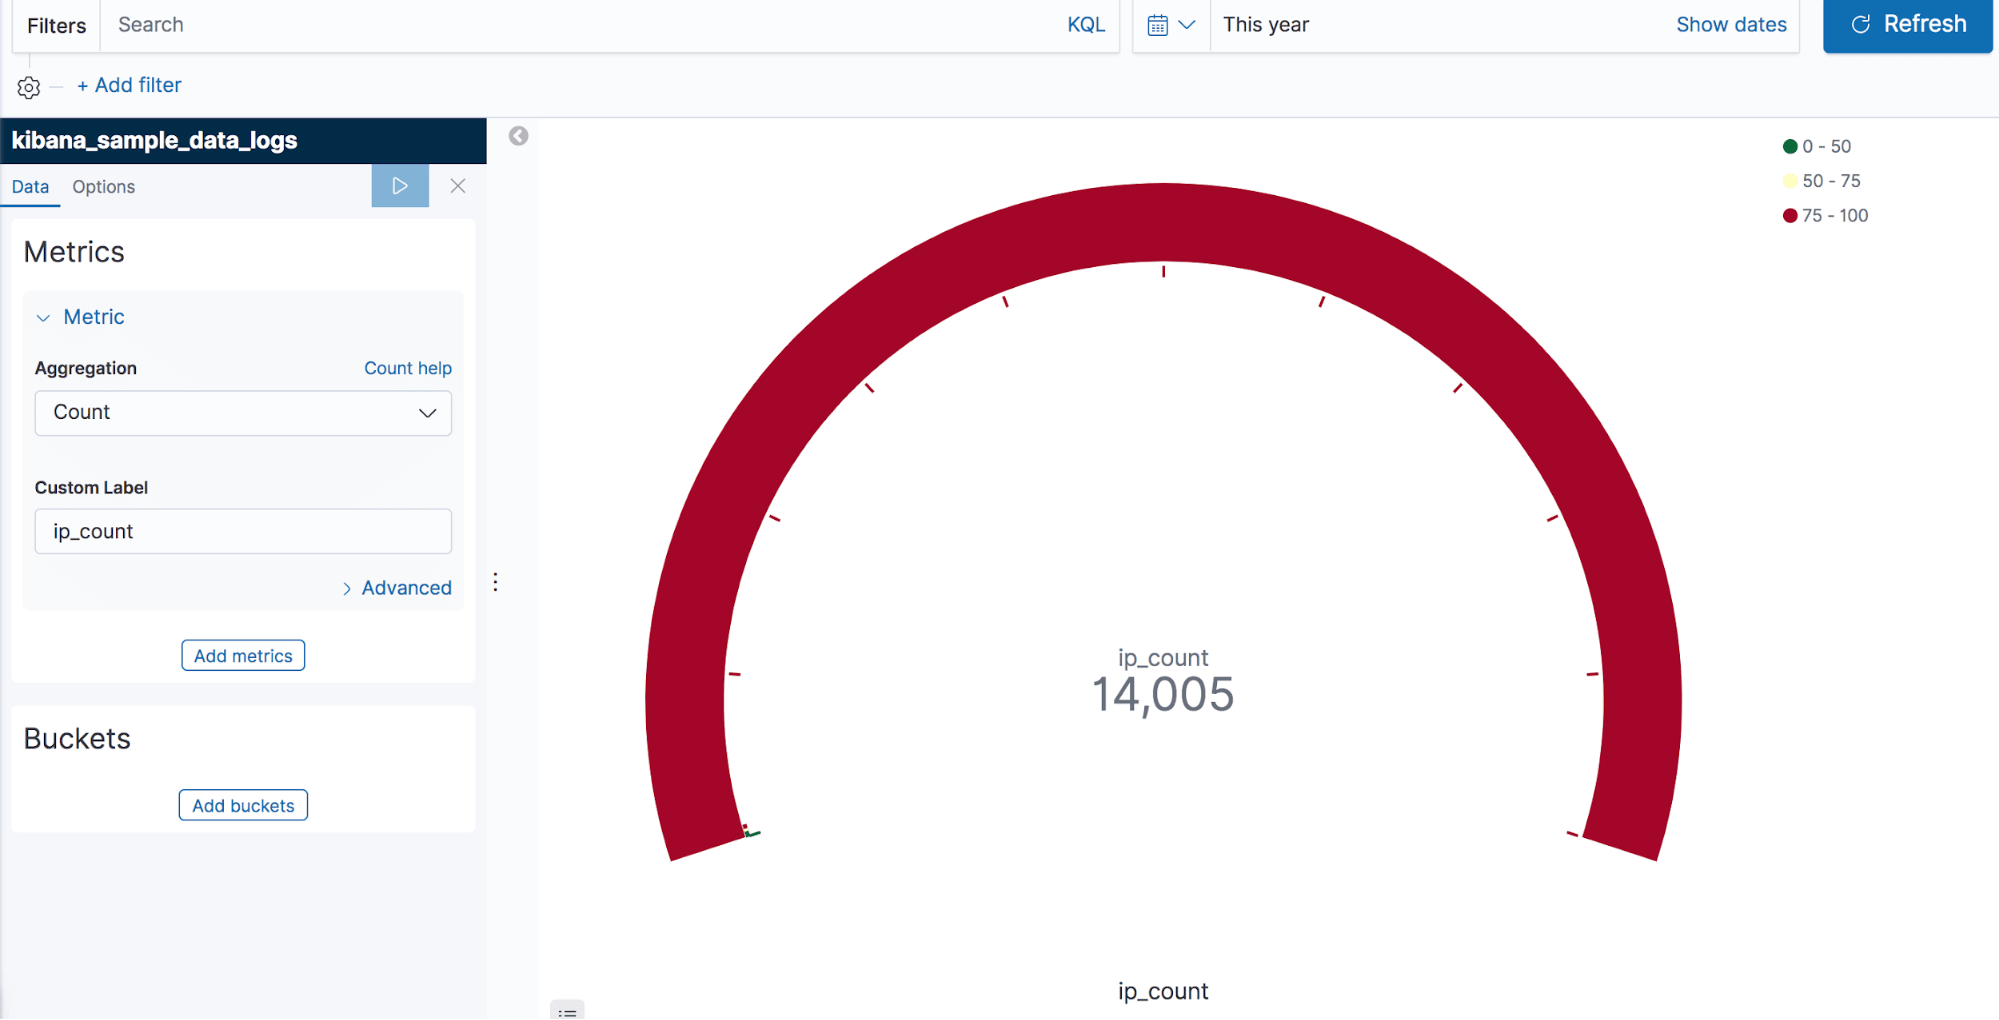
You can also use the Kibana UI to get the same results as shown in Screenshot C. Here, we created a gauge visualization by clicking on the “Visualize” tab of Kibana with the index “kibana_sample_data_logs.” Then, we simply selected the count aggregation from the left-hand pane. Finally, we clicked on the “execute” button. 

In Screenshot D, you can see the resulting ip_count value in the gauge visualization. 

red

Screenshot D

Key Aggregation Types

Aggregations can be divided into four groups: bucket aggregations, metric aggregations, matrix aggregations, and pipeline aggregations. 

  • Bucket aggregations—Bucket aggregations are a method of grouping documents. They can be used for grouping or creating data buckets. Buckets can be made on the basis of an existing field, customized filters, ranges, etc.
  • Metric aggregations—This aggregation helps in calculating matrices from the fields of aggregated document values.
  • Pipeline aggregations—As the name suggests, this aggregation takes input from the output results of other aggregations.
  • Matrix aggregations (still in the development phase)—These aggregations work on more than one field and provide statistical results based on the documents utilized by the used fields.

All of the above aggregations (most especially bucket, metric, and pipeline aggregations) can be further classified. This next section will focus on some of the most important aggregations and provide examples of each.

Five Important Aggregations

Five of the most important aggregations in Elasticsearch are:

  1. Cardinality aggregation
  2. Stats aggregation
  3. Filter aggregation
  4. Terms aggregation
  5. Nested aggregation

Cardinality aggregation

Needing to find the number of unique values for a particular field is a common requirement. The cardinality aggregation can be used to determine the number of unique elements. 

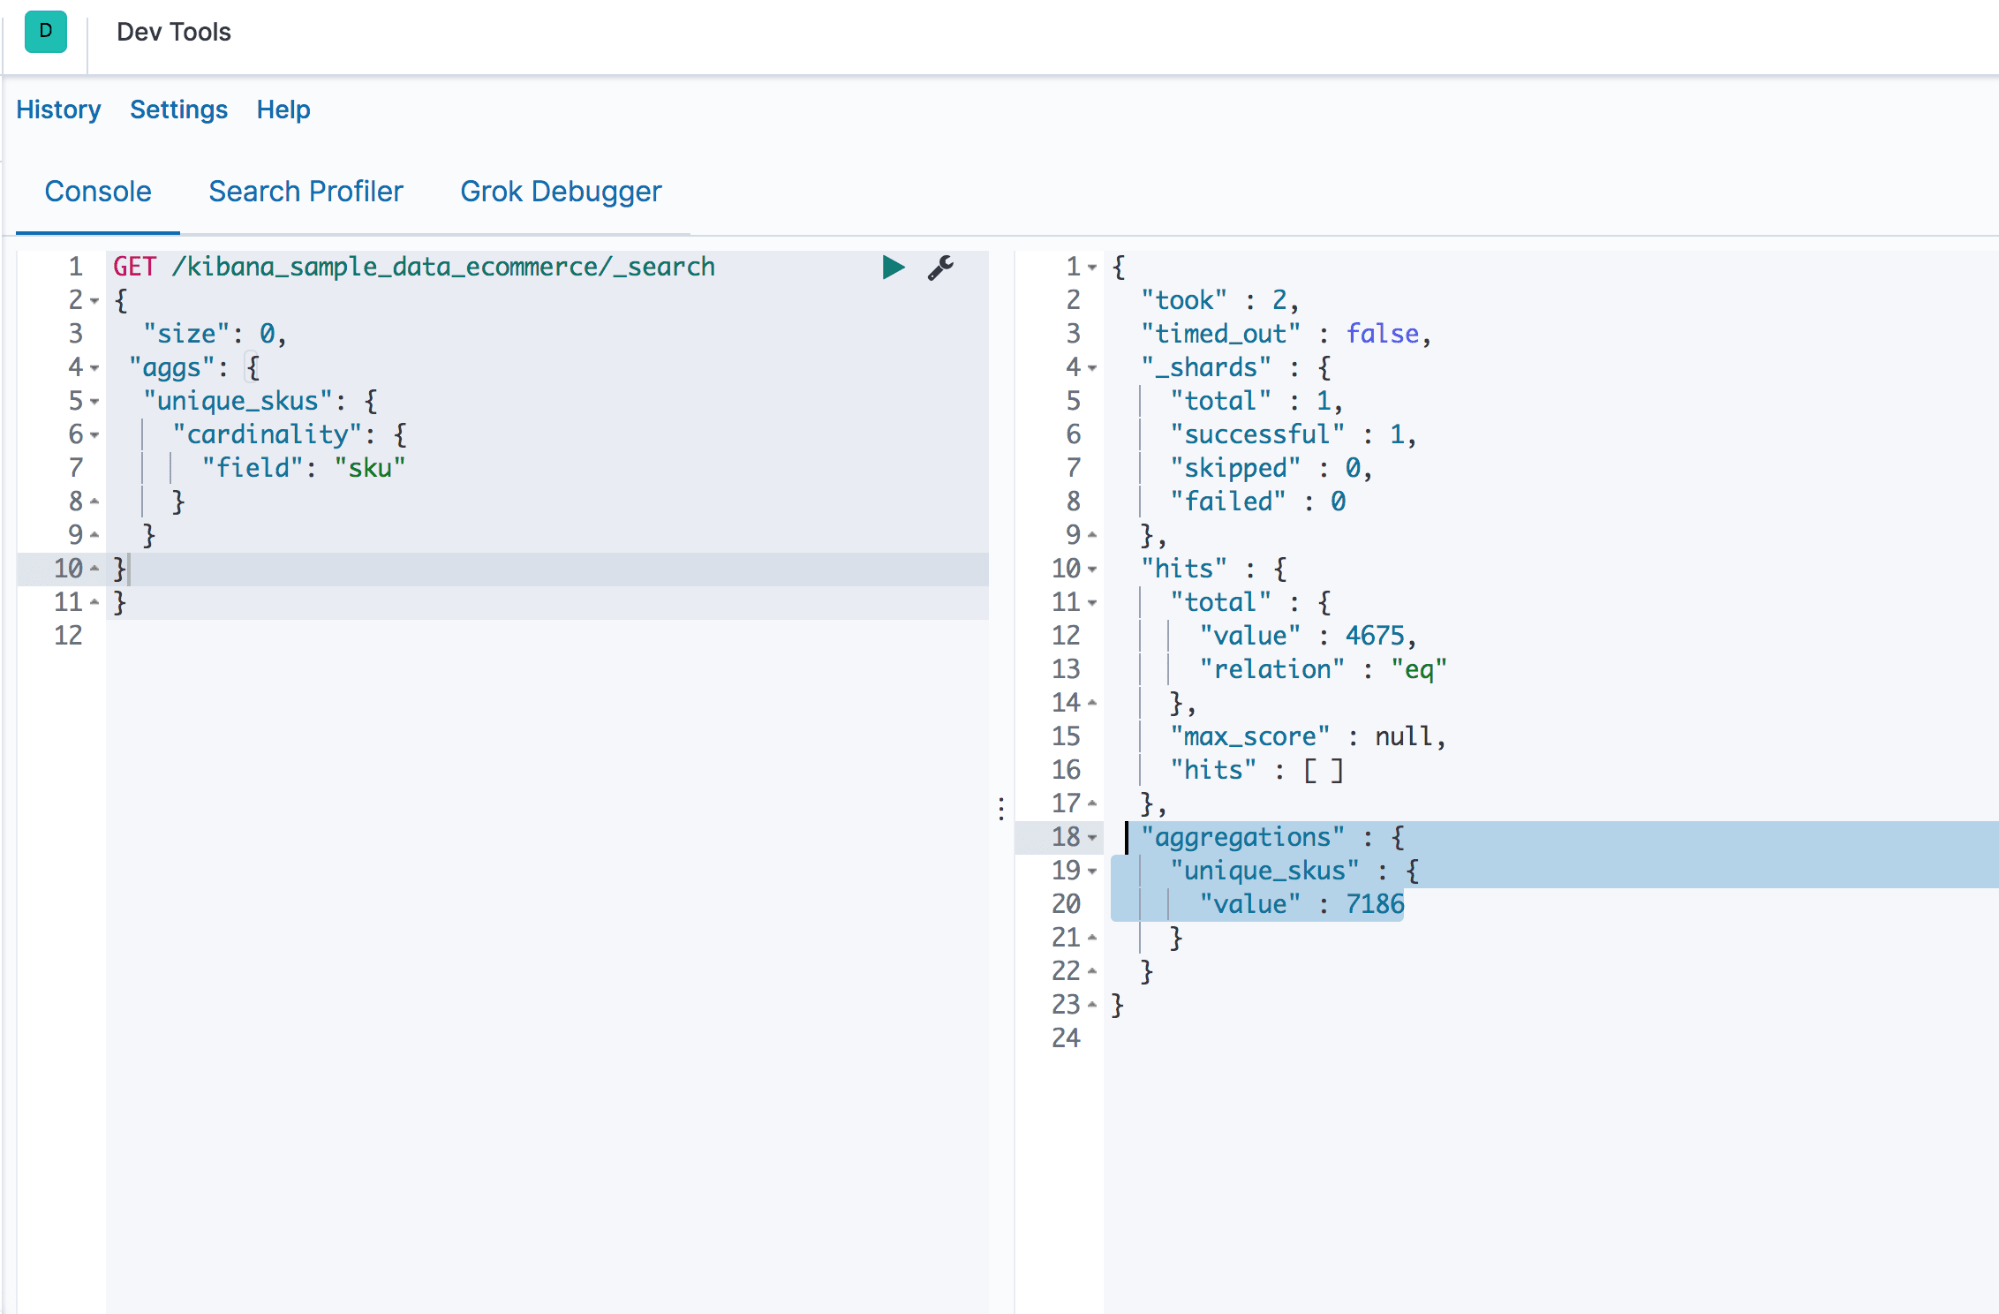
Let’s see how many unique sku’s can be found in our e-commerce data. 

GET /kibana_sample_data_ecommerce/_search
{
  "size": 0, 
 "aggs": {
  "unique_skus": {
    "cardinality": {
      "field": "sku"
    }
  }
}
}

The cardinality aggregation response for the above code is shown in Screenshot E.

Output


aggregations

Screenshot E

You can see the same result in Kibana UI as well. We have used a Goal Chart here, which you can see in Screenshot F.


Screenshot F

Screenshot F

Stats Aggregation

Statistics derived from your data are often needed when your aggregated document is large. The statistics aggregation allows you to get a min, max, sum, avg, and count of data in a single go. The statistics aggregation structure is similar to that of the other aggregations.

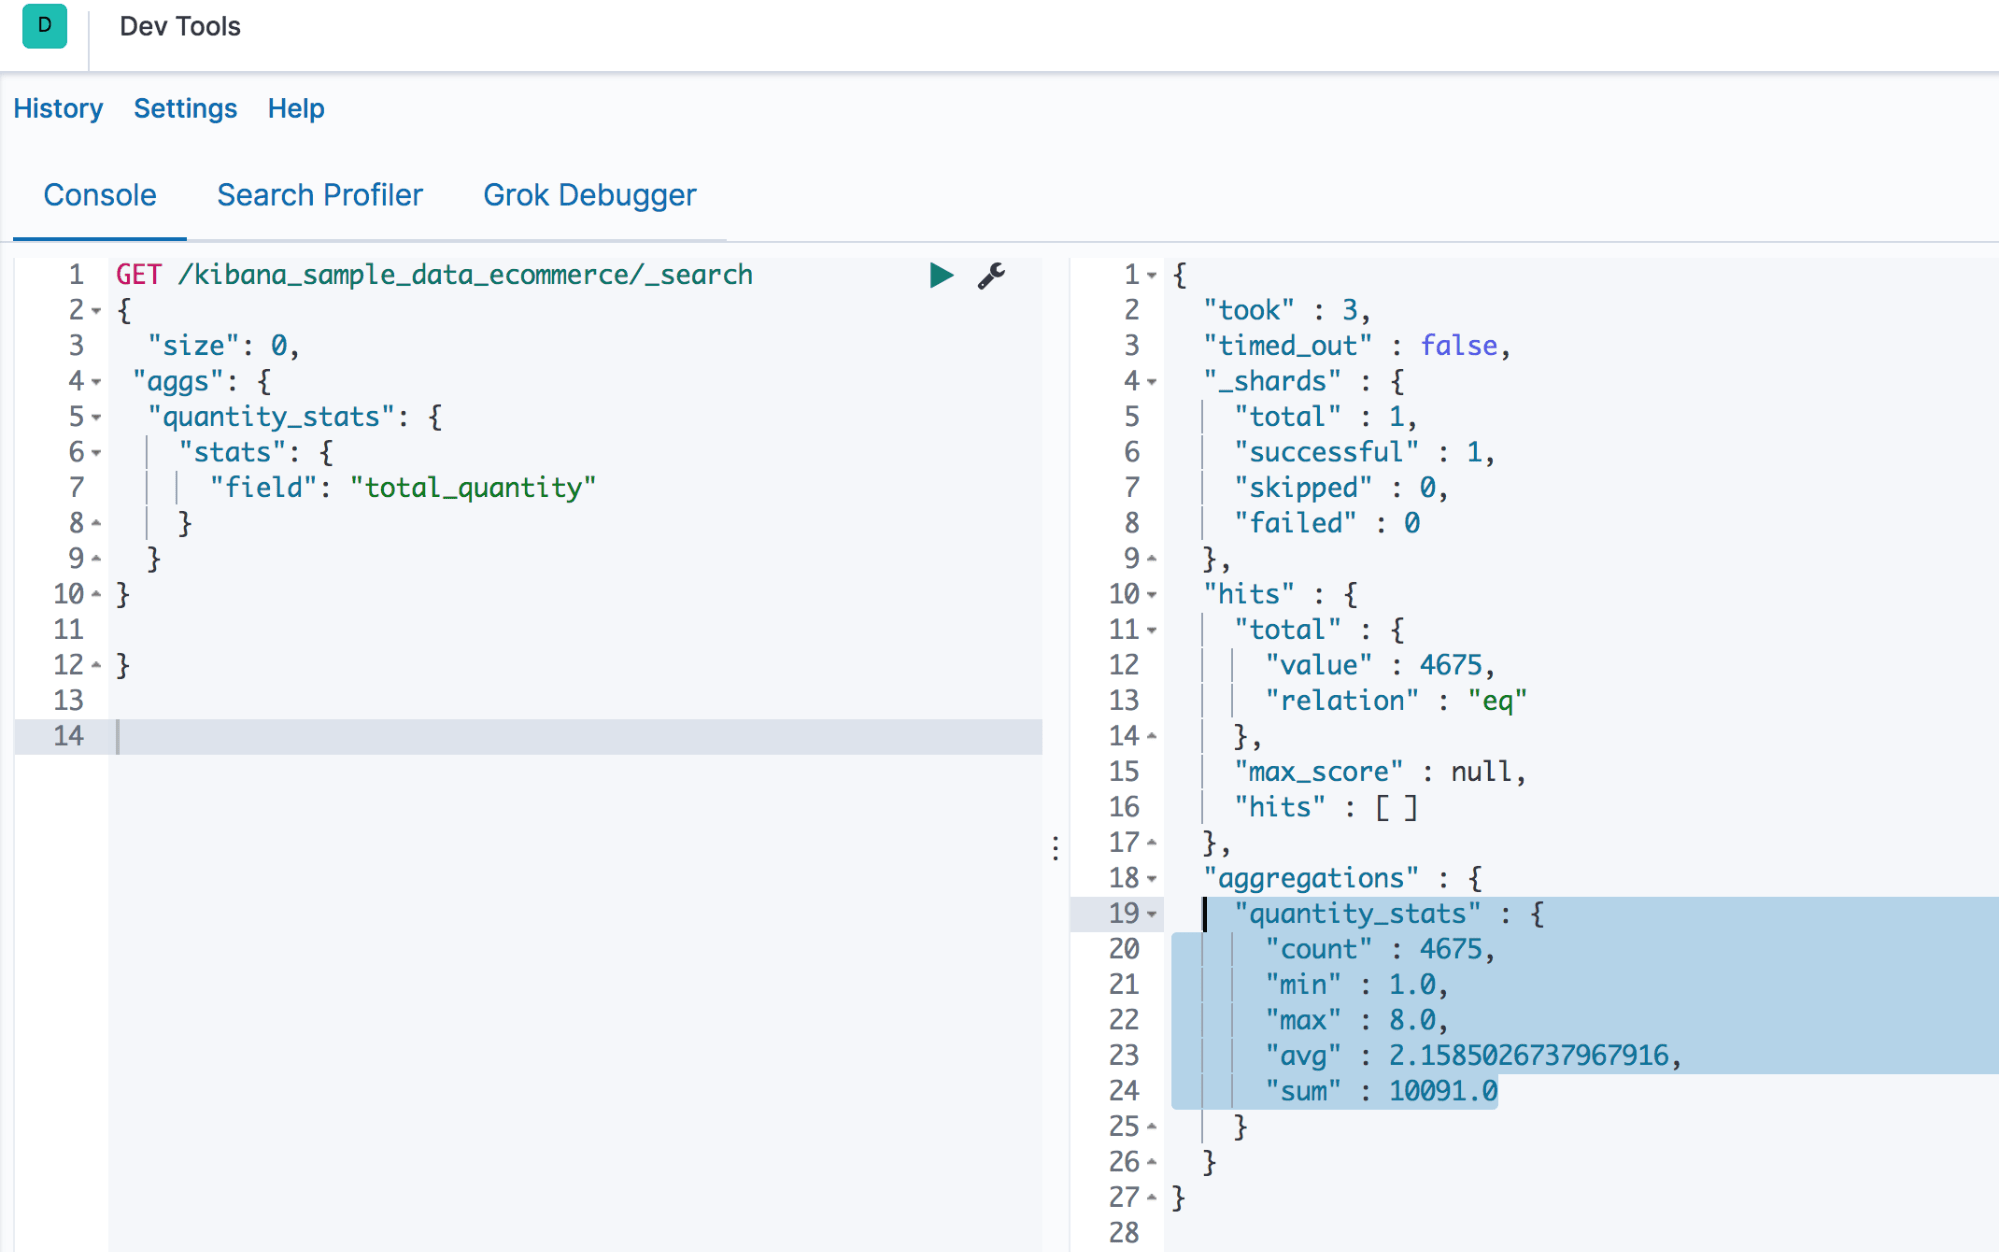
Let’s check the stats of field “total_quantity” in our data.

GET /kibana_sample_data_ecommerce/_search
{
  "size": 0, 
 "aggs": {
  "unique_skus": {
    "cardinality": {
      "field": "sku"
    }
  }
}
}

Output

Screenshot G shows the stats for the quantity field—min, max, avg, sum, and count values.


Screenshot g

Screenshot G

You can get the same statistical results from Kibana UI, as shown in Screenshot H.


h

Screenshot H

Filter Aggregation

As its name suggests, the filter aggregation helps you filter documents into a single bucket. Within that bucket, you can calculate metrics.

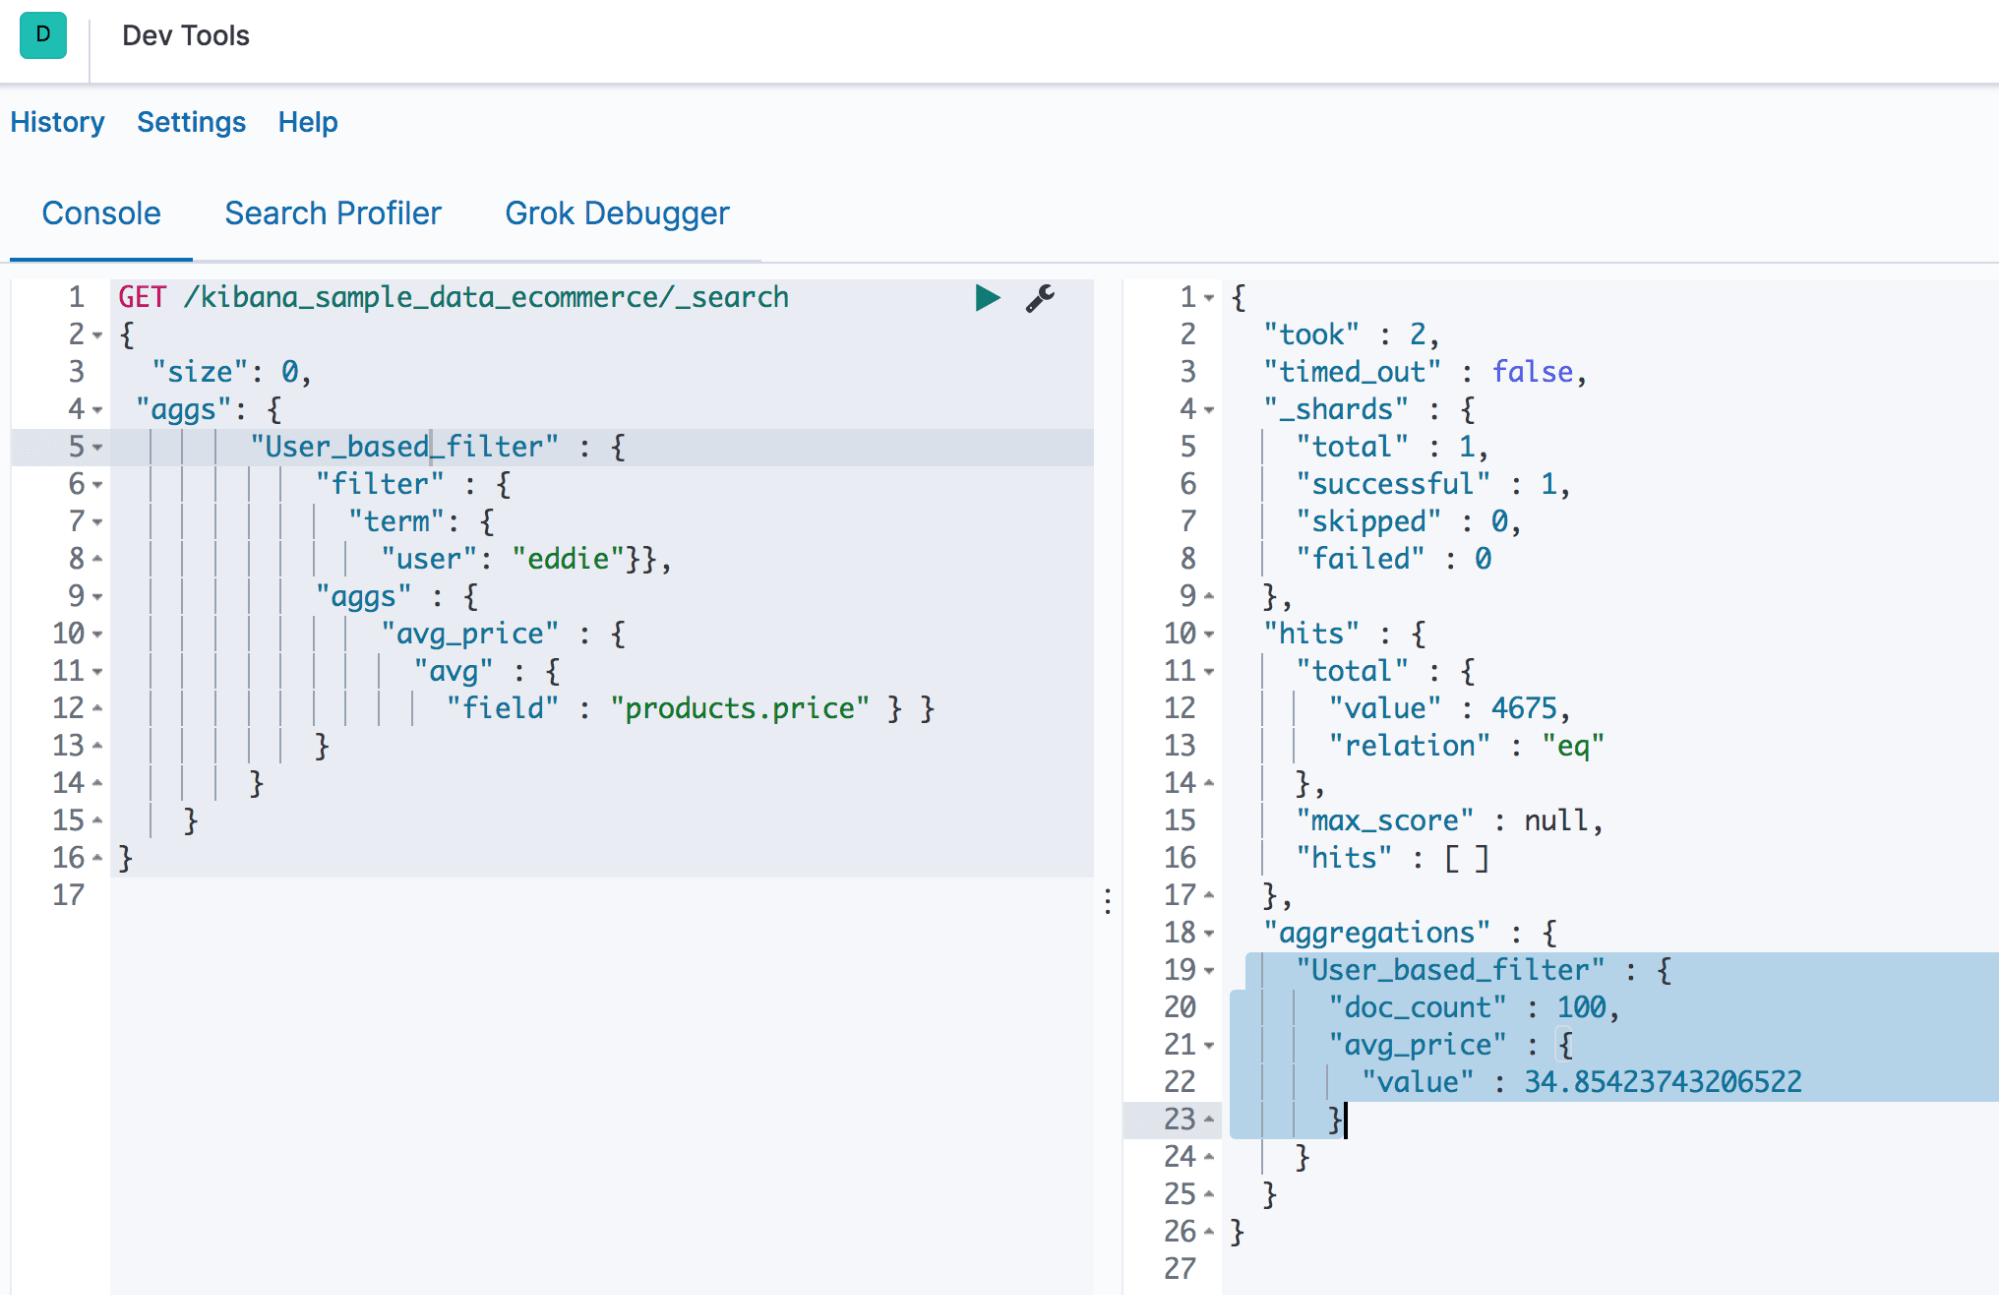
In the example below, we are filtering the documents based on the username “eddie” and calculating the average price of the products he purchased. See Screenshot I for the final output.

GET /kibana_sample_data_ecommerce/_search
{ "size": 0, 
 "aggs": {
        "User_based_filter" : {
            "filter" : { 
              "term": { 
                "user": "eddie"}},
            "aggs" : {
                "avg_price" : { 
                  "avg" : { 
                    "field" : "products.price" } }
            }}}}

Output


screenshot I

Screenshot I

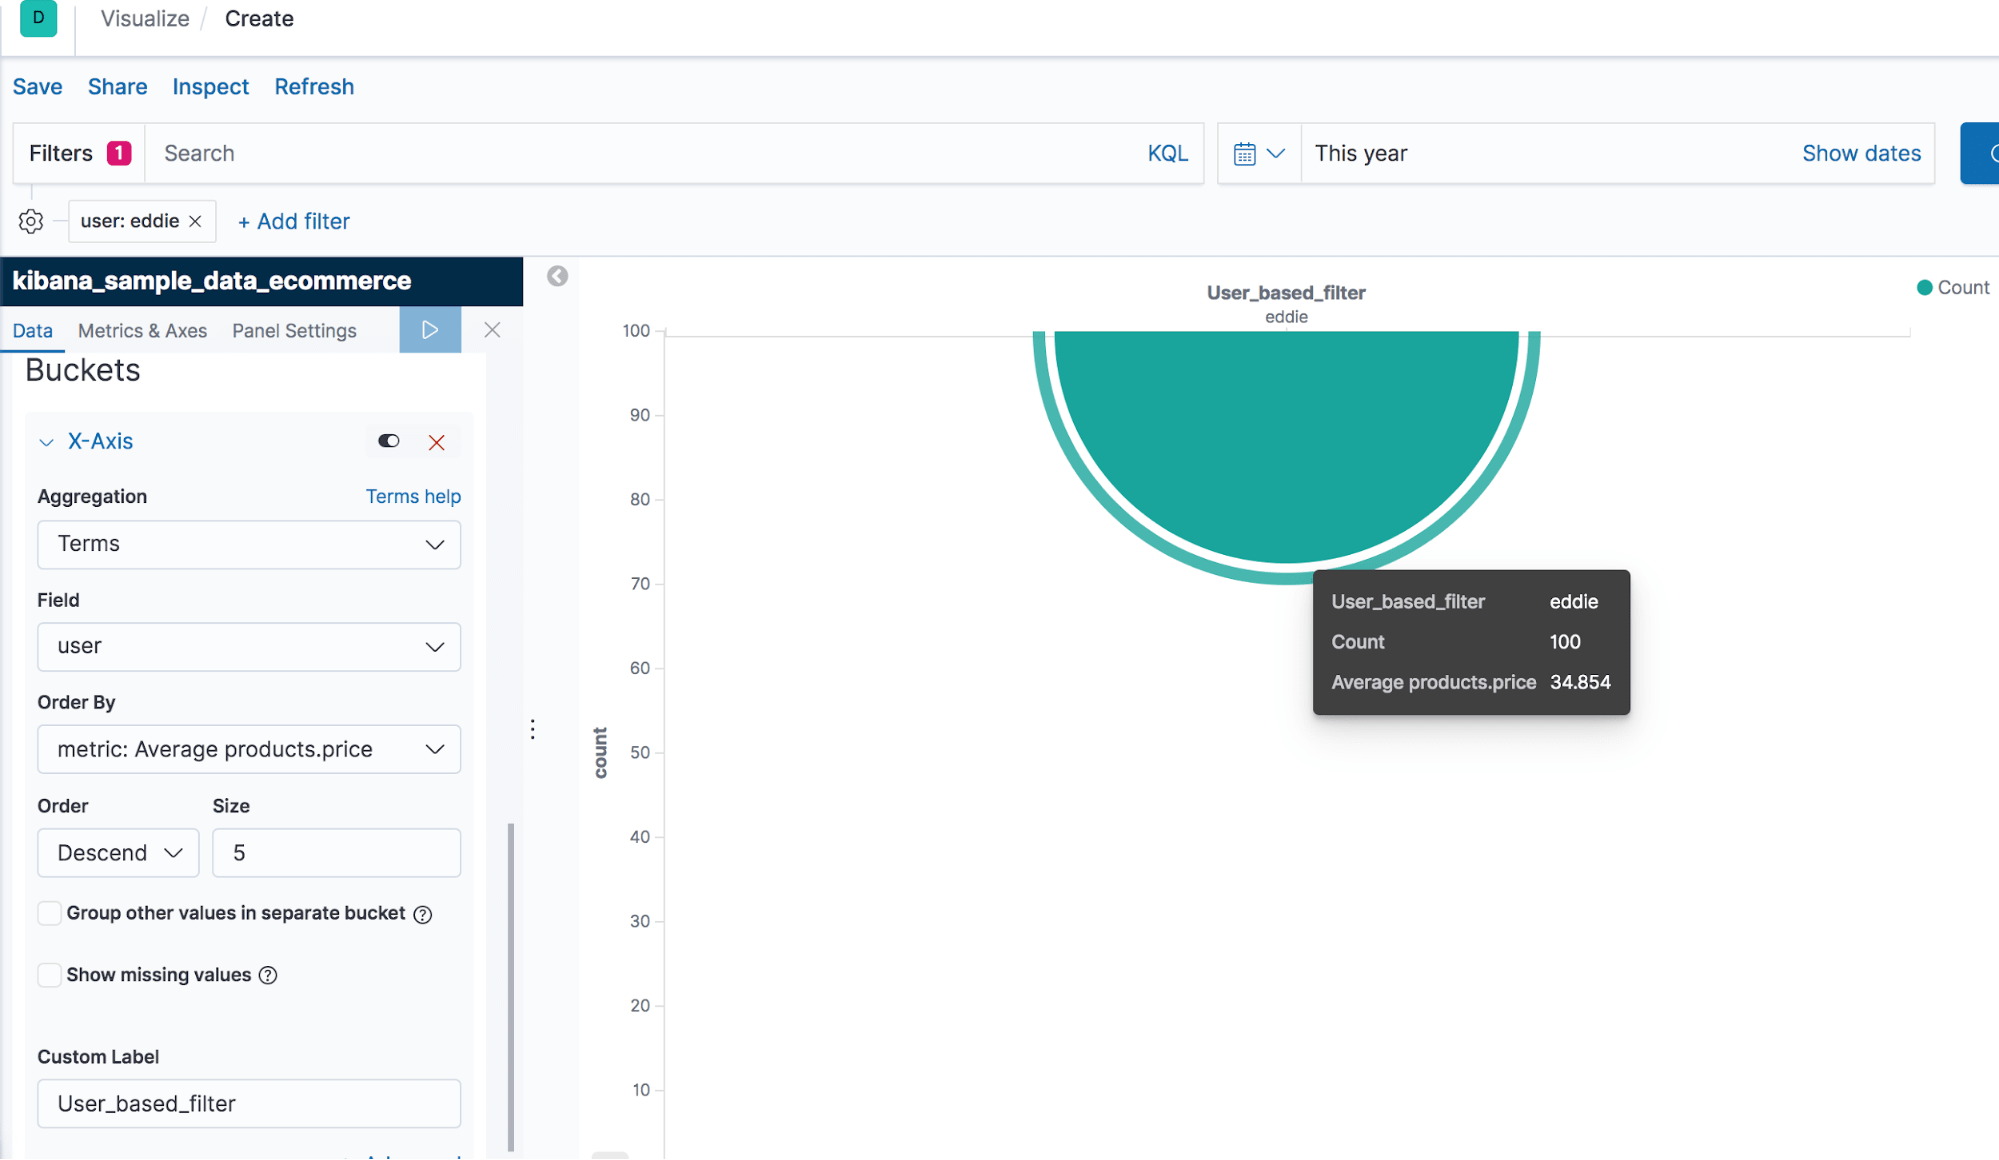
Kibana UI Output

We have used the Line Chart to visualize the filter aggregation. To implement the filter aggregation, we first had to establish the filter “eddie” (see the top left corner in Screenshot J).


screenshot j

Screenshot J

Terms Aggregation

The terms aggregation generates buckets by field values. Once you select a field, it will generate buckets for each of the values and place all of the records separately.

In our example, we have run the terms aggregation on the field “user” which holds the name of users. In return, we have buckets for each user, each with their document counts. See Screenshots K and L.

GET /kibana_sample_data_ecommerce/_search
{ "size": 0, 
 "aggs": {
        "User_based_filter" : {
            "filter" : { 
              "term": { 
                "user": "eddie"}},
            "aggs" : {
                "avg_price" : { 
                  "avg" : { 
                    "field" : "products.price" } }
            }}}}

Output

screenshot K

Screenshot K

Kibana UI Output

i

Screenshot I

Kibana UI Output

We have used the Line Chart to visualize the filter aggregation. To implement the filter aggregation, we first had to establish the filter “eddie” (see the top left corner in Screenshot J). 

Screenshot J

Screenshot J

Terms Aggregation

The terms aggregation generates buckets by field values. Once you select a field, it will generate buckets for each of the values and place all of the records separately.

In our example, we have run the terms aggregation on the field “user” which holds the name of users. In return, we have buckets for each user, each with their document counts. See Screenshots K and L.

GET /kibana_sample_data_ecommerce/_search
{
  "size": 0, 
 "aggs": {
        "Terms_Aggregation" : {
              "terms": { 
                "field": "user"}}
            }
        }

Output

Screenshot K

Screenshot K

Kibana UI Output

Screenshot I

Screenshot L

Nested Aggregation

This is the one of the most important types of bucket aggregations. A nested aggregation allows you to aggregate a field with nested documents—a field that has multiple sub-fields.

The field type must be “‘nested’” in the index mapping if you are intending to apply a nested aggregation to it. 

The sample ecommerce data which we have used up until this point hasn’t had a field with the type “nested.” We have created a new index with the field “Employee” which has its field type as “nested.” 

Run the code below in DevTools to create a new index “nested_aggregation” and set the mapping as “nested” for the field “Employee.”

PUT nested_aggregation
{
  "mappings": {
    "properties": {
      "Employee": {
        "type": "nested",
      "properties" : {
       "first" : { "type" : "text" },
       "last" : { "type" : "text" },
      "salary" : { "type" : "double" }
    }}}
}}

Execute the code below in DevTools to insert some sample data into the index you have just created.

PUT nested_aggregation/_doc/1
{
  "group" : "Logz",
  "Employee" : [
    {
      "first" : "Ana",
      "last" :  "Roy",
      "salary" : "70000" 
    },
    {
      "first" : "Jospeh",
      "last" :  "Lein",
      "salary" : "64000" 
    },
     {
      "first" : "Chris",
      "last" :  "Gayle",
      "salary" : "82000" 
    },
    {
      "first" : "Brendon",
      "last" :  "Maculum",
      "salary" : "58000" 
    },
    {
      "first" : "Vinod",
      "last" :  "Kambli",
      "salary" : "63000" 
    },
     {
      "first" : "DJ",
      "last" :  "Bravo",
      "salary" : "71000" 
    },
    {
      "first" : "Jaques",
      "last" :  "Kallis",
      "salary" : "75000" 
    }]}

Now the sample data is in our index “nested_aggregation.” Execute the following code to see how a nested aggregation works:

GET /nested_aggregation/_search
{
  "aggs": {
    "Nested_Aggregation" : {
              "nested": {
                "path": "Employee"
              }, 
    "aggs": {
      "Min_Salary": {
        "min": {
          "field": "Employee.salary"
        }
      }
    }
}}}

Output


Screenshot M

Screenshot M

As you can see in Screenshot M, we have successfully called the sub-fields/nested fields of the main field “Employee.”

Note: There is no option to visualize the result of nested aggregation on Kibana UI.

Summary

This article has detailed a number of techniques for taking advantage of aggregations. There are other versions of aggregations which you might find useful as well. Some of these include:

  • Date histogram aggregation—used with date values.
  • Scripted aggregation—used with scripts.
  • Top hits aggregation—used with top matching documents.
  • Range aggregation—used with a set of range values.

As a next step, consider immersing yourself in these aggregations to find out how they might help you meet your needs. You can also visit Elastic’s official page on Aggregations.

Looking for a scalable and fully managed ELK solution?

Introducing Scheduled Reporting

$
0
0

We’re happy to announce the release of Logz.io Reports — an easy way to set up scheduled reporting for both operational and security use cases.

Kibana dashboards provide you with a window into your environment, visualizing the different signals being tracked in a beautiful mix of graphs, charts, and maps. Often used in times of crisis and as the starting point for an investigation, dashboards can also be useful as a static reporting tool for multiple use cases.

You might need to send a daily system health report to your manager or other key stakeholders in the organization. Or, you might be required to save a weekly report on security events for compliance and auditing.  

There are various ways to share or export dashboards with other team members, the simplest being using share URLs or the Snapshots feature we developed on top of Kibana. You can even use the Snapshots API to set up a script that automates the process. 

But this is not the type of user-friendly experience we want to provide our users with. A much simpler approach is required. And that’s where Logz.io Reports come into the picture.

End-to-end reporting automation

Simply put, Logz.io Reports allow you to automatically generate a report — in essence a snapshot of a Kibana dashboard — on a regular schedule and covering a time range of your choice.

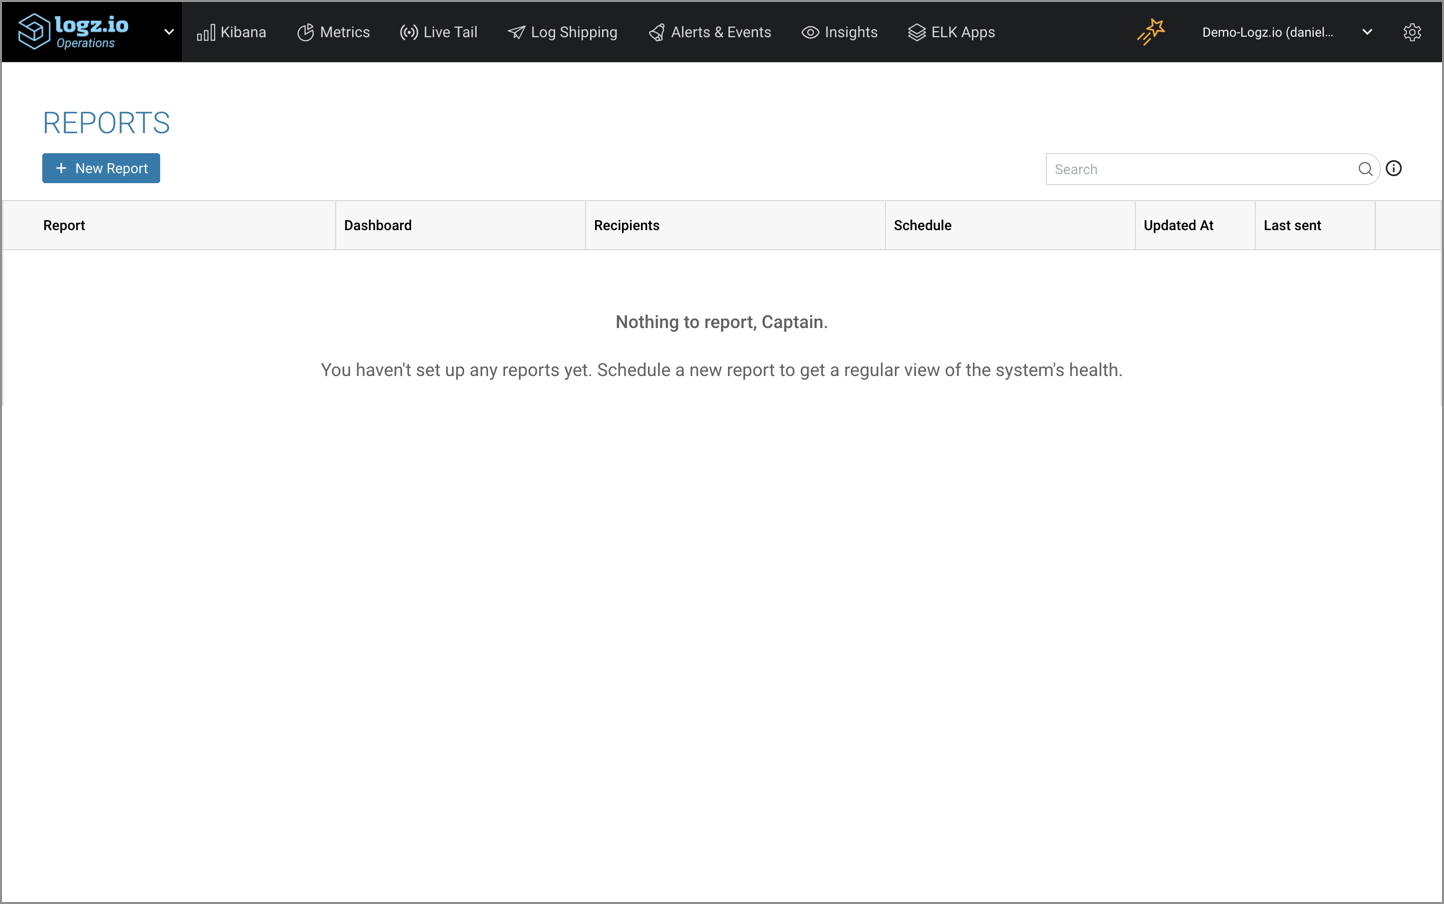
Reports can be managed and created from the new Reports page located under Alerts & Events (Logz.io Security Analytics users will see the page appear as a separate tab in the top menu).  

no report

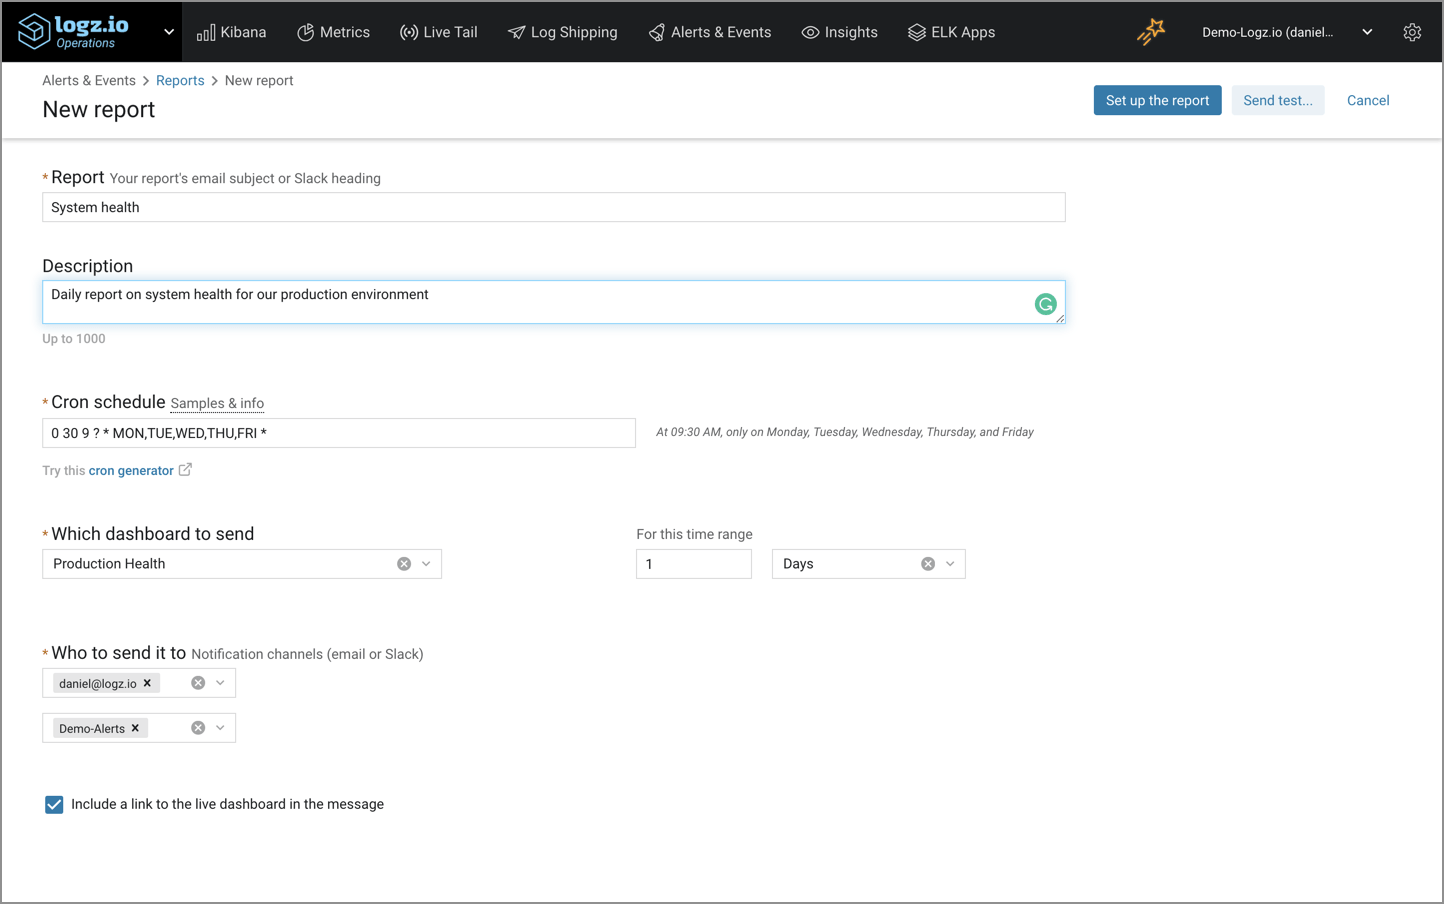
Hitting the + New Report button, you’re presented with the New report page where you can totally customize what report to send, when to send it and to whom.

new report

Start by giving your report a name (depending on how you decide to distribute the report, this name will appear as an email subject or Slack notification heading) and a description. 

Next, set up a cron schedule for generating the report. If you’re not an expert at cron scheduling, no worries — use the provided examples and link to an online tool. You’ll quickly get the hang of it. 

You then need to decide what Kibana dashboard to send as the basic of your report, from what time frame and who to send it to. As mentioned before, Reports support email or Slack endpoints at this stage.

In the example below, we’re sending a “Production Health” dashboard at 9:00 AM every weekday via email and Slack:

system help

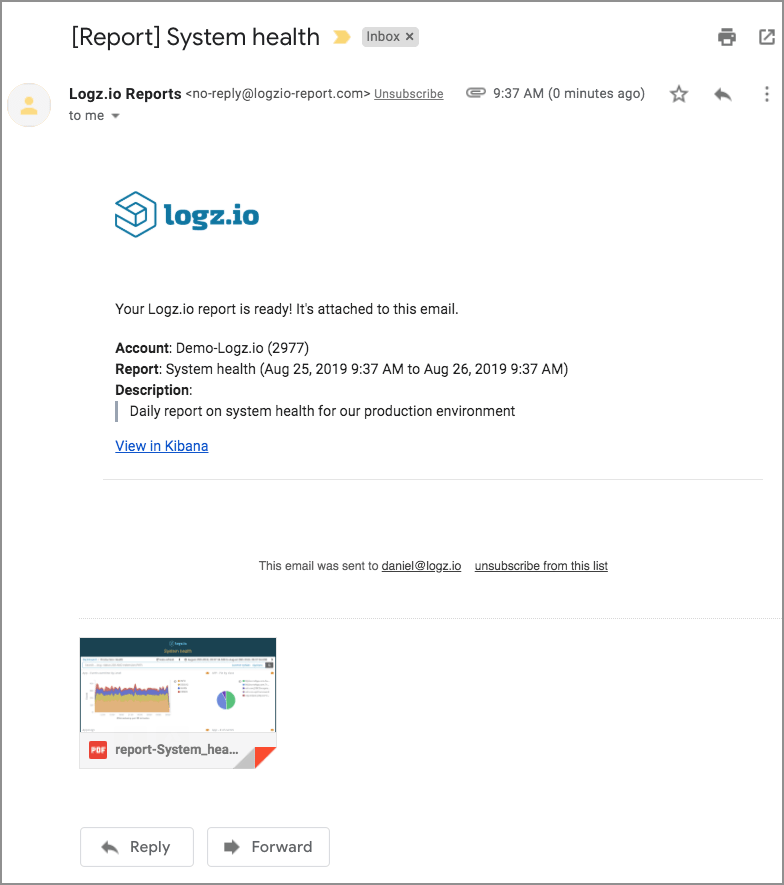
If you’re not sure if this is the report you want to send, you can give it a dry run! Click Send test… in the top-right corner of the page, select an endpoint to send the test report to, and within a minute or two you’ll receive a sample report. 

report system health

As seen above, the report itself consists of some metadata information such as the Logz.io account sending the report and its description and of course the dashboard itself in PDF format.

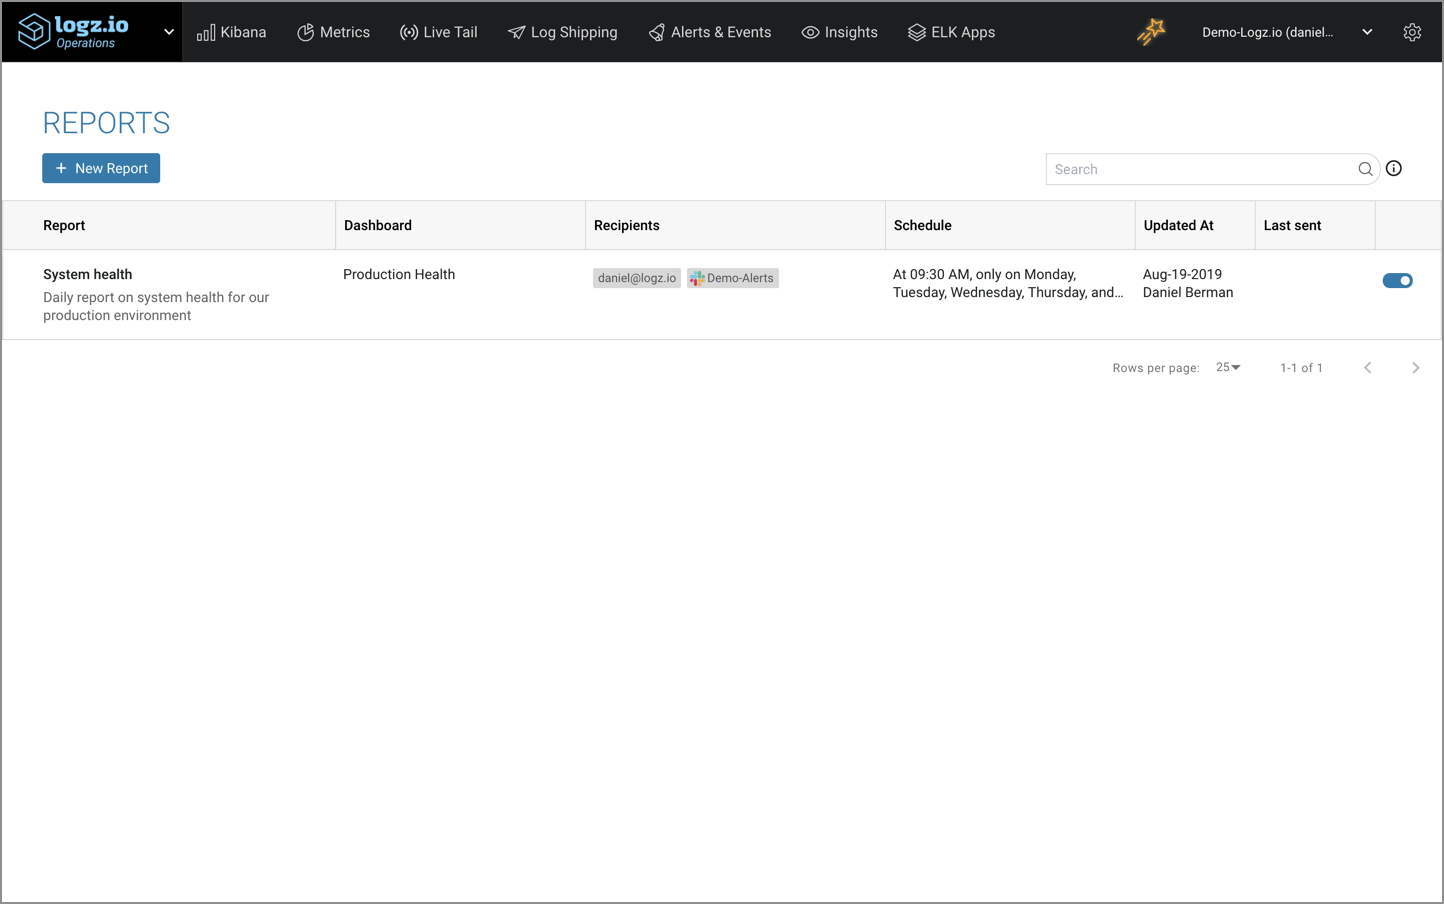
If satisfied, you’re ready to create the report. To do this, simply hit Set up the report. The report is created and added to the list on the Reports page.

reports page

Managing your reports

Need to tweak a report? Turn reporting off for another? Maybe you’d like to totally remove a report from the list? 

managing reports

All of these actions are available on the Reports page, making managing your reports an extremely easy task.  

Endnotes

To sum it up, Logz.io Reports provides you with an easy way to automate the generation and sending of Kibana dashboards as reports, helping you ensure the right people are receiving the right information at the right time. 

Reports are available in all our plans, the only limit being a max of 50 active reports per account. 

As with any new feature, we’d love to get your input. If you have any feedback whatsoever, feel free to let us know at: info@logz.io.  

Happy reporting!

Take collaboration to the next level by sharing dashboards and visualizations with your team. Learn how!

Creating the Perfect Grafana Dashboard

$
0
0

For a lot of DevOps engineers and SREs, a Grafana dashboard is often the beginning of a troubleshooting procedure. It might be an alert in Slack or a colleague pointing out anomalous system behavior.  Or maybe it’s just part of your day-to-day monitoring workflow. Whatever the reason, staring at a beautiful Grafana dashboard is the starting point of what can be either a long and excruciating process, or a short and efficient one.

Grafana is a fantastic visualization tool for monitoring time-series data and is renowned for its rich and beautiful dashboards. But as beautiful as these dashboards might be, building them can be a challenge, especially for newbies. One might even call it art. More importantly, how well you build your dashboard can directly affect how long it takes you to identify an issue and come to an actionable conclusion. 

Below are some guidelines for both strategizing how to visualize your data in Grafana and constructing the panels and dashboards themselves.

Grafana dashboarding basics

A Grafana dashboard is basically a single view that contains multiple panels (for Kibana users, panels are visualizations) laid out on a grid. Each of the individual panels can be configured to show data from a different data source, allowing you to visualize data from multiple sources within the same dashboard. 

The data visualized within a panel is defined using a query editor which is tied to the specific data source used. The look and feel of a panel, and the way your data is displayed in it, is fully customizable, and you can rearrange the panels within a dashboard according to your preferences. 

Understand your data

A lot of effort is put into building monitoring pipelines. And rightly so. High availability and performance are super important requirements in any monitoring system. But what about the time-series data flowing through these pipelines? Do you know what metrics you are monitoring and how you plan on using them in Grafana?

This might seem like an obvious rule-of-thumb, but the more you know your metrics the easier it will be to visualize and analyze them in Grafana. If it’s custom metrics, you have control. If it’s a system reporting these metrics, most likely there are some specs or docs somewhere detailing the various data available.

Once you gain a better understanding of the different constructs comprising your dataset you’ll have a clearer picture of how you want to use them, or in other words — how you want to visualize your data in Grafana. This will help you answer two key questions: 1) what panel to use in Grafana, and 2) what metrics to use within the panel. Which leads us nicely to the next tip. 

Keep it simple

It’s easy to get carried away when building a new panel in Grafana. You might add another aggregation of another metric or you might start alternating between panel types to see the difference. Before you know it, you’ve forgotten the answer to the question posed in the previous point — what exactly are you trying to monitor?

So, try to keep things as simple as possible. 

Ideally, maintain a low metric per panel ratio. If you find yourself looking at a panel visualizing three or more metrics, something has most likely gone wrong along the way and the chances of you interpreting this panel when push comes to shove are slim. The same goes for the number of panels per dashboard. Less is sometimes more, and you probably have better things to do with your time than scrolling down an endless dashboard.

Start small, scale slow

What if you can’t keep it simple? What if you find yourself staring at six different panels visualizing the exact same metric? This can easily happen, especially when monitoring distributed systems, and runs the risk of obfuscating visibility. 

If anything else, focus on designing your dashboard around the four golden signals of latency, traffic, errors, and saturation. Yes, each of these signals can quickly explode into multiple panels or even dashboards. I’ve seen dashboards consisting of 12 panels dedicated to each of these signals. What if you had a dashboard with four rows, each consisting of two panels per signal? Remember, you can always scale to more panels if required.     

Focus on readability 

When creating a Grafana dashboard, try and think of the teammate across the table. If you take a look at a dashboard or panel you just finished building and can’t understand the story it’s telling, it’s time to go back to the drawing board. But even if you can understand, will your colleague? If you can’t look at a dashboard as a team and infer what’s going right or wrong in the system being monitored, this defeats the purpose of building the dashboard to start with.   

There are some simple principles that will help your colleagues interpret your dashboard. Give your panels an understandable name, use proper labeling, set the correct minimum and maximum values in your X and Y axes, use annotations and tooltips to add context to graphs, link to documentation — Grafana has all the functionality needed to make your dashboards readable and usable. 

Use variables (aka templating)

Unless you’re using Grafana to monitor a single machine or a single Kubernetes cluster, you’ll most likely find Grafana’s variables feature (formerly known as templating) extremely useful. 

Instead of building a dashboard for each server/service/cluster/device you’re monitoring, the variables feature allows you to build one dashboard and then seamlessly switch between monitored objects using dropdown menus. 

In more technical terms, variables are simply a placeholder for a value. There are different variable types that you can use, but one of the most commonly used types is the query variable which queries a data source and returns a list of metric names or keys (e.g. device1, device2, device3).

Leverage the power of community

There’s no need to reinvent the wheel. We might like to think of ourselves as being unique but there’s a huge chance that another engineer out there has deployed the exact same monitoring stack. What if you didn’t need to build your own Grafana dashboard on your own and could use this engineer’s expertise?

Grafana has a huge community contributing to an endless list of dashboards (and plugins) that can be easily installed and used. This is one of the main reasons why Grafana is so popular to start with. Simply search for the dashboard you’re trying to build and install one of the available, official, and community dashboards. And if you’re in a sharing mood, why not contribute one of your dashboards? 

Endnotes

Grafana is truly an amazing visualization tool and can easily be considered best-in-class. Sure, Kibana has done some impressive catching up over the past couple of years with the introduction of Timelion and then Visual Builder, but Grafana still takes the lead if only because of its support for multiple data sources.

While there are some key differences between these two impressive open-source visualization tools, they do share some best practices when it comes to the process of dashboarding. Dashboards are a crucial element in monitoring. They can be of huge help to the engineers using them but can also potentially become an obstacle. 

Summing it up — less is more, keep your dashboards as readable and simple as possible. Again, it’s easy to get carried away, but remember, you’re not alone. 

Easily monitor Logs and metrics in one unified platform with Logz.io!

What’s New in Logz.io – September 2019

$
0
0

We hope you guys managed to rest over the summer because we sure didn’t. Our engineering team has been working hard on developing new features and enhancements, some of which may have flown under your radar. To help you catch up, here’s a short recap of the latest and greatest from Logz.io with relevant referrals to read up more about the different items.

Before we start, and just as a reminder, the What’s New pane within the platform is a great way to stay informed of these latest developments as well. To stay up-to-date, simply open the pane from the Settings menu in the top-right corner of the page:

whats new

Drop Filters

Enabling our users to optimize their logging pipelines has always been an important goal for us. Features like the Data Optimizer, Archive/Restore (see below) and Volume Analysis were first steps in allowing our users to log in a more cost-efficient way. 

Drop Filters takes this one step further by facilitating what we call “On-Demand Logging” and giving you the ability to decide what specific logs you don’t want to be stored and indexed by Logz.io. You can keep your existing logging pipelines up and running. The logs simply won’t be stored and therefore will not be held against your overall logging quota. 

drop filtersYou can learn more about Drop Filters here.

Reports

The ability to take a live snapshot of a Kibana dashboard and share it is one of the most popular features we’ve added on top of Kibana. Reports is an enhancement of this capability, allowing you to automate the process and create a report on a regular schedule covering a time range of your choice. This way you can generate reports while offline or send regular status reports to your manager or other stakeholders in the business. 

edit report

You can learn more about Reports here.

Archive/Restore

Logz.io’s Archive/Restore helps you easily ship your data into long-term storage on S3 for subsequent retrieval and historical log analysis when required. This functionality has always been available in Logz.io but we recently revamped the user experience, giving users full and easy control over the process of backing up their data and restoring it via the Logz.io user interface. 

archive and restore

IAM role authentication

S3 is an extremely common component in AWS-based logging pipelines and we have now added an additional way to authenticate users using IAM roles — a much easier and safer way to delegate access to buckets within organizations. When adding a new S3 bucket you will be asked what authentication method to use. To configure the new IAM role authentication you will need to use the role ARN available: 

role configuration

You can still use the previous method, but we recommend the new method as a more secure best practice. More information on setting up IAM role authentication for S3 buckets in Logz.io is available here.

Zeek support

Since announcing Logz.io Security Analytics last year, we’ve been steadily adding support for various security monitoring tools, including new integrations, correlation rules and built-in dashboards for OSSEC, GuardDuty and Azure Active Directory, and we recently added support for Zeek as well. 

Zeek is a popular open-source network analysis tool and the log files it generates contain a wealth of information on network activity which can be used to identify malicious activity. The new support for Zeek in Logz.io Security Analytics includes easy integration, new correlation rules and a pre-packaged monitoring dashboard. 

zeek

You can learn more about Zeek support in Logz.io Security Analytics here.

We want your feedback!

Our roadmap is packed with new features, including some new machine learning capabilities as well as new integrations with popular open-source monitoring tools to support additional use cases. We expect most of this product goodness to be introduced over the next couple of months so stay tuned for news.

In the meantime, and as always, we’d love to get your feedback about this latest added functionality in the platform as well as existing features. Feel free to reach out to us either via our community or by dropping a note to: info@logz.io

As in previous years, we will be at AWS re:invent and would love to meet you face to face. Be sure to drop by our booth to say hello!

See our new features in action!

Speed and Quality are Not Mutually Exclusive: Telemetry is the Key

$
0
0

Originally posted September 3, 2019 on Hackernoon by Daniel Berman

All engineering teams strive to build the best product they can as quickly as possible. Some, though, stumble into a false dichotomy of choosing between speed and quality. While that choice may have been necessary in the past, it’s not the case today. 

What I’d like to do in this article is explain why. 

By reviewing the relationship between frequent software releases and increasing software quality and the dependency with telemetry, I’ll try to help readers understand that frequent releases coupled with data-backed insights are the best way to succeed in today’s marketplace.

Pushing for faster value streams

Value streams define engineering work. A stream includes all the work required to produce the end outcome. The outcome may be launching a new product, releasing a new feature, or simply churning through support tickets. Irrespective of their specific job title, everyone in engineering participates in a value stream. Organizations have always wanted to have faster value streams, and why wouldn’t they? Working faster means earlier time to market, beating competitors, and putting the product or service into customers’ hands quicker.

Modern technology has turned every company into a technology companywhether they know it or not. In today’s market, building and shipping software successfully directly impacts the bottom line. The most successful companies differentiate themselves by building better engineering value streams. Their principles and practices of continuous delivery guided by real-time telemetry and continuous improvement have come to be known as DevOps. Indeed moving from waterfall to agile development and DevOps methodologies makes complete and undisputed sense. But if that’s the case, why are so many organizations still debating between speed and quality of their application releases? Is this not part of the same thing?

The research behind engineering performance

In their two books, The DevOps Handbook: How to Create World-Class Agility, Reliability, and Security in Technology Organizations and Accelerate: The Science of Lean Software and DevOps: Building and Scaling High Performing Technology Organizations, Gene Kim, John Willis, Patrick Debois, Jez Humble, and Nicole Forsgren chart a clear course for improving engineering performance and debunk the idea that moving fast reduces quality. 

Martin Fowler, the legendary software architect and author, claims that refuting this very idea is their most important contribution:

“This huge increase in responsiveness does not come at a cost in stability, since these organizations find their updates cause failures at a fraction of the rate of their less-performing peers, and these failures are usually fixed within the hour. Their evidence refutes the bimodal IT notion that you have to choose between speed and stability—instead, speed depends on stability, so good IT practices give you both.”

The findings in these research pieces are pretty convincing. High-performing teams, as compared to low-performing teams, deploy 46 times as often, are 440 faster from commit to production, 170 times faster in MTTR, and ⅕ as likely to encounter a failed deploy. These findings go hand in hand with Fowler’s assessment that good IT practices create speed and stability. 

The practices also generate business results. Accelerate compared data from Puppet Lab’s State of DevOps reports over three years. They found that high performance teams had 50% higher market capitalization growth compared to lower performers. Also — high performance teams are twice as likely to exceed profitability, productivity, market share, and customer goals compared to lower performers. They’re “twice as likely to exceed noncommercial performance goals as low performers: quantity of products/services, operating efficiency, customer satisfaction, quality of products/services, achieving organizational/mission goals.”

If this is not enough proof, two case studies in the DevOps Handbook — Gary Gurver’s experience as the director of engineering for HP’s LaserJet Firmware division and Ernest Muller at Bazaarvoice — further drive home the point. They demonstrate that using an established set of technical practices creates both speed and stability. This is the basis of The DevOps Handbook’s first principle: The Principle of Flow. It focuses on improving time from development to production. However, the benefits are contingent on the second principle.

The Principle of Feedback

The Principle of Feedback allows teams to course correct according to what’s happening in production. This requires telemetry (such as logs and metrics) across the value stream. The idea goes beyond the simple approach of monitoring uptime. Integrating telemetry across the value stream allows development and product management to quickly create improvements whether it’s from a production outage, deployment failure, A/B tests, or customer usage patterns. Focusing on telemetry makes decisions objective and data driven. 

Again, there are desirable knock-on effects across the organizations. Data aligns teams with objective goals, amplifies signals across the value streams, and sets the foundation for organizational learning and improvement. 

But designing for feedback doesn’t just happen. It’s a by-product of strong leadership that internalizes the goal to create telemetry within applications, environments, both in production and pre-production, and in the deployment pipeline. 

Scott Prugh, Chief Architect and Vice President of Development at CSG, said: 

“Every time NASA launches a rocket, it has millions of automated sensors reporting the status of every component of this valuable asset. And yet, we often don’t take the same care with software—we found that creating application and infrastructure telemetry to be one of the highest return investments we’ve made. In 2014, we created over one billion telemetry events per day, with over one hundred thousand code locations instrumented.”

To resolve production incidents, high performance IT teams use telemetry 168 times faster than their peers with MTTR measured in minutes. Low performers, for contrast, had MTTR measured in days. This is no surprise when key business metrics are tracked, visualized, and monitored. 

The following image is taken from Ian Malpass’ “Measure Anything, Measure Everything.” It displays successful and unsuccessful logins. Vertical lines annotate deploys. It’s immediately apparent that there was a problem before 7 a.m. that may be related to the last deploy. Teams can discern that information in seconds. That means a quicker diagnosis and paired with continuous delivery, faster resolutions. 

measure anything

Etsy embodies this philosophy in what became known as the “Church of Graphs.” Ian Malpass, the Director of Engineering, puts it simply: “Tracking everything is key to moving fast, but the only way to do it is to make tracking anything easy…We enable engineers to track what they need to track, at the drop of a hat, without requiring time-sucking configuration changes or complicated processes.” 

Eventually they added enough tracking to make deployments safe.

Building proper telemetry infrastructure is a key decision. The telemetry system must take in numeric data and logs across multiple components and present it in a unified way. Many teams start with a simple Statsd solution since adding telemetry requires one line of code and a Statsd server to aggregate the data. That’s enough to start, but it omits a huge data source. All applications produce logs. The logs may contain the most valuable insights into performance and are vital for effective troubleshooting. 

If adding instrumentation to code isn’t possible, it’s possible to extract telemetry from existing logs. Also, some failure scenarios cannot be instrumented in code. A log entry like “process 5 crashed from a segmentation fault” can be counted and summarized as a single segfault metric across all infrastructure. Transforming logs into data enables statistical anomaly detection, so changes from “30 segfaults last week” to “1000 of segfaults in the last hour” can trigger alerts.

The debate is still alive

As Dale Vile, CEO & Distinguished Analyst at Freeform Dynamics Ltd, explained in an article for Computer Associates,  organizations are still deciding on the necessary trade off between speed or quality despite the above wide-scale agreement that the two should really go hand and hand. 

The simple fact is that environments have grown even more complex with constant cycles of development, testing, releasing and ongoing support of the process. The growing adoption of microservices and an orchestration layer to manage the complexity has added a dynamic where speed is now inevitable and quality seems to be pushed by a plethora of vendors focusing on each part of this application release value chain. Every link in the chain is critical but gaining both high and low level visibility across all the constantly moving parts of the application delivery cycle is more challenging.

Logging, metric monitoring, and increasingly distributed tracing as well, are common practice amongst engineering teams. By definition though, the best we can do is react as quickly as possible once notified a log- or metric-based event occurred. This falls short of being proactive enough to ensure safe and continuous operations. To help engineers be more proactive, the next generation of supporting technologies need to be able to identify and reveal events already impacting the environment automatically, together with the context required to see the bigger picture.

Roi Ravhon, Core Team Lead here at Logz.io explains:

“In today’s world of orchestration of hundreds of microservices, it is impossible to reach continuous operations with the ability to proactively see errors and exceptions before they impact production. Indeed, with these insights, the faster application release that can be achieved, the better the quality of the final product will be. Without proactive insights, the opposite is true”

With this technological capacity, we can truly achieve our vision of continuous operations with the use of the modern technology stack – so long as it is enhanced with a layer of application insights that intelligently give us visibility into these errors and exceptions that have – and have not – been previously defined. In this state speed = quality.

The debate should be OVER

I think it’s time to finally bury the debate over speed and stability. The studies above demonstrate that applying The Principle of Flow via continuous delivery and backing with the Principle of Feedback via telemetry should produce both speed and quality. 

Cloud computing, containers and container orchestration and serverless have helped increase access to continuous delivery. Monitoring technologies have evolved as well with an eye to automation and advanced analytics based on machine learning. Today’s engineering teams are better poised than ever to build robust telemetry systems. There’s a plethora of paid products for all classes of vendors, open source platforms, and a host of integrations for all popular languages and frameworks. These platforms take advantage of the current landscape offering drop in telemetry and visualizing for servers, containers, orchestrators, virtual machines, and databases. 

Today’s systems create huge volumes of data, and data analysis tools must be able to keep pace. Automated metrics and trend prediction can amplify failure signals and reveal new ones that teams couldn’t find on their own. Advanced log analytics has become standard practice, helping teams to effectively dig deeper to discover the root cause in a fraction of the time this task used to take. In 2019, artificial intelligence is already adding even deeper visibility and providing the insights necessary to trust the speed and improve products safely.

Deploy more frequently, with better quality using Logz.io's ELK-as-a-Service.

Best Practices for Managing Elasticsearch Indices

$
0
0

Elasticsearch is a powerful distributed search engine that has, over the years, grown into a more general-purpose NoSQL storage and analytics tool. The recent release of Elasticsearch 7 added many improvements to the way Elasticsearch works. It also formalized support for various applications including machine learning, security information and event management (SIEM), and maps, among others, through a revamped Kibana.

The way data is organized across nodes in an Elasticsearch cluster has a huge impact on performance and reliability. For users, this element of operating Elasticsearch is also one of the most challenging elements. An non-optimized or erroneous configuration can make all the difference. While traditional best practices for managing Elasticsearch indices still apply, the recent releases of Elasticsearch have added several new features that further optimize and automate index management. This article will explore several ways to make the most of your indices by combining traditional advice with an examination of the recently released features.

Understanding indices

Data in Elasticsearch is stored in one or more indices. Because those of us who work with Elasticsearch typically deal with large volumes of data, data in an index is partitioned across shards to make storage more manageable. An index may be too large to fit on a single disk, but shards are smaller and can be allocated across different nodes as needed. Another benefit of proper sharding is that searches can be run across different shards in parallel, speeding up query processing. The number of shards in an index is decided upon index creation and cannot be changed later.

Sharding an index is useful, but, even after doing so, there is still only a single copy of each document in the index, which means there is no protection against data loss. To deal with this, we can set up replication. Each shard may have a number of replicas, which are configured upon index creation and may be changed later. The primary shard is the main shard that handles the indexing of documents and can also handle processing of queries. The replica shards process queries but do not index documents directly. They are always allocated to a different node from the primary shard, and, in the event of the primary shard failing, a replica shard can be promoted to take its place.

While more replicas provide higher levels of availability in case of failures, it is also important not to have too many replicas. Each shard has a state that needs to be kept in memory for fast access. The more shards you use, the more overhead can build up and affect resource usage and performance.

Optimizations for time series data

Using Elasticsearch for storage and analytics of time series data, such as application logs or Internet of Things (IoT) events, requires the management of huge amounts of data over long periods of time.

Time series data is typically spread across many indices. A simple way to do this is to have a different index for arbitrary periods of time, e.g., one index per day. Another approach is to use the Rollover API, which can automatically create a new index when the main one is too old, too big, or has too many documents.

As indices age and their data becomes less relevant, there are several things you can do to make them use fewer resources so that the more active indices have more resources available. One of these is to use the Shrink API to flatten the index to a single primary shard. Having multiple shards is usually a good thing but can also serve as overhead for older indices that receive only occasional requests. This, of course, greatly depends on the structure of your data.

Frozen indices

For very old indices that are rarely accessed, it makes sense to completely free up the memory that they use. Elasticsearch 6.6 onwards provides the Freeze API which allows you to do exactly that. When an index is frozen, it becomes read-only, and its resources are no longer kept active.

The tradeoff is that frozen indices are slower to search, because those resources must now be allocated on demand and destroyed again thereafter. To prevent accidental query slowdowns that may occur as a result, the query parameter ignore_throttled=false must be used to explicitly indicate that frozen indices should be included when processing a search query.

Index lifecycle management

The above two sections have explained how the long-term management of indices can go through a number of phases between the time when they are actively accepting new data to be indexed to the point at which they are no longer needed.

The Index Lifecycle Management (ILM) feature released in Elasticsearch 6.7 puts all of this together and allows you to automate these transitions that, in earlier versions of the Elastic Stack, would have to be done manually or by using external processes. ILM, which is available under Elastic’s Basic license and not the Apache 2.0 license, allows users to specify policies that define when these transitions take place as well as the actions that apply during each phase.

We can use ILM to set up a hot-warm-cold architecture, in which the phases as well as the actions are optional and can be configured if and as needed:

  • Hot indices are actively receiving data to index and are frequently serving queries. Typical actions for this phase include:
    • Setting high priority for recovery.
    • Specifying rollover policy to create a new index when the current one becomes too large, too old, or has too many documents.
  • Warm indices are no longer having data indexed in them, but they still process queries. Typical actions for this phase include: 
    • Setting medium priority for recovery.
    • Optimizing the indices by shrinking them, force-merging them, or setting them to read-only.
    • Allocating the indices to less performant hardware.
  • Cold indices are rarely queried at all. 

Typical actions for this phase include:

    • Setting low priority for recovery.
    • Freezing the indices.
    • Allocating the indices to even less performant hardware.
  • Delete indices that are older than an arbitrary retention period.

ILM policies may be set using the Elasticsearch REST API, or even directly in Kibana, as shown in the following screenshot:

lifestyle policy

Organizing data in indices

When managing Elasticsearch indices, most of your attention goes towards ensuring stability and performance. However, the structure of the data that actually goes into these indices is also a very important factor in the usefulness of the overall system. This structure impacts the accuracy and flexibility of search queries over data that may potentially come from multiple data sources and as a result also impacts how you analyze and visualize your data.

In fact, the recommendation to create mappings for indices has been around for a long time. While Elasticsearch is capable of guessing data types based on the input data it receives, its intuition is based on a small sample of the data set and may not be spot-on. Explicitly creating a mapping can prevent issues with data type conflicts in an index.

Even with mappings, gaining insight from volumes of data stored in an Elasticsearch cluster can still be an arduous task. Data incoming from different sources which may have a similar structure (e.g., an IP address coming from IIS, NGINX, and application logs) may be indexed to fields with completely different names or data types.

The Elastic Common Schema, released with Elasticsearch 7.x, is a new development in this area. By setting a standard to consolidate field names and data types, it suddenly becomes much easier to search and visualize data coming from various data sources. This enables users to leverage Kibana to get a single unified view of various disparate systems they maintain.

Summary

Properly setting up index sharding and replication directly affects the stability and performance of your Elasticsearch cluster. The aforementioned features are all useful tools that will help you manage your Elasticsearch indices. Still, this task remains one of the most challenging elements for operating Elasticsearch, requiring an understanding of both Elasticsearch’s data model and the specific data set being indexed. 

For time-series data, the Rollover and Shrink APIs allow you to deal with basic index overflow and optimize indices. The recently added ability to freeze indices allows you to deal with another category of aging indices.

The ILM feature, also a recent addition, allows full automation of index lifecycle transitions. As indices age, they can be modified and reallocated so that they take up fewer resources, leaving more resources available for the more active indices.

Finally, creating mappings for indexed data and mapping fields to the Elastic Common Schema can help get the most value out of the data in an Elasticsearch cluster.

Monitor, troubleshoot, and secure your environment with ELK that performs at scale.

A Practical Guide to Kubernetes Logging

$
0
0

Kubernetes has become the de-facto industry standard for container orchestration. It provides the required abstraction for efficiently managing large-scale containerized applications with declarative configurations, an easy deployment mechanism, and both scaling and self-healing capabilities.

As with any system, logs help engineers gain observability into containers and the Kubernetes clusters they’re running on and the key role they play is evident in a lot of incidents featuring Kubernetes failures.  Yet Kubernetes poses a set of unique logging challenges. 

Kubernetes is a highly distributed and dynamic environment. In production, you’ll most likely be running dozens of machines with hundreds of containers that can be terminated, restarted, or rescheduled at any point in time. This transient and dynamic nature of the system is a challenge in itself. Kubernetes clusters are also comprised of multiple layers that need to be monitored, each producing different types of logs. 

Worried? Don’t be. Thankfully, there is a lot of literature available on how to gain visibility into Kubernetes. There are also various logging tools that integrate natively with Kubernetes to make the task easier. In this article, we’ll review some of these tools as well as review the Kubernetes logging architecture. 

Kubernetes logging architecture

As mentioned, one main challenge with logging Kubernetes is understanding what logs are generated and how to use them. Let’s start by examining the Kubernetes logging architecture from a birds eye view.

Container logging

The first layer of logs that can be collected from a Kubernetes cluster are those being generated by your containerized applications. The easiest method for logging containers is to write to the standard output (stdout) and standard error (stderr) streams.

Let’s take a look at an example pod manifest that will result in running one container logging to stdout: 

apiVersion: v1
kind: Pod
metadata:
name: example
spec:
containers:
- name: example
image: busybox
args: [/bin/sh, -c, 'while true; do echo $(date); sleep 1; done']

To apply the manifest, run:
kubectl apply -f example.yaml 

To take a look the logs for this container, we’ll use the kubectl log <container-name> command.

For persisting container logs, the common approach is to write logs to a log file and then use a sidecar container:

apiVersion: v1
kind: Pod
metadata:
  name: example
spec:
  containers:
  - name: example
    image: busybox
    args:
    - /bin/sh
    - -c
    - >
      while true;
      do
        echo "$(date)\n" >> /var/log/example.log;
        sleep 1;
      done
    volumeMounts:
    - name: varlog
      mountPath: /var/log
  - name: sidecar
    image: busybox
    args: [/bin/sh, -c, 'tail -f /var/log/example.log']
    volumeMounts:
    - name: varlog
      mountPath: /var/log
  volumes:
  - name: varlog
    emptyDir: {}

As seen in the pod configuration above, a sidecar container will run in the same pod along with the application container, mounting the same volume and processing the logs separately. 

Node logging

When a container running on Kubernetes writes its logs to stdout or stderr streams, the container engine streams them to the logging driver configured in Kubernetes. 

In most cases, these logs will end up in the /var/log/containers directory on your host. Docker supports multiple logging drivers but unfortunately, driver configuration is not supported via the Kubernetes API.

Once a container is terminated or restarted, kubelet stores logs on the node. To prevent these files from consuming all of the host’s storage, the Kubernetes node implements a log rotation mechanism. When a container is evicted from the node, all containers with corresponding log files are evicted.

Depending on what operating system and additional services you’re running on your host machine, you might need to take a look at additional logs. For example, systemd logs can be retrieved using the following command:

journalctl -u 

$ journalctl -u docker
-- Logs begin at Wed 2019-05-29 10:59:24 CEST, end at Mon 2019-07-15 10:55:17 CEST. --
jul 29 10:59:35 thinkpad systemd[1]: Starting Docker Application Container Engine...
jul 29 10:59:35 thinkpad dockerd[2172]: time="2019-05-29T10:59:35.285765854+02:00" level=info msg="libcontainerd: started new docker-containerd process" p
jul 29 10:59:35 thinkpad dockerd[2172]: time="2019-05-29T10:59:35.286021587+02:00" level=info msg="parsed scheme: \"unix\"" module=grpc

Logging kernel events might also be required in some scenarios. You might, for example, do the debug issues by mounting external volumes:

$ dmesg
[ 0.000000] microcode: microcode updated early to revision 0xb4, date = 2019-04-01
[ 0.000000] Linux version 4.15.0-54-generic (buildd@lgw01-amd64-014) (gcc version 7.4.0 (Ubuntu 7.4.0-1ubuntu1~18.04.1)) #58-Ubuntu SMP Mon Jun 24 10:55:24 UTC 2019 (Ubuntu 4.15.0-54.58-generic 4.15.18)
[ 0.000000] Command line: BOOT_IMAGE=/boot/vmlinuz-4.15.0-54-generic root=UUID=6e228d30-6415-4b41-b992-172d6899693e ro quiet splash vt.handoff=1
[ 0.000000] KERNEL supported cpus:
[ 0.000000] Intel GenuineIntel
[ 0.000000] AMD AuthenticAMD
[ 0.000000] Centaur CentaurHauls
[ 0.000000] x86/fpu: Supporting XSAVE feature 0x001: 'x87 floating point registers'
[ 0.000000] x86/fpu: Supporting XSAVE feature 0x002: 'SSE registers'
[ 0.000000] x86/fpu: Supporting XSAVE feature 0x004: 'AVX registers'
[ 0.000000] x86/fpu: Supporting XSAVE feature 0x008: 'MPX bounds registers'
[ 0.000000] x86/fpu: Supporting XSAVE feature 0x010: 'MPX CSR'

Cluster logging

On the level of the Kubernetes cluster itself, there is a long list of cluster components that can be logged as well as additional data types that can be used (events, audit logs). Together, these different types of data can give you visibility into how Kubernetes is performing as a ystem.

Core Kubernetes components

The following main core components comprise a Kubernetes cluster:

  • Kube-apiserver – the entry point to the cluster
  • Kubelet with container runtime – the primary node agent focused on running containers
  • Kube-proxy – the part that does TCP or UDP forwarding based on iptables or ipvs
  • Kube-scheduler – the element that determines where to run containers
  • Etcd—the key-value store used as Kubernetes’ cluster configuration storage

Some of these components run in a container, and some of them run on the operating system level (in most cases, a systemd service). The systemd services write to journald, and components running in containers write logs to the /var/log directory, unless the container engine has been configured to stream logs differently.

Events

Kubernetes events can indicate any Kubernetes resource state changes and errors, such as exceeded resource quota or pending pods, as well as any informational messages.

The kubectl get events -n <namespace> command returns all events within a specific namespace:

NAMESPACE	LAST SEEN	TYPE	  REASON OBJECT	MESSAGE
kube-system 	8m22s		Normal	  Scheduled            pod/metrics-server-66dbbb67db-lh865                                       Successfully assigned kube-system/metrics-server-66dbbb67db-lh865 to aks-agentpool-42213468-1
kube-system     8m14s               Normal    Pulling                   pod/metrics-server-66dbbb67db-lh865                                       Pulling image "aksrepos.azurecr.io/mirror/metrics-server-amd64:v0.2.1"
kube-system     7m58s               Normal    Pulled                    pod/metrics-server-66dbbb67db-lh865                                       Successfully pulled image "aksrepos.azurecr.io/mirror/metrics-server-amd64:v0.2.1"
kube-system     7m57s               Normal     Created                   pod/metrics-server-66dbbb67db-lh865                                       Created container metrics-server
kube-system     7m57s               Normal    Started                   pod/metrics-server-66dbbb67db-lh865                                       Started container metrics-server
kube-system     8m23s               Normal    SuccessfulCreate          replicaset/metrics-server-66dbbb67db             Created pod: metrics-server-66dbbb67db-lh865

Using kubectl describe pod <pod-name> will show the latest events for this specific Kubernetes resource:

Events:
  Type    Reason     Age   From                               Message
  ----    ------     ----  ----                               -------
  Normal  Scheduled  14m   default-scheduler                  Successfully assigned kube-system/coredns-7b54b5b97c-dpll7 to aks-agentpool-42213468-1
  Normal  Pulled     13m   kubelet, aks-agentpool-42213468-1  Container image "aksrepos.azurecr.io/mirror/coredns:1.3.1" already present on machine
  Normal  Created    13m   kubelet, aks-agentpool-42213468-1  Created container coredns
  Normal  Started    13m   kubelet, aks-agentpool-42213468-1  Started container coredns

Audit logs

Audit logs can be useful for compliance as they should help you answer the questions of what happened, who did what and when. 

Kubernetes provides flexible auditing of kube-apiserver requests based on policies. These help you track all activities in chronological order.

Here is an example of an audit log:

{
  "kind":"Event",
  "apiVersion":"audit.k8s.io/v1beta1",
  "metadata":{ "creationTimestamp":"2019-08-22T12:00:00Z" },
  "level":"Metadata",
  "timestamp":"2019-08-22T12:00:00Z",
  "auditID":"23bc44ds-2452-242g-fsf2-4242fe3ggfes",
  "stage":"RequestReceived",
  "requestURI":"/api/v1/namespaces/default/persistentvolumeclaims",
  "verb":"list",
  "user": {
    "username":"user@example.org",
    "groups":[ "system:authenticated" ]
  },
  "sourceIPs":[ "172.12.56.1" ],
  "objectRef": {
    "resource":"persistentvolumeclaims",
    "namespace":"default",
    "apiVersion":"v1"
  },
  "requestReceivedTimestamp":"2019-08-22T12:00:00Z",
  "stageTimestamp":"2019-08-22T12:00:00Z"
}

Kubernetes logging tools

Hopefully, you’ve now got a better understanding of the different logging layers and log types available in Kubernetes. The logging tools reviewed in this section play an important role in putting all of this together to build a Kubernetes logging pipeline. 

Fluentd

Fluentd is a popular open-source log aggregator that allows you to collect various logs from your Kubernetes cluster, process them, and then ship them to a data storage backend of your choice. 

Fluentd is Kubernetes-native and integrates seamlessly with Kubernetes deployments.  The most common method for deploying fluentd is as a daemonset which ensures a fluentd pod runs on each pod. Similar to other log forwarders and aggregators, fluentd appends useful metadata fields to logs such as the pod name and Kubernetes namespace, which helps provide more context.

ELK Stack

The ELK Stack (Elasticsearch, Logstash and Kibana) is another very popular open-source tool used for logging Kubernetes, and is actually comprised of four components: 

  • Elasticsearch – provides a scalable, RESTful search and analytics engine for storing Kubernetes logs
  • Kibana – the visualization layer, allowing you with a user interface to query and visualize logs
  • Logstash – the log aggregator used to collect and process the logs before sending them into Elasticsearch
  • Beats – Filebeat and Metricbeat are ELK-native lightweight data shippers used for shipping log files and metrics into Elasticsearch

ELK can be deployed on Kubernetes as well, on-prem or in the cloud. 

Together, these four components provide Kubernetes users with an end-to-end logging solution. As effective as it is, deploying and managing ELK deployments at scale is a challenge unto itself. 

Logz.io offers users with a fully-managed option for using the stack to log Kubernetes, with built-in integrations and monitoring dashboards. More information on logging Kubernetes with Logz.io’s ELK solution can be found here.

Google Stackdriver

And last but not least…Google Stackdriver.

Stackdriver is another Kubernetes-native logging tool that provides users with a centralized logging solution. Recently, Stackdriver also added support for  Prometheus. If you’re using GKE, Stackdriver can be easily enabled using the following command: 

gcloud container clusters create [CLUSTER_NAME] \
  --zone [ZONE]
  --project-id [PROJECT_ID]
  --enable-stackdriver-kubernetes \
  --cluster-version=latest

stackdriver

For more information on using Stackdriver to log Kubernetes, check out Logging Using Stackdriver

Endnotes

Once a cluster is up and running with logging in place, you can make sure your workloads and underlying infrastructure stay healthy. Logging also helps you to be prepared for issues that may arise during the deployment of a new production release and stop them before they affect the customer’s experience. 

It takes time to implement production-ready logging for your services, as well as to set up alerts and tune them appropriately. However, an effective logging solution allows you to focus on monitoring your key business metrics, which, in turn, increases the reliability of your products and your company’s revenue. 

To learn more contact us or visit our blog.

Useful Commands Cheat Sheet

Some useful kubectl commands are listed below:

kubectl logs  -f # stream logs
kubectl logs  --since=1h # return logs newer than a relative duration
kubectl logs  --since-time=”??”  # return logs after a specific date (RFC3339)
kubectl logs  --previous # print the logs for the previous instance of the container
kubectl logs  -c  # print the logs of this container	
kubectl logs -l 
Easily monitor, troubleshoot, and secure your Kubernetes environment with Logz.io

Key Trends in Logging Workflows

$
0
0

Logs have been around since the advent of computers and have probably not changed all too much since. What has changed, however, are the applications and systems generating them. 

Modern architectures — i.e. software and the infrastructure they are deployed on, have undergone vast changes over the past decade or so with the move to cloud computing and distributed environments. For engineers logging in this new world, these developments have resulted in a new set of challenges: huge and ever-growing logging pipelines that exact a cost in terms of time and money invested in developing and managing logs. 

No one really likes logs. But almost everyone recognizes their importance. Several methodologies have emerged over the past few years to help engineers overcome this dissonance and make logging workflows more efficient and user-friendly. Let’s take a closer look.

Structured logging

Logs are extremely easy to create. Most applications provide a built-in logging mechanism that generates a log output, usually to a file. Most modern applications will also output in JSON format which makes handling the logs a much easier task. 

Logs, however, are not always easy to analyze, especially when together with other log types. In most environments, you will most likely be looking at multiple log types, each varying in structure and format. When trying to connect the bits and pieces across data sources to create a story, this inconsistency poses a huge obstacle. 

Structured logging — i.e., the method of standardizing logs across applications — is not a new concept. Yet the understanding that it is a prerequisite for guaranteeing better observability into modern IT environments has made it into a best practice. ECS (Elastic Common Schema) is a great example of how structured logging has become a central piece of logging workflows today. 

Frictionless logging

The costs accompanying logging are real. Organizations are paying a hefty amount of money for logging infrastructure or log management solutions. But logging also entails another type of cost, that of time spent on implementing logging within the architecture. 

As described above, shifting left and implementing structured logging can help in formalizing the logging workflows within an organization. The truth of the matter, however, is that many teams will still struggle with some of the very mundane and basic elements of logging. This has given birth to new types of methodologies and accompanying technologies to minimize this friction.

Rookout, for example, allows developers to add log lines on-the-fly, without restarts or redeployments, in development, staging, and production. These logs can later be delivered to any 3rd party log management tool for aggregation and analysis. The idea behind this approach is to help developers improve their signal/noise ratio and also get the visibility they need even if they didn’t add logs into the code in advance.

Shifting left

The topic of structured logging provides a nice segway into the next trend — shifting left. In the context of logging, shifting left means making logging a core element of the development workflow and not just an afterthought. All too often, engineers will understand the importance of logging the hard way — after a critical error takes place without a log providing the context needed to resolve it. 

In the spirit of DevOps, shifting left with logging means giving developers full responsibility for implementing logging in their code across all the initial development stages: design, code review, testing and onwards into production. The sooner logs are hardcoded into the application’s logic, the more visibility will be gained throughout the application delivery lifecycle. 

Moreover, automation is added into the mix to make logging a much easier process. For example, companies like Grab have tied logging into their configuration management system to automatically change log levels during runtime. This way they can be sure the correct logs are being generated when necessary. 

“Log less” logging

As mentioned above, logs come at a cost. Modern applications and the infrastructure they are deployed on can be extremely verbose. There is a high price tag attached to collecting and storing all of the data they generate. Plus, the sheer amount of logs generated can obscure the visibility we were trying to gain with logging in the first place. 

These two pitfalls — cost and obscured visibility — have caused engineers to contemplate upon the veracity of the notion of implementing logging across the system. Instead, a more “log less” strategy is implemented, in which only critical components are logged or logs are merely sampled over time. Despite the risk of limited visibility in times of crisis, the “logging less” school is slowly gaining momentum. 

The compromise over what to log and what not to log can be a painful one to make. Realizing this, and understanding the growing costs of logging, we’ve introduced a series of cost and logging optimization capabilities. You can read more about this here

Endnotes

It’s hard to overestimate the importance of logs in gaining visibility into a system. If structured correctly, they can contain a wealth of information about what happened and when, and most importantly they can provide the context for understanding why. That’s why logs are still the backbone of monitoring systems. 

But yes. They’re not easy to handle. Teams spend time figuring out what to log, how to log, and when to log. Logging a distributed system today can result in millions of log messages that when taken together are more noise than anything else.

That is unless logging is given a more predominant place within the engineering processes. For teams rethinking their logging pipelines or just starting out with implementing logging workflows, the methodologies described above will help you make logs great again.

Happy logging!

Logz.io makes it easy to log your distributed system using the open source platforms you love!

Securing Secrets With HashiCorp Vault and Logz.io Security Analytics

$
0
0

Secrets, i.e. passwords, API keys, certificates, and any other type of credential used for digital authentication, have exploded in number and type. Even small-sized organizations might have thousands of SSH keys for example. 

Secrets are also a common security weakness often exploited by attackers. A recent study found that “89% of deployment scans show companies are not using Kubernetes’ secrets resources, with secrets wired in the open.” Because secrets are used for authentication and restricting access to sensitive data they have to be handled and managed extremely carefully. 

And that’s where tools like HashiCorp’s Vault come into the picture. Vault enables users to easily manage secrets across applications and the infrastructure they are deployed on, providing secure storage, revocation, renewal, encryption, and a long list of integrations with identity providers. Vault also enables users to generate audit logs that contain information on all the requests and responses that have been made to Vault. 

Providing visibility into who is accessing what and when, these audit logs can play a key role in a SOC. Users can collect these logs and ship them into a log management solution for further analysis. To be more proactive, however, a more sophisticated solution is required that can provide threat intelligence and alert when necessary.                                                       

In this article, I’ll show how to integrate Vault with Logz.io Security Analytics. You’ll learn how to install Vault, enable audit logs, ship them to Logz.io and use the provided rules to get alerted on Vault events.

Step 1: Installing Vault

If you’ve already got Vault installed, you can skip to the end of this section to see how to enable audit devices. If you haven’t, follow these steps to install and start the Vault dev server. 

Our first step is to download and install Vault’s executable. I’m installing Vault on an Ubuntu 16.04 EC2 instance but you’ll be able to find links to all the latest versions here:

wget

https://releases.hashicorp.com/vault/1.2.2/vault_1.2.2_linux_amd64.zip

It’s probably a good idea to download the checksum for the file but for the sake of keeping this simple we’ll proceed with unzipping the package:

unzip vault_*.zip

And the output:

Archive: vault_1.2.2_linux_amd64.zip

inflating: vault


Next, we’re going to move Vault into another directory within our system’s PATH:
sudo cp vault /usr/local/bin/ 

We can now use the vault command. Verify the installation with:

vault --version

You should see the help output displayed as follows:

Vault v1.2.2

Our next step is to start the Vault server. For the sake of this tutorial, we will use the Vault dev server — a built-in, pre-configured server useful for playing around with Vault locally. 

Start Vault with:

cd /usr/local/bin

./vault server -dev

You should see a bunch of information displayed in the output, starting with: 

=> Vault server configuration:

             Api Address: http://127.0.0.1:8200
                     Cgo: disabled
         Cluster Address: https://127.0.0.1:8201
              Listener 1: tcp (addr: "127.0.0.1:8200", cluster address: "127.0.0.1:8201", max_request_duration: "1m30s", max_request_size: "33554432", tls: "disabled")
               Log Level: info
                   Mlock: supported: true, enabled: false
                 Storage: inmem
                 Version: Vault v1.2.2

After this text, you’ll see some information required to continue on with the steps below, including the unseal key and root token.

Open a new tab in your terminal and as instructed in the output, export the Vault address:

export VAULT_ADDR='https://127.0.0.1:8200'

Then, save the provided unseal token somewhere and export the root token as follows:


Your next step is to enable audit logging by creating a new Audit Device. To do this, simply enter:

./vault audit enable file file_path=/var/log/vault/vault_audit.log log_raw=true

Note that we are using the log_raw flag in the command to remove hashing and facilitate analysis in Kibana.

That’s it! Vault will start to output audit logs to the configured file path.  Open the log file and take a look at the JSON entries:

sudo vim /var/log/vault/

{
	"time": "2019-09-02T09:37:39.711616033Z",
	"type": "response",
	"auth": {
		"client_token": "s.Ubtbu3BkWLROmnZ8lGwdAXKn",
		"accessor": "noCiri5z03Mja0daCI2xRvD4",
		"display_name": "root",
		"policies": ["root"],
		"token_policies": ["root"],
		"token_type": "service"
	},
	"request": {
		"id": "faeb518b-c403-e1b3-bf68-aab293f8a07c",
		"operation": "update",
		"client_token": "s.Ubtbu3BkWLROmnZ8lGwdAXKn",
		"client_token_accessor": "noCiri5z03Mja0daCI2xRvD4",
		"namespace": {
			"id": "root"
		},
		"path": "sys/audit/file",
		"data": {
			"description": "",
			"local": false,
			"options": {
				"file_path": "/home/ubuntu/Desktop/vault_audit_full_demo.log",
				"log_raw": "true"
			},
			"type": "file"
		},
		"remote_address": "127.0.0.1"
	},
	"response": {}
}

Step 2: Shipping Audit logs to Logz.io Security Analytics

To ship Vault’s audit logs to Logz.io, we’ll use Filebeat. If you haven’t already, follow the steps below to install it.

For secure shipping to Logz.io, we’ll start with downloading the public SSL certificate:

wget 
https://raw.githubusercontent.com/logzio/public-certificates/master/COMODORSADomainValidationSecureServerCA.crt && sudo mkdir -p /etc/pki/tls/certs && sudo mv COMODORSADomainValidationSecureServerCA.crt /etc/pki/tls/certs/

Then, you’ll need to add Elastic’s signing key so that the downloaded package can be verified (skip this step if you’ve already installed packages from Elastic):

wget -qO - https://artifacts.elastic.co/GPG-KEY-elasticsearch | sudo apt-key add - 

The next step is to add the repository definition to your system:

echo "deb https://artifacts.elastic.co/packages/6.x/apt stable main" | sudo tee -a /etc/apt/sources.list.d/elastic-6.x.list

All that’s left to do is to update your repositories and install Filebeat:

sudo apt-get update && sudo apt-get install filebeat 

Next, open up the Filebeat configuration file at /etc/filebeat/filebeat.yml and use the following configuration:

filebeat.inputs:
- type: log
  paths:
    - /var/log/vault/vault_audit.log
  fields:
    token: 
    logzio_type: hashi_vault
  fields_under_root: true
  json.keys_under_root: true
  encoding: utf-8
  ignore_older: 3h

filebeat.registry.path: /var/lib/filebeat

processors:
- rename:
    fields:
     - from: "agent"
       to: "beat_agent"
    ignore_missing: true
- rename:
    fields:
     - from: "log.file.path"
       to: "source"
    ignore_missing: true
- rename:
    fields:
     - from: "type"
       to: "hashi_type"
    ignore_missing: true
- rename:
    fields:
     - from: "logzio_type"
       to: "type"
    ignore_missing: true
    
output:
  logstash:
    hosts: ["listener.logz.io:5015"]
    ssl:
      certificate_authorities: ['/etc/pki/tls/certs/COMODORSADomainValidationSecureServerCA.crt']

A few things about this configuration are worth pointing out:

  • Be sure to enter your Logz.io account token in the relevant placeholder. You can find this token in the Logz.io UI.
  • The processors defined here are used to both comply with ECS (Elastic Common Schema) and perform some basic parsing for the fields in the logs. 
  • The output section defines the Logz.io listener as the destination for the logs. Be sure to comment out any other output destination.

Save the file and start Filebeat with:

sudo service filebeat start 

Within a minute or two, you will begin to see Vault audit logs in Logz.io:

vault logs in logz.io

Step 3: Analyzing Vault audit logs

Vault’s audit logs contain a long list of fields that can be used for gaining visibility into requests and responses. Before you begin analyzing the data, it’s always a good best practice to become familiar with the data set. 

In Kibana’s Discover page, open a log message and try and understand the fields constructing it:

discover

The hashi_type field, for example, can be used to understand whether the log is a request log or a response log. Another useful field is request.operation that tells you what type of operation was performed in Vault (e.g. delete, read, list, etc.). You can add these fields to Kibana to gain better visibility:

visibility

Next, you can begin building some visualizations to help you with monitoring these logs. The sky’s the limit — Kibana allows you to slice and dice your data in any way you like. Here is a simple example of a pie chart breaking down the different Vault request operations by type:

pie

Step 4: Monitoring Vault events

As mentioned above, to be more proactive, regular log management is not enough. In a SOC collecting millions of log messages a day from the different layers of an application, Vault’s audit logs will most likely get lost within all of this noise. 

In this last section of the tutorial, I’d like to show how you can use Logz.io Security Analytics to monitor Vault events more proactively. 

First, let’s switch over to Logz.io Security Analytics:

security analytics

The Summary dashboard provides us with an overview of our environment and we can see that a series of HashiCorp Vault events have taken place. These events are recorded when a correlation rule is triggered. 

Opening the Rules page, and searching for ‘vault’, we see a list of the available rules:


rule definition

Each rule contains a set of conditions that if met, create an event and send off a notification to a defined endpoint. The rules also contain some useful information that will help you with next steps. 

This Multiple failed logins attempts rule, for example, creates an event if Vault’s audit logs record failed authentication attempts:

edit rule

As defined in the rule, if the conditions are met five times or more within a timeframe of 5 minutes, a notification is sent via Slack or email. You can, of course, create your own rule if you like based on any query you enter in Kibana, or enable/disable/configure the existing rules as you see fit.

Vault Overview dashboard

Logz.io Security Analytics also bundles a pre-made monitoring dashboard for getting a birds-eye view of Vault-related events. The dashboard includes details on the alerts triggered, various breakdowns of unauthorized Vault operations, malicious IPs, geographic origins of requests made to vault, and plenty more. 

To use this dashboard, simply open the Dashboard page under the Research tab and select the dashboard from the list:

dashboard

Endnotes

Vault’s auditing functionality gives security teams the ability to gain visibility into a crucial element of an application’s architecture but these teams will need a complementary solution to be able to actually make use of this data for security analysis. 

Collecting, storing and analyzing Vault’s audit logs is crucial but without being able to be automatically alerted when an event takes place, these teams will most likely not even notice something is amiss until it’s too late. 

Logz.io Security Analytics provides you with easy integration with Vault as well as analysis tools for security monitoring and a set of built-in rules for being alerted as soon as your secrets are compromised. You can learn more about Logz.io Security Analytics on our website.

Identify threats faster with an easy-to-deploy and cloud-native solution.

How to Secure a Kubernetes Cluster

$
0
0

Kubernetes is one of the most advanced orchestration tools that currently exists in the software world. It provides out-of-the-box automation for environment maintenance and simplifies deployment and upgrade processes. It has different implementation types (on-premise, cloud-managed, hybrid, and more), multiple open-source supporting tools, and supports a wide range of configuration options. 

As Kubernetes continues to improve and develop, however, it is also becoming increasingly exposed to new security vulnerabilities and threats. Just last month, CNCF (Cloud Native Computing Foundation) performed a Kubernetes security audit survey and released its results to the public. The audit’s results were not promising and should raise a red flag for all Kubernetes users. According to the audit, attackers can take advantage of different Kubernetes vulnerabilities and several default configurations to execute malicious operations—such as running unpermitted, and sometimes unperceived, code—on the cluster content and gain access to other infrastructure components.

These vulnerabilities mean that securing a Kubernetes cluster has become mission-critical for DevOps teams. This article will review the different modules comprising a Kubernetes cluster and the different protection layers they require and will provide some best practices for applying security strategies.

Kubernetes pod protection

Every Kubernetes cluster consists of services and deployments which are represented as pods running Docker containers. Each of these containers is a separate OS that requires protection from both external attackers and internal malware. There are several attack vectors for infiltrating or misusing the container inside a pod, and there are different types of defenses that should be set up to prevent such breaches. 

The first and most common step for protecting a pod is using a minimalistic OS (such as CoreOS). This can help with preventing malware or unwanted processes from running inside the pod and block unaccredited software from being executed as part of the cluster. 

The next step is configuring the communication routes of each of these pods. This helps ensure that only approved ports and destinations are being used by the service. This way, a software that managed to run inside a container cannot affect any other service, spread to other pods, or establish communication with the outside world. 

Another method for creating segregation is using namespaces inside the cluster. Using namespaces for each of your applications or application modules defines them as logical groups. This helps control who can access each module or service and what permissions they have while also protecting workloads in case any of them were compromised. 

Extending coverage and adding monitoring for these communications can provide insights into these requests in realtime and provide all the necessary information for responding to and preventing misuse. Tools that provide a “live” map of all communications inside the cluster as well as into and from the Kubernetes cluster can facilitate this process (e.g. Twistlock or Alcide). 

Kubernetes pod monitoring should also be used for detection of new pods with unfamiliar names or the unauthorized scaling configuration of existing pods. These can indicate that data exfiltration or even mining efforts are occurring. Such events should generate alerts that equip the DevOps and security teams with all the information they need to resolve an incident.

Kubernetes host protection

Host—or node—security in Kubernetes is a world of its own. Different clusters can be launched with different OSs on their nodes, and each OS is exposed to unique vulnerabilities. Relevant hardening operations should be performed on every new node that is spun up in order to secure the node.

Whether they are running on a cloud-managed cluster, an on-premise deployment, or a hybrid solution, Kubernetes-based applications often use disks to store application state and for persistency. These disks must be protected with permission management to allow only the authorized services to access the stored information. They should also be protected with data encryption in case the data somehow ends up in unauthorized hands. 

Kubernetes’ vulnerabilities are constantly being produced and discovered, and DevOps teams must stay on top of the Kubernetes CVEs, making sure they understand their relevance and evaluate their effects on applications. 

Kubernetes’ etcd comes with support for automatic TLS. It also offers authentication through client certificates for both client-to-server as well as peer (server-to-server or cluster) communication.

In-cluster authentication and authorization is another vital aspect of Kubernetes security. Having only certified users accessing and managing resources such as the CPU, memory, and disk space is crucial for maintaining an efficient and well-administered infrastructure. Enabling RBAC helps restrict access to permitted users and allows for integration with external user management systems such as Active Directory, LDAP, SAML, Github, and more.

The most common procedure for increasing security levels and creating trustful Kubernetes nodes is restricting Linux capabilities to the exact usage of the services and utilizing Seccomp correctly to constantly perform system updates and install kernel patches.

Monitoring the Kubernetes nodes resources, measuring them in real time, and tracing the processes running on the VMs helps to create a higher level of protection. It exposes any unapproved operation or software and provides DevOps with the ability to instantly respond and apply a solution.

Kubernetes network protection

Up to this point, we’ve been discussing the internal risks that Kubernetes clusters are exposed to. Unfortunately, however, most of the threats to these clusters are external. Whether it’s a DDoS attack, hackers trying to infiltrate the cluster for a long-term eavesdropping attack, the exposure of information through a misconfigured firewall, or the usage of shared network, attackers tend to eventually find a loophole. They can then penetrate the cluster and the application, affecting the infrastructure’s credibility and sometimes even the company’s reputation. 

VPC networks, configured in the right manner, can provide a level of isolation that allows information to flow into the cluster—but not out of it—to a non-permitted target. HPA, one of Kubernetes’ strengths, must be configured in order to support planned and unplanned system  load. There are several methodologies for configuring the horizontal pod autoscaler. Engineers must always be aware of these possibilities and have the ability to choose the right method for the relevant state of each service. A high availability solution, where mission critical services have pods in different data centers around the globe, is a great option for securing against data-centered attacks and supplying a built-in disaster recovery solution.

Encryption in transit should be set up to make sure all requests—both inside and outside the cluster—are protected and only permitted components can read and understand them.

Security validations that are executed automatically can improve the authenticity of the infrastructure and network configuration. Monitoring the results of these executions and the real time status of the network will upgrade a team’s awareness of potential attacks as they occur. 

Kubernetes cluster auditing

Every activity, operation, deployment or configuration change should be audited and stored. This log should show all activities that users execute in and to the cluster, including what happened, who did it, and when it was done. 

Kubernetes audit logging tracks most of this information, and a simple integration with the cluster API should provide the ability to ship these logs to external logging and storage systems. It can also generate dashboards and suspicious activity alerts or reports that can be used during an incident investigation.

Summary

Protecting a Kubernetes cluster is not a simple job. Due to the variety of attack vectors that exist, the regular evolution of technologies, and the steady adoption rate of this tool, attackers find it tempting to infiltrate clusters and either extract data or use the resources for their own needs.

DevOps teams basing their backend on Kubernetes technology must stay on top of all threats and vulnerabilities that a cluster, and the Docker containers running inside it, are exposed to and have a runbook for responding for every type of incident. And using telemetry data, such as metrics and logs, to keep eyes on a cluster, is crucial for identifying security breaches or malicious activities quickly. This is, of course, a topic unto itself and requires a deeper look. I recommend reading up on Kubernetes logging to get started.

Easily secure your Kubernetes clusters without inhibiting your DevOps workflow.

Deploying the ELK Stack on Kubernetes with Helm

$
0
0

ELK and Kubernetes are used in the same sentence usually in the context of describing a monitoring stack. ELK integrates natively with Kubernetes and is a popular open-source solution for collecting, storing and analyzing Kubernetes telemetry data. 

However, ELK and Kubernetes are increasingly being used in another context — that of a method for deploying and managing the former. While deploying the ELK Stack using Kubernetes might seem like a complex task, there are more and more best practices around this scenario as well as Kubernetes-native solutions.

One of these solutions is using Helm charts.

What’s Helm?

Maintained by CNCF, Helm is increasingly becoming a standard way for managing applications on Kubernetes. The easiest way to think about Helm is as a package manager for Kubernetes. It’s actually a bit more than just a package manager though as it allows users to create, publish and share applications on Kubernetes. 

Each Helm chart contains all the specifications needed to be deployed on Kubernetes in the form of files describing a set of Kubernetes resources and configurations. Charts can be used to deploy very basic applications but also more complex systems such as…the ELK Stack! 

Earlier this year, the folks at Elastic published Helm charts for Elasticsearch, Kibana, Filebeat and Metricbeat, making the deployment of these components on Kubernetes extremely simple. 

Let’s take a closer look.

The setup

For the sake of this tutorial, I used Minikube installed on my Mac. You’ll also need Kubectl set up and configured.

Step 1: Setting Up Kubernetes

Obviously, we first need to make sure we have a Kubernetes cluster to install the ELK Stack on. 

When starting Minikube, you’ll need to allocate some extra firepower as the plan is to deploy a multi-node Elasticsearch cluster:

minikube start --cpus 4 --memory 8192 

You should see output similar to this: 

Starting local Kubernetes v1.10.0 cluster...
Starting VM...
Getting VM IP address...
Moving files into cluster...
Setting up certs...
Connecting to cluster...
Setting up kubeconfig...
Starting cluster components...
Kubectl is now configured to use the cluster.

Just to verify your single-node Kubernetes cluster is up and running, use:

kubectl cluster-info

Kubernetes master is running at https://192.168.99.106:8443
KubeDNS is running at https://192.168.99.106:8443/api/v1/namespaces/kube-system/services/kube-dns:dns/proxy


Step 2: Installing Helm

Your next step is to install Helm. Again, if you’ve got Helm setup and initialized already, great, you can skip to deploying the ELK Stack in the following steps. 

To install Helm. execute the following 3 commands:

curl https://raw.githubusercontent.com/kubernetes/Helm/master/scripts/get > get_Helm.sh
chmod 700 get_Helm.sh
./get_Helm.sh

You should see the following output:

Downloading https://get.Helm.sh/Helm-v2.14.3-darwin-amd64.tar.gz
Preparing to install Helm and tiller into /usr/local/bin
Helm installed into /usr/local/bin/Helm
tiller installed into /usr/local/bin/tiller
Run 'Helm init' to configure Helm.

To start Helm, enter:

Helm init

To verify the Tiller server is running properly, use:

kubectl get pods -n kube-system | grep tiller 

And the output:

tiller-deploy-77b79fcbfc-hmqj8 1/1 Running 0 50s 

Step 3: Deploying an Elasticsearch Cluster with Helm

It’s time to start deploying the different components of the ELK Stack. Let’s start with Elasticsearch.

As mentioned above, we’ll be using Elastic’s Helm repository so let’s start with adding it:

Helm repo add elastic https://Helm.elastic.co
"elastic" has been added to your repositories

Next, download the Helm configuration for installing a multi-node Elasticsearch cluster on Minikube: 

curl -O https://raw.githubusercontent.com/elastic/Helm-charts/master/elasticsearch/examples/minikube/values.yaml

Install the Elasticsearch Helm chart using the configuration you just downloaded:

Helm install --name elasticsearch elastic/elasticsearch -f ./values.yaml 

The output you should be seeing looks something like this:

NAME:   elasticsearch
LAST DEPLOYED: Mon Sep 16 17:28:20 2019
NAMESPACE: default
STATUS: DEPLOYED

RESOURCES:
==> v1/Pod(related)
NAME                    READY  STATUS   RESTARTS  AGE
elasticsearch-master-0  0/1    Pending  0         0s

==> v1/Service
NAME                           TYPE       CLUSTER-IP     EXTERNAL-IP  PORT(S)            AGE
elasticsearch-master           ClusterIP  10.101.239.94         9200/TCP,9300/TCP  0s
elasticsearch-master-headless  ClusterIP  None                  9200/TCP,9300/TCP  0s

==> v1beta1/PodDisruptionBudget
NAME                      MIN AVAILABLE  MAX UNAVAILABLE  ALLOWED DISRUPTIONS  AGE
elasticsearch-master-pdb  N/A            1                0                    0s

==> v1beta1/StatefulSet
NAME                  READY  AGE
elasticsearch-master  0/3    0s


NOTES:
1. Watch all cluster members come up.
  $ kubectl get pods --namespace=default -l app=elasticsearch-master -w
2. Test cluster health using Helm test.
  $ Helm test elasticsearch

As noted at the end of the output, you can verify your Elasticsearch pods status with:

kubectl get pods --namespace=default -l app=elasticsearch-master -w 

It might take a minute or two, but eventually, three Elasticsearch pods will be shown as running:

NAME                     READY     STATUS     RESTARTS   AGE
elasticsearch-master-0   1/1       Running   0         1m
elasticsearch-master-2   1/1       Running   0         1m
elasticsearch-master-1   1/1       Running   0         1m

Our last step for deploying Elasticsearch is to set up port forwarding:

kubectl port-forward svc/elasticsearch-master 9200 

And the output:

Step 4: Deploying Kibana with Helm

Next up — Kibana. As before, we’re going to use Elastic’s Helm chart for Kibana:

Helm install --name kibana elastic/kibana 

And the output: 

NAME:   kibana
LAST DEPLOYED: Wed Sep 18 09:52:21 2019
NAMESPACE: default
STATUS: DEPLOYED

RESOURCES:
==> v1/Deployment
NAME           READY  UP-TO-DATE  AVAILABLE  AGE
kibana-kibana  0/1    1           0          0s

==> v1/Pod(related)
NAME                            READY  STATUS             RESTARTS  AGE
kibana-kibana-6d7466b9b9-fbmsz  0/1    ContainerCreating  0         0s

==> v1/Service
NAME           TYPE       CLUSTER-IP    EXTERNAL-IP  PORT(S)   AGE
kibana-kibana  ClusterIP  10.96.37.129         5601/TCP  0s

Verify your Kibana pod is running (it might take a minute or two until the status turns to “Running”):

kubectl get pods

NAME                             READY     STATUS    RESTARTS   AGE
elasticsearch-master-0           1/1       Running   0          15m
elasticsearch-master-1           1/1       Running   0          15m
elasticsearch-master-2           1/1       Running   0          15m
kibana-kibana-6d7466b9b9-fbmsz   1/1       Running   0          2m


And last but not least, set up port forwarding for Kibana with: 

kubectl port-forward deployment/kibana-kibana 5601 

You can now access Kibana from your browser at: http://localhost:5601:

Add data

Step 5: Deploying Metricbeat with Helm

To set up a data pipeline, we’re going to end this tutorial with deploying the Metricbeat Helm chart:

Helm install --name metricbeat elastic/metricbeat 

Within a minute or two, your Kubernetes cluster will display Metricbeat pods running alongside your Elasticsearch and Kibana pods:

kubectl get pods

NAME                                             READY     STATUS    RESTARTS   AGE
elasticsearch-master-0                           1/1       Running   0          11m
elasticsearch-master-1                           1/1       Running   0          11m
elasticsearch-master-2                           1/1       Running   0          11m
kibana-kibana-6d7466b9b9-bsfd5                   1/1       Running   0          6m
metricbeat-kube-state-metrics-bd55f95cc-8654c    1/1       Running   0          1m
metricbeat-metricbeat-kjj6z                      1/1       Running   0          1m
metricbeat-metricbeat-metrics-699db67c5c-b2fzs   1/1       Running   0          1m


If you curl Elasticsearch, you’ll see that metrics have already begun to be indexed in Elasticsearch:

curl localhost:9200/_cat/indices

green open .kibana_task_manager               QxPJtK5rQtGGguLRv5h9OQ 1 1   2 4 87.7kb  44.8kb
green open metricbeat-7.3.0-2019.09.18-000001 DeXaNAnMTWiwrQKNHSL0FQ 1 1 291 0  1.1mb 544.1kb
green open .kibana_1                          gk0OHIZDQWCNcjgb-uCBeg 1 1   4 0 30.3kb  15.1kb

All that’s left to do now is define the index pattern in Kibana and begin analyzing your data. In Kibana, go to the Management → Kibana → Index Patterns page, and click Create index pattern. Kibana will automatically identify and display the Metricbeat index:

create index pattern

Enter ‘metricbeat-*’ and on the next step select the @timestamp field to finalize the creation of the index pattern in Kibana. 

metricbeat

Hop on over to the Discover page. You’ll see all the metrics being collected from your Kubernetes cluster by Metricbeat displayed:

discover

Endnotes

These Helm charts are a great way to get started with ELK on Kubernetes but will require tweaking to be able to handle large payloads. Maintaining an ELK Stack in production is not an easy task to start out with and managing a multi-node, large Elasticsearch cluster on Kubernetes will require both engineering resources and strong infrastructure. I expect that as Helm becomes the standard way to build and deploy applications on Kubernetes, best practices will emerge for handling large scale ELK deployments as well. Looking forward to it!

Easily monitor, troubleshoot, and secure Kubernetes with Logz.io!

Top 10 Open Source Monitoring Tools for Kubernetes

$
0
0

With over 58K stars on GitHub and over 2,200 contributors across the globe, Kubernetes is the de facto standard for container orchestration. While solving some of the key challenges involved in running distributed microservices, it has also introduced some new ones. 

Not surprisingly, when asked, engineers list monitoring as one of the main obstacles for adopting Kubernetes. After all, monitoring distributed environments has never been easy and Kubernetes adds additional complexity. What isn’t surprising as well is the development of various open-source monitoring solutions to help overcome the challenge. 

These tools tackle different aspects of the challenge. Some help with logs, others with metrics. Some are data collectors while others provide an interface for operating Kubernetes from a birdseye view. Some are Kubernetes-native, others are more agnostic in nature. This variety and depth attest to the strength of Kubernetes as an ecosystem and community, and in this article, we’ll take a look at some of the more popular open-source tools available.

Prometheus

There is a long list of open-source time-series databases in the market today — Graphite, InfluxDB, Cassandra, for example, but none are as popular among Kubernetes users as Prometheus is. Initially a SoundCloud project and now part of CNCF (Cloud Native Computing Foundation), Prometheus has emerged as the de-facto open-source standard for monitoring Kubernetes. 

In a nutshell, what makes Prometheus stand out among other time-series databases, is its multi-dimensional data model, PromQL (the Prometheus querying language), built-in alerting mechanisms, a pull vs. push model, and of course, the ever-growing community. These differentiators make Prometheus a great solution for Kubernetes users, and the two projects are now closely integrated — users can easily run Prometheus on top of Kubernetes using the Prometheus Operator

Pros: Kubernetes-native, simple to use, huge community

Cons: Challenges at scale, storage

Grafana

For slicing and dicing Kubernetes metrics and constructing beautiful monitoring dashboards, Grafana is second to none. When used to monitor Kubernetes, Grafana will usually sit on top of Prometheus, although Grafana together with InfluxDB or Graphite are also common setups. 

There are a number of reasons Grafana is so popular, its ability to integrate with a long list of data sources being one of them. Grafana is extremely robust, featuring a long list of capabilities such as alerts, annotations, filtering, data source-specific querying, visualization and dashboarding, authentication/authorization, cross-organizational collaboration, and plenty more. 

Grafana is also super easy to set up on Kubernetes — there are numerous deployment specifications that include a Grafana container by default and there are plenty of Kubernetes monitoring dashboards for Grafana available for use.

Pros: Large ecosystem, rich visualization capabilities, alerting

Cons: Not optimized for Kubernetes log management 

ELK (ala Elastic Stack)

For logging Kubernetes, the most popular open-source solution is, of course, the ELK Stack.  An acronym for Elasticsearch, Logstash and Kibana, ELK also includes a fourth component — Beats, which are lightweight data shippers. Each component in the stack takes care of a different step in the logging pipeline, and together, they all provide a comprehensive and powerful logging solution for Kubernetes. 

Logstash is capable of aggregating and processing logs before sending them on for storage. Elasticsearch was designed to be scalable, and will perform well even when storing and searching across millions of documents. Kibana does a great job of providing users with the analysis interface needed to make sense of the data.  

All the different components of the stack can be deployed easily into a Kubernetes environment. You can run the components as pods using various deployment configurations or using helm charts. Both Metricbeat and Filebeat can be deployed as daemonsets and will append Kubernetes metadata to the documents.

Pros: Huge community, easy to deploy and use in Kubernetes, rich analysis capabilities

Cons: Difficult to maintain at scale

Fluentd/Fluent Bit

For log aggregation and processing, another popular solution used by Kubernetes users is Fluentd. Written in Ruby, Fluentd was created to act as a unified logging layer — a one stop component that can aggregate data from multiple sources, unify the differently formatted data into JSON objects, and route it to different output destinations. Fluentd is so widely used that the ELK acronym has been replaced by a new acronym – the EFK Stack.

Fluentd owes its popularity among Kubernetes users to Logstash’s fallacies, especially those performance-related. Design-wise — performance, scalability and reliability are some of Fluentd’s more outstanding features. Adding new inputs or outputs is relatively simple and has little effect on performance. Fluentd uses disk or memory for buffering and queuing to handle transmission failures or data overload and supports multiple configuration options to ensure a more resilient data pipeline. 

A more recent spin-off project is Fluent Bit. Similar to ELK’s beats, Fluent Bit is an extremely lightweight data shipper that excels as acting as an agent on edge-hosts, collecting and pushing data down the pipelines. In a Kubernetes cluster, Fluent Bit can be an excellent alternative to Fluentd if you’re limited for CPU and RAM capacity. 

Both Fluentd and Fluent Bit are also CNCF projects and Kubernetes-native — they are designed to seamlessly integrate with Kubernetes, enrich data with relevant pod and container metadata, and as mentioned — all this with a low resource footprint. 

Pros: Huge plugin ecosystem, performance, reliability

Cons: Difficult to configure

cAdvisor

cAdvisor is an open-source agent designed for collecting, processing, and exporting resource usage and performance information about running containers. It’s also built into Kubernetes and integrated into the Kubelet binary. 

Unlike other agents, cAdvisor is not deployed per pod but on the node level. It will auto-discover all the containers running on a machine and collects system metrics such as memory, CPU, network, etc. 

cAdvisor is one of the more basic open-source, Kubernetes-native monitoring tools out there. It’s easy to use (it exposes Prometheus metrics out-of-the-box) but definitely not robust enough to be considered an all-around monitoring solution. 

Pros: Built into Kubernetes, easy to use

Cons: Basic, lacks analytical depth, limited functionality

kubewatch

As the name implies, kubewatch watches for specific Kubernetes events and pushes notifications on these events to various endpoints such as Slack and PagerDuty. More specifically, kubewatch will look for changes made to specific Kubernetes resources that you ask it to watch — daemon sets, deployments, pods, replica sets, replication controllers, services, secrets, and configuration maps. kubewatch is easy to configure and can be deployed using either helm or a custom deployment. 

Pros: Supports multiple endpoints, easy to deploy

Cons: Just a watcher

kube-ops-view

Official documentation for this project clearly states that kube-ops-view is NOT a monitoring tool, so why is it listed here? Well, while it can’t be used to monitor and alert on production issues, it can give you a nice operational picture of your Kubernetes clusters — the different nodes deployed and their status, as well as the different pods running on the nodes.. That’s what it was built for, and only that. 

Source: GitHub.

Pros: Simple to use, easy to deploy 

Cons: Read-only tool, not for managing Kubernetes resources

kube-state-metrics

This Kubernetes-native metrics service was designed to listen to the Kubernetes API and generate metrics on the state of various objects such as pod, service, deployment, node, etc. A full list of the metrics generated by kube-state-metrics can be found here

Extremely easy to use, kube-state-metrics is only a metrics service and as such requires a few more bit and pieces to become part of a complete monitoring solution for Kubernetes. kube-state-metrics exports the metrics on the HTTP endpoint /metrics in plaintext format. Those using Prometheus will be happy to learn that the metrics were designed to be easily consumed/scraped.

Pros: Simple to use, Kubernetes-native, integrates seamlessly with Prometheus 

Cons: Only an agent for generating metrics

Jaeger

Distributed tracing is gradually becoming a monitoring and troubleshooting best practice for Kubernetes environments. Among the various open-source tracing tools available, Jaeger seems to be leading the pack.

Developed by Uber and open sourced in 2016, Jaeger was actually inspired by other existing tracing tools, Zipkin and Dapper, enabling users to perform root cause analysis, performance optimization and distributed transaction monitoring.  

Jaeger features OpenTracing-based instrumentation for Go, Java, Node, Python and C++ apps, uses consistent upfront sampling with individual per service/endpoint probabilities, and supports multiple storage backends — Cassandra, Elasticsearch, Kafka and memory. 

There are multiple ways of getting started with Jaeger on Kubernetes. Users can either use the new Jaeger Operator or, if they prefer, a daemonset configuration. There is also an all-in-one deployment available for testing and demoing purposes.

Pros: User interface, various instrumentation options, easy to deploy

Cons: Limited backend integration

Weave Scope

Last but not least, Weave Scope is a monitoring tool developed by the folks at Weaveworks that allows you to gain operational insights into your Kubernetes cluster. 

This might sound a bit like kube-ops-view, but Weave Scope takes it up a few notches by providing a much nicer user interface, but more importantly, by allowing the user to manage containers and run diagnostic commands on them from within this interface. 

weave scope

Image: GitHub.

It’s an effective tool for gaining context on your deployment. You’ll be able to see the application, the infrastructure it’s deployed on, and the different connections between the different components.

Pros: User interface, zero-configuration

Cons: Lacks analytical depth

Endnotes

This was of course just a partial list of the open-source tools available for monitoring Kubernetes, but if you’re just beginning to design your observability stack for Kubernetes, it’s a good place to start. 

With the exception of Jaeger, all the other tools should begin providing value without extra instrumentation or too much configuration. All of these tools are easy to test and deploy — set up a small sandbox environment, start small, and try and understand whether these tools are what you need. 

Kubernetes is extremely community-driven. The super-active community contributing to the project continues to add and improve built-in and add-on monitoring capabilities and I have little doubt the near future will see some additional developments. We’ll cover these as they are introduced. 

Simplify Kubernetes monitoring with Logz.io's hosted ELK solution!

Requirements of a Security Platform in a DevOps World

$
0
0

Businesses today cannot afford to be hacked. Cyber attacks can result in hefty fines and lawsuits, not to mention the reputational damage that can result in long-term revenue loss. Of course, this has always been true. But what has changed over the past few years is both the sheer volume of attacks and the growing sophistication used in them. 

To counter these threats, more and more organizations are looking to tighten security controls. The problem these organizations are facing, however, is that securing IT environments today is much more complicated. As organizations seek to enhance cybersecurity, they are also facing a reality in which software development is constantly shifting.

It’s a brave new world

Cybersecurity used to be the sole responsibility of the SOC or Security Analyst. In some organizations, MSPs or MSSPs would be used. Today, though, more and more companies are looking to their DevOps teams for securing production. In this brave new world, these engineers face a very different kind of IT environment than what their predecessors had to deal with. 

Modern applications, together with the infrastructure they are deployed on, are distributed, dynamic, and transient in nature. DevOps methodologies are enabling organizations to deploy code into production with ever-increasing velocity. Securing a microservice-based application orchestrated with Kubernetes and deployed on AWS is very different than securing a multi-layered monolith deployed on-prem. 

Sure. There is a long list of security systems promising to help bridge these differences, but are they enough? Let’s take a closer look at some of the key challenges DevOps and security teams are facing today.

Key challenges

Modern environments are much noisier. There is a larger amount of systems and components generating both data and alerts. This, in turn, results in a large number of false positives as well as obscured visibility.   

Integrating with different data sources for tighter security and end-to-end security monitoring is much more difficult. Not all security management systems come with out-of-the-box integrations for common collaboration, task management, and other R&D tools that are part of the SDLC and operations processes.

Maintaining security systems can be costly. Every component added to the application or infrastructure requires more effort. Security systems that require manual intervention for scaling the service or complex procedures for configuration can burden the security and DevOps teams, resulting in an actual cost in terms of time and money.

Wanted: a Cloud SIEM

Traditional SIEM systems can help overcome some of these challenges, but not all. These solutions are often complex and expensive, ineffective in preventing attacks and put simply, ill-suited for the world of DevOps. Distributed environments require flexibility, integrability and scalability whereas legacy solutions are rigid, slow, sequential and implemented in siloed environments, which ultimately impedes CI/CD development processes.

To overcome the challenges outlined above and answer the key requirements of a modern security system, next-gen SIEM security systems must support the following:

  • Handle data growth – As the amount of traffic and data that organizations obtain and manage grows nonlinearly, a valuable security system must know to normalize new data and data types as well as index them in a smart way. 
  • Filter false positives- The security management system should be able to distinguish between real and false-positive incidents as well as not indicate a threat during false events. 
  • Meeting compliance – Security management systems must be able to handle compliance and regulation requirements in order to eliminate compliance obstacles in different countries and regions. 
  • Simplified user interface – Since security systems are accessed and are required to deliver an extensive amount of information mostly during times of stress or attacks, the system user interface must be simple, clear, and user-friendly. 
  • Visibility – Security management systems must have the ability to provide full visibility and transparency. They must also be able to dive into every incident detected in real-time.

There is a huge demand for SIEM systems that can provide all of the above but this is just a partial list of what is required from a modern SIEM in the world of DevOps. The full list is detailed in our  “Requirements of a Security Platform in a DevOps World” whitepaper, available for download below.

To learn the specific challenges and solutions for security and DevOps teams, download Requirements of a Security Platform in a DevOps World.

The Top 10 DevOps Trends of 2019

$
0
0

At Logz.io we’re always keeping tabs on the latest and greatest in the DevOps world, for the benefit of both our own engineering team and for the teams that use our products. As the days get shorter and colder, we decided to look back on 2019 and share the top trends we’ve seen in 2019 so far. The acronym “CALMS” (Culture, Automation, Lean, Measurement, Sharing) is a helpful way to structure thinking about DevOps tools and techniques. Going from 2019 to 2020, the 10 DevOps trends in this article certainly exemplify these principles.

1. Pipeline Automation

The tendency to automate tasks where possible and practical is a consistent trend throughout DevOps. The concept of automated pipelines for software has become ubiquitous. For example, one can see the number of continuous integration and continuous delivery (CI/CD) tools continue to grow since GitHub introduced GitHub Actions, their seamless integration offering packaged with the GitHub Enterprise service that many organizations already use for source control.

2. Infrastructure as Code

Hand-in-hand with the popularity of automation comes the continuing rise of “infrastructure as code” tooling. Tools such as Terraform, AWS Cloud Formation, Azure Resource Manager, and GCP’s Deployment Manager allow environments to be spun up and down at will as part of the development process, in CI pipelines, or even in delivery and production. These tools are continuing to mature. Notably, Terraform version 0.12 was released in 2019, offering a number of new features that make it an even more powerful and expressive tool.

3. Kubernetes

It feels like Kubernetes is everywhere in 2019. From its inception in 2015, this immensely popular container orchestrator has had the most mindshare in the DevOps community, despite competition from products like Mesos and Docker’s Swarm. Major software vendors like RedHat and VMWare are fully committed to supporting Kubernetes. An increasing number of software vendors are also delivering their applications by default on Kubernetes.

In addition, the core Kubernetes API continues to grow, with several releases in 2019. Features like Custom Resources and Admission Webhooks are going into general availability, and the Container Storage Interface is going into beta.

Kubernetes adoption is still growing. While the platform has yet to prove itself for all classes of workloads, the momentum behind it seems to be strong enough to carry it through for a good while.

4. Service Meshes

Conversations about implementing Kubernetes increasingly go hand-in-hand with conversations about service meshes. “Service mesh” is a loose term that covers any software that handles service-to-service communication within a platform.

Service meshes can take care of a number of standard application tasks that application teams have traditionally had to solve in their own code and setups such as load balancing, encryption, authentication, authorization, and proxying. Making these features configurable and part of the application platform frees up development teams to work on improvements to their code rather than standard patterns of service management in a distributed application environment.

The biggest names in the service mesh arena are Istio, Consul, and Linkerd. Istio, which is sponsored by Google and RedHat, is most commonly associated with Kubernetes deployments and has a reputation for both complexity and difficult maintenance. Consul is a Hashicorp product with a simpler design that is quite feature-rich. Linkerd is less feature-rich, and the original product was relatively heavyweight. It’s recently been rewritten in Go and Rust (as “Linkerd2”) specifically for Kubernetes. It remains to be seen whether it can compete as a rival product in that space.

5. Observability

Another trend in DevOps is to talk about observability in applications. Observability is often confused with monitoring, but they are two distinct concepts. A good way to understand the difference is to think of monitoring as an activity and observability as an attribute of a system. Observability is a concept that comes from real-world engineering and control theory. A system is said to possess observability when its internal state can be easily inferred from its outputs. What this means in practice is that it should be easy to infer from an application’s representation of its internal state what is going on at any given time. As applications get more distributed in nature, determining why parts of it are failing (and therefore affecting the system as a whole) becomes more difficult. 

This is where the associated concept of cardinality, which refers to the number of discrete items of time-series data a system stores, comes in. As a rule, the higher the cardinality, the more likely a system is to be observable, since you have more pieces of data to look over when trying to troubleshoot it. Of course, the data gathered still needs to be pertinent to the system’s potential points of failure, and a mental map is also still required to effectively troubleshoot.

6. DevSecOps

While the DevOps portmanteau has been a standard part of IT discussions for some time, other neologisms are coming to the fore. DevSecOps is one of these. This concept is gaining traction as teams aim to get security “baked in” to their pipelines from the outset rather than trying to bolt it on after development is complete. Thus security increasingly becomes a responsibility of DevOps, SRE, and development teams; consequently tools are springing up to help them with that.

“Compliance as code” tools like InSpec have gotten popular as automated continuous security becomes a priority for organizations buckling under the weight of the numerous applications, servers, and environments they track simultaneously.

Automated scanning of container images and other artifacts is also becoming the norm as applications proliferate. Products like Aqua and SysDig are fighting for market share in the continuous security space.

You may also hear DevSecNetQAGovOps mentioned as more and more pieces of the application lifecycle seek to make themselves part of automated pipelines. However, DevSecOps is still the most common reiteration to the by-now somewhat-classic DevOps pairing.

7. The Rise of SRE

Site Reliability Engineering is an engineering discipline that originated in 2003 at Google (before the word DevOps was even coined!), described at length in their eponymously book Site Reliability Engineering. Eschewing traditional approaches to the support and maintenance of running applications, Google elevated operations staff to a level considered equivalent to their engineering function. Within this paradigm, SRE engineers are tasked with ensuring that live issues are monitored and fixed, sometimes by writing fresh software to aid reliability. In addition, their feedback on architecture and rework pertaining to reliability and stability is taken on by the development team.

SRE works at the scale of Google’s operations, where a division between development and operations (normally an anti-pattern for DevOps) is arguably required because of the infrastructure’s size. Having a team responsible for an entire application from development to production (a more traditional DevOps approach) is difficult to achieve when the platform is large and standardized across hundreds of data centers.

DevOps companies are more frequently advertising for “SRE Engineers” than “DevOps Engineers” in 2019. This may be in recognition of SRE’s specific engineering focus, as opposed to DevOps’ company-wide one. 

8. Artificial Intelligence

There is increasing speculation about the role artificial intelligence (and, specifically, machine learning) can play in aiding or augmenting DevOps practices. Products such as Science Logic’s S1 and the Cognitive Insights feature in Logz.io’s Log Analytics product are starting to trickle into the market and gain traction, although they are still in the early stages of adoption. These products use machine learning to detect anomalous behaviours in applications based on previously-observed or normative behaviors.

In addition to traditional monitoring activities, AI can be used to optimize test cases, determining which to run and not run on each build. This can reduce the length of time it takes to get an application into production without taking unnecessary risks with the stability of the system.

On the more theoretical side, Google has published information about their use of machine learning algorithms to predict hardware failures before they occur. As machine learning becomes more mainstream, expect more products like these to arrive in the DevOps space.

9. Serverless

Serverless has been a buzzword since AWS introduced AWS Lambda in 2014. Things have been heating up since then, as other providers and products have been getting in on the act.

The term “serverless computing” can be confusing—in part because servers still have to be involved at some level. Essentially, it describes a situation where the deployer of the application need not be concerned with where the code runs. It’s “serverless” in the sense that providing the servers is not something the developer needs to deal with. Typically, serverless applications are tightly coupled with their underlying computing platforms, so you need to be sure that you’re comfortable with that level of lock-in.

Following Lambda’s introduction, Azure Functions was released. Google Cloud Platform also got in on the act with Cloud Run, a service which allows you to bring your own containers to the platform rather than requiring you to upload the code on approved runtimes that Lamda or Functions currently support.

On the Kubernetes side, Knative is the best supported offering at present, but there are several other serverless options, including Apache OpenWhisk and OpenFaaS. More innovation is expected in this space as adoption grows and more use cases are covered.

10. “Shifting Left and Right” in CI/CD 

The concepts of “shifting left” and, to a lesser extent, “shifting right” in CI/CD are gaining visibility this year. As release cycles get smaller and smaller, “shifting left” means making efficiency improvements by failing builds earlier in the release cycle—not just with standard application testing, but also with code linting, QA/security checks, and any other checks that can alert the developer to issues with their code as early in the process as possible.

“Shift-right” testing takes place in production (or production-like) environments. It is intended to bring problems to the surface in production before monitoring or user issues are raised. One example of this trend is “log-driven development,” which is used internally at Logz.io

Summing Up

These are just ten of the more noteworthy trends we’ve been watching amidst the maelstrom of activity in the world of DevOps in 2019. Here at Logz.io, we strive to help our customers tackle many of the challenges they face around these trends with an observability platform that provides unified monitoring, troubleshooting, and security designed with DevOps teams in mind. Stay tuned for more from us as we keep our ears to the ground on the latest happenings in the industry and finger on the pulse for DevOps trends for 2020.

Viewing all 198 articles
Browse latest View live