Serving over 44% of the world’s websites, Apache is by far the most popular web server used today. Apache, aka Apache HTTP Server, aka Apache HTTPd, owes its popularity to its ease of use and open-source nature but also its inherent flexibility that allows engineers to extend Apache’s core functionality to suit specific needs.
To be able to effectively operate these servers, engineers have access to two main types of telemetry data — Apache logs and Apache metrics (available via status_module). Because of the amount of data being generated, being able to effectively collect and analyze Apache logs requires using log management and analysis platforms. In this article, we’ll take a look at using the ELK Stack.
To complete the steps here, you’ll need a running Apache web server and your own ELK Stack or Logz.io account.
Apache logging basics
Apache provides two log types that can be used for monitoring everything transpiring on the web server: access logs and error logs. Both logs are located, by default, under /var/log/apache2 on Ubuntu/Debian, and /var/log/httpd/ on MacOS, RHEL, CentOS and Fedora. Users can also use 3rd party modules to add logging functionality or additional information into log messages.
Apache error logs
Error logs are used for operational monitoring and troubleshooting and contain diagnostic information and errors logged while serving requests. You can change the log level and format as well as the verbosity level and use this log for debugging Apache and monitoring page requests.
Example log:
[Mon Jul 29 08:39:32.093821 2019] [core:notice] [pid 8326:tid 140316070677440] AH00094: Command line: '/usr/sbin/apache2'
Apache access logs
Access logs are most commonly used for performance monitoring but can also be used for operations and security use cases. The reason for this is simple — they contain a lot of valuable information on the requests being sent to Apache — who is sending them, from where and what is being requested exactly.
Example log:
199.203.204.57 - - [29/Jul/2019:11:17:42 +0000] "GET /hello.html HTTP/1.1" 304 180 "-"
"Mozilla/5.0 (Macintosh; Intel Mac OS X 10_13_6) AppleWebKit/537.36 (KHTML, like Gecko)
Chrome/75.0.3770.142 Safari/537.36"
Shipping to ELK
The simplest way of shipping Apache logs into the ELK Stack (or Logz.io) is with Filebeat. Filebeat ships with a built-in module that parses Apache logs and loads built-in visualizations into Kibana. Importantly, this means that there is no real need for adding Logstash into the mix to handle processing which makes setting up the pipeline much simpler. The same goes if you’re shipping to Logz.io — parsing is handled automatically. More about this later.
Installing Filebeat
First, add Elastic’s signing key so that the downloaded package can be verified (skip this step if you’ve already installed packages from Elastic):
wget -qO - https://artifacts.elastic.co/GPG-KEY-elasticsearch | sudo apt-key
add -
Next, add the repository definition to your system:
echo "deb https://artifacts.elastic.co/packages/7.x/apt stable main" | sudo
tee -a /etc/apt/sources.list.d/elastic-7.x.list
Update and install Filebeat with:
sudo apt-get update && sudo apt-get install filebeat
Enabling the Apache Module
Our next step is to enable the Apache Filebeat module. To do this, first enter:
sudo filebeat modules enable apache
Next, use the following setup command to load a recommended index template and deploy sample dashboards for visualizing the data in Kibana:
sudo filebeat setup -e
And last but not least, start Filebeat with:
sudo service filebeat start
It’s time to verify our pipeline is working as expected. First, cURL Elasticsearch to verify a “filebeat-*” index has indeed been created:
curl -X GET "localhost:9200/_cat/indices?v"

health status index                            uuid                   pri rep docs.count docs.deleted store.size pri.store.size
yellow open   filebeat-7.2.0-2019.07.29-000001 josDURxORa6rUmRJZDq-Pg   1   1          4            0     28.4kb         28.4kb
green  open   .kibana_1                        RjVOETuqTHOMTQZ8GiSsEA   1   0        705           13    363.9kb        363.9kb
green  open   .kibana_task_manager             L78aE69YQQeZNLgu9q_7eA   1   0          2            0     45.5kb         45.5kb
Next, open Kibana at: http://localhsot:5601 — the index will be defined and loaded automatically and the data visible on the Discover page:

Shipping to Logz.io
As mentioned above, since Logz.io automatically parses Apache logs, there’s no need to use Logstash or Filebeat’s Apache module. All we have to do is make some minor tweaks to the Filebeat configuration file.
Downloading the SSL certificate
For secure shipping to Logz.io, we’ll start with downloading the public SSL certificate:
wget
https://raw.githubusercontent.com/logzio/public-certificates/master/
COMODORSADomainValidationSecureServerCA.crt && sudo mkdir -p
/etc/pki/tls/certs && sudo mv
COMODORSADomainValidationSecureServerCA.crt /etc/pki/tls/certs/
Editing Filebeat
Next, let’s open the Filebeat configuration file:
sudo vim /etc/filebeat/filebeat.yml
Paste the following configuration:
filebeat.inputs:
- type: log
  paths:
  - /var/log/apache2/access.log
  fields:
    logzio_codec: plain
    token: <YourAccountToken>
    type: apache_access
  fields_under_root: true
  encoding: utf-8
  ignore_older: 3h
- type: log
  paths:
  - /var/log/apache2/error.log
  fields:
    logzio_codec: plain
    token: <YourAccountToken>
    type: apache_error
  fields_under_root: true
  encoding: utf-8
  ignore_older: 3h

filebeat.registry.path: /var/lib/filebeat

processors:
- rename:
    fields:
     - from: "agent"
       to: "beat_agent"
    ignore_missing: true
- rename:
    fields:
     - from: "log.file.path"
       to: "source"
    ignore_missing: true


output.logstash:
  hosts: ["listener.logz.io:5015"]
  ssl:
    certificate_authorities: ['/etc/pki/tls/certs/COMODORSADomainValidationSecureServerCA.crt']
A few comments on this configuration:
- The configuration defines two file inputs, one for the Apache access log and the other for the error log. If you need to change the path to these files, do so now.
- Be sure to enter your Logz.io account token in the placeholders. You can find this token in the Logz.io UI.
- The processors defined here are used to comply with the new ECS (Elastic Common Scheme) and are required for consistent and easier analysis/visualization across different data sources.
- The output section defines the Logz.io listener as the destination for the logs. Be sure to comment out the Elasticsearch destination.
Save the file and restart Filebeat with:
sudo service filebeat restart
Within a minute or two, you will begin to see your Apache logs in Logz.io:

Analyzing Apache logs
Kibana is a fantastic analysis tool that provides rich querying options to slice and dice data in any way you like. Auto-suggest and auto-complete features added in recent versions make searching your Apache logs much easier.
Here are a few examples.
The simplest search method, of course, is free text. Just enter your search query in the search field as follows:
japan

Field-level searches enable you to be a bit more specific. For example, you can search for any Apache access log with an error code using this search query:
type : "apache_access" and response >= 400

Query options abound. You can search for specific fields, use logical statements, or perform proximity searches — Kibana’s search options are extremely varied and are covered more extensively in this Kibana tutorial.
Visualizing Apache logs
Of course, Kibana is infamous for its beautiful dashboards that visualize the data in many different ways. I’ll provide four simple examples of how one can visualize Apache logs using different Kibana visualizations.
Request map
For Apache access logs, and any other type of logs recording traffic, the usual place to start is a map of the different locations submitting requests. This helps you monitor regular behavior and identify suspicious traffic. Logz.io automatically geo enriches the IP fields within the Apache access logs so you can use a Coordinate Map visualization to map the requests as shown below:

If you’re using your own ELK Stack and shipped the logs using the Apache Filebeat module, the fields are also geo enriched.
Responses over time
Another common visualization used for Apache access logs monitors response codes over time. Again, this gives you a good picture on normal behavior and can help you detect a sudden spike in error response codes. You can use Bar Chart, Line Chart or Area Chart visualizations for this:

Notice the use of the Count aggregation for the Y-Axis, and the use of a Date Histogram aggregation and Terms sub aggregation got the X-Axis.
Top requests
Data table visualizations are a great way of breaking up your logs into ordered lists, sorted in the way you want them to be using aggregations. In the example here, we’re taking a look at the requests most commonly sent to our Apache web server:

Errors over time
Remember — we’re also shipping Apache error logs. We can use another Bar Chart visualization to give us a simple indication of the number of errors reported by our web server:

Note, I’m using a search filter for type:apache_error to make sure the visualization is showing only depicting the number of Apache errors.
These were just some examples of what can be done with Kibana but the sky’s the limit. Once you have your visualizations lined up, add them up into one comprehensive dashboard that provides you with a nice operational overview of your web server.
Endnotes
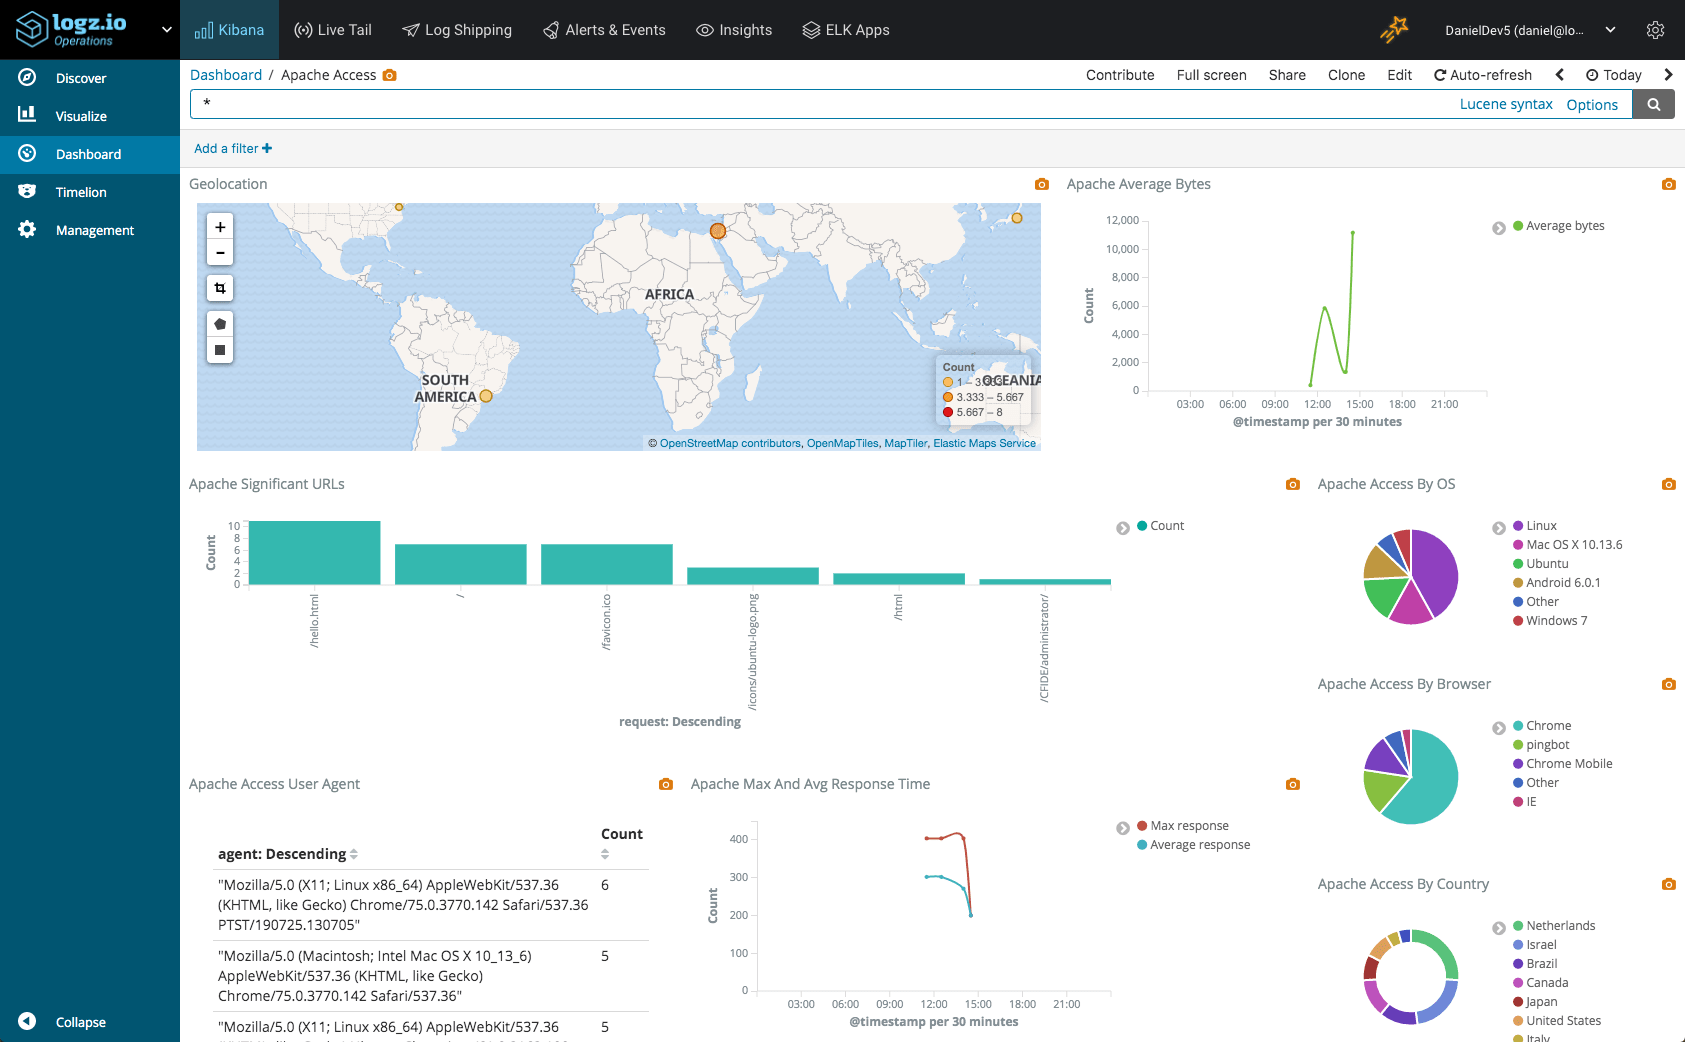
Logz.io users can install the dashboard above, and many other Apache visualizations and dashboards, using ELK Apps — a free library of pre-made dashboards for various log types, including Apache of course. If you don’t want to build your own dashboard from scratch, simply search for “apache” in ELK Apps and install whichever dashboard you fancy.
To stay on top of errors and other performance-related issues, a more proactive approach requires alerting, a functionality which is not available in vanilla ELK deployments. Logz.io provides a powerful alerting mechanism that will enable you to stay on top of live events, as they take place in real-time. Learn more about this here.