Load balancers play a key component in any cloud-based deployment. By distributing incoming traffic across backend servers or services, load balancers help improve responsiveness and increase the availability of your applications.
Monitoring load balancers is important for analyzing traffic patterns and troubleshooting performance and availability issues. In this article we’ll take a look at Application Gateway — Azure’s load balancer and how to monitor it using Logz.io’s Azure integration.
What is Azure Application Gateway?
To quote the official docs, “Azure Application Gateway is a web traffic load balancer that enables you to manage traffic to your web applications.” Application Gateway is deployed between the client and the applications and services deployed in the backend, and supports routing based on IPs/ports (layer 4 load balancing) and on the request content (layer 7 load balancing).
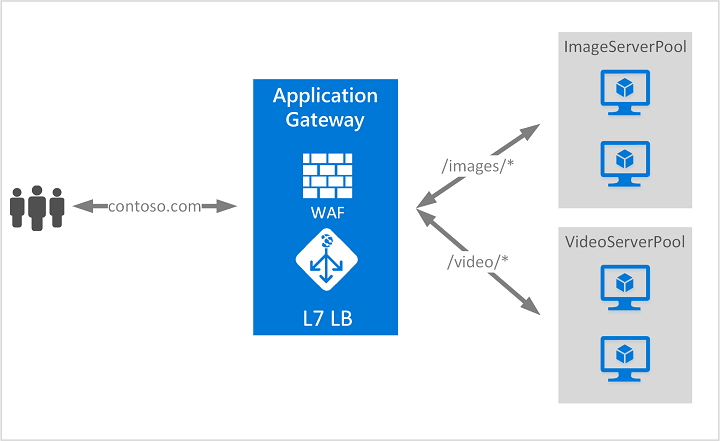
Source: Azure Docs
Azure’s Application Gateway also supports autoscaling, SSL termination, redirections and some additional features we’re used to seeing in cloud-based load balancing services.
Types of Application Gateway logs
To monitor and troubleshoot Azure’s Application Gateway, there are a number of log types made available for use. These logs need to be turned on, shipped to a storage endpoint (a storage account, an Event Hub or Azure Monitor Logs), and then extracted for analysis:
Access logs
Access logs contain important information on the traffic routed by Application Gateway, including the caller’s IP, requested URL, response latency, return code, and bytes in and out.
Performance logs
Performance logs help you monitor the performance of your Application Gateway instances, providing information on the total requests served, throughput in bytes, total requests served, failed request count, and healthy and unhealthy back-end instance count.
Activity logs
Activity logs will give you visibility into any action performed within your Azure subscription, including those related to Application Gateway. I recommend reading this article to learn how to collect and analyze these logs.
Collecting and shipping Azure Application Gateway Logs
Now that we understand what we’re monitoring, it’s time to establish a logging pipeline. As mentioned above, we’ll be using the Logz.io Azure integration that is based on Event Hub and Azure Functions. To read more about this integration, take a look at this article.
Deploying the integration template
The easiest way to setup the integration is to use the Deploy to Azure button displayed in the first step of the repo’s readme:

The Custom Deployment page opens up in the Azure portal:

Verify the following entries:
- Resource group: Select the same resource group in which Application Gateway is deployed.
- Location: Verify that the same region used for Application Gateway is entered.
- Logzio Logs Host: Enter the URL of the Logz.io listener. If you’re not sure what this URL is, check your login URL – if it’s app.logz.io, use listener.logz.io (this is the default setting). If it’s app-eu.logz.io, use listener-eu.logz.io.
- Logzio Metrics Host: Enter the URL of the Logz.io listener. If you’re not sure what this URL is, check your login URL – if it’s app.logz.io, use listener.logz.io (this is the default setting). If it’s app-eu.logz.io, use listener-eu.logz.io.
- Logzio Logs Token: Enter the token of the Logz.io account you want to ship Azure logs to. You can find this token on the account page in the Logz.io UI.
- Logzio Metrics Token: Enter a token for the Logz.io account you want to use for shipping Azure metrics to. You can use the same account used for Azure logs.
Agree to the terms at the bottom of the page, and click Purchase.
Azure will then deploy the template. This may take a while as there is a long list of resources to be deployed, but after a minute or two, you will see the Deployment succeeded message at the top of the portal.
Turning on Azure Application Gateway logs
Now that we have all the building blocks in place for streaming the data into Logz.io, our next step is to turn on the logs and make sure they are shipped into the event hub we just created as part of the integration with Logz.io.
In the Azure portal, open up your Application Gateway and click Diagnostic settings from the menu:

Click the Turn on diagnostics link. The Diagnostic settings page opens up and we now need to do two things. First, select the Stream to an event hub option and configure the event hub to ship logs to. Second, click the log types we want to collect and ship.

Save the settings.
Azure will apply the diagnostic settings and within a minute or two you will start to see Application Gateway logs in Logz.io.

Analyzing Azure Application Gateway Logs
As mentioned above, there is a wealth of information available in the different log types collected from an Application Gateway instance.
Before you begin analyzing the data, a good best practice is to try and understand exactly what you’re looking at, or in other words — the fields the logs contain. The docs contain a full description of each field and examples of the logs in JSON format, so that’s a good resource to use for this purpose.
Since all the logs are shipped into the system together, being able to easily search per log type can be helpful. For example, if I only want to look at access logs, I can use the operationName field to look only at access logs:

Save the search for future use.
Adding some fields by selecting them from the list of available fields on the left helps us get more visibility into the data. For example, in the example below I added the httpMethod, httpStatus and requestUri fields:

Using different types of queries, you can then search for specific events.
For example, say you want to look for traffic resulting in a 400 and above response:
operationName:"ApplicationGatewayAccess"  AND properties.httpStatus>=
400
Kibana supports rich querying options that will help you dive deeper into the rabbit hole. To learn about the different query types, read this post.
Visualizing Azure Application Gateway Logs
Of course, Kibana is well known for its visualization capabilities and once you’ve gained a better understanding of the data collected in Application Gateway logs, you can start building visualizations. Again, there is a wide variety of options to play around with and I’ll provide you with some examples here.
Total requests
Metric visualizations in Kibana are great for displaying single metrics on a key metric. In this example, we’re showing the total amount of requests handled by our Application Gateway instance:

Incoming vs. outgoing traffic
To monitor the sent vs. received amount of bytes, we can use a line chart visualization. We’ll use two average aggregations of the relevant fields as the Y axis and a date histogram as the X axis:

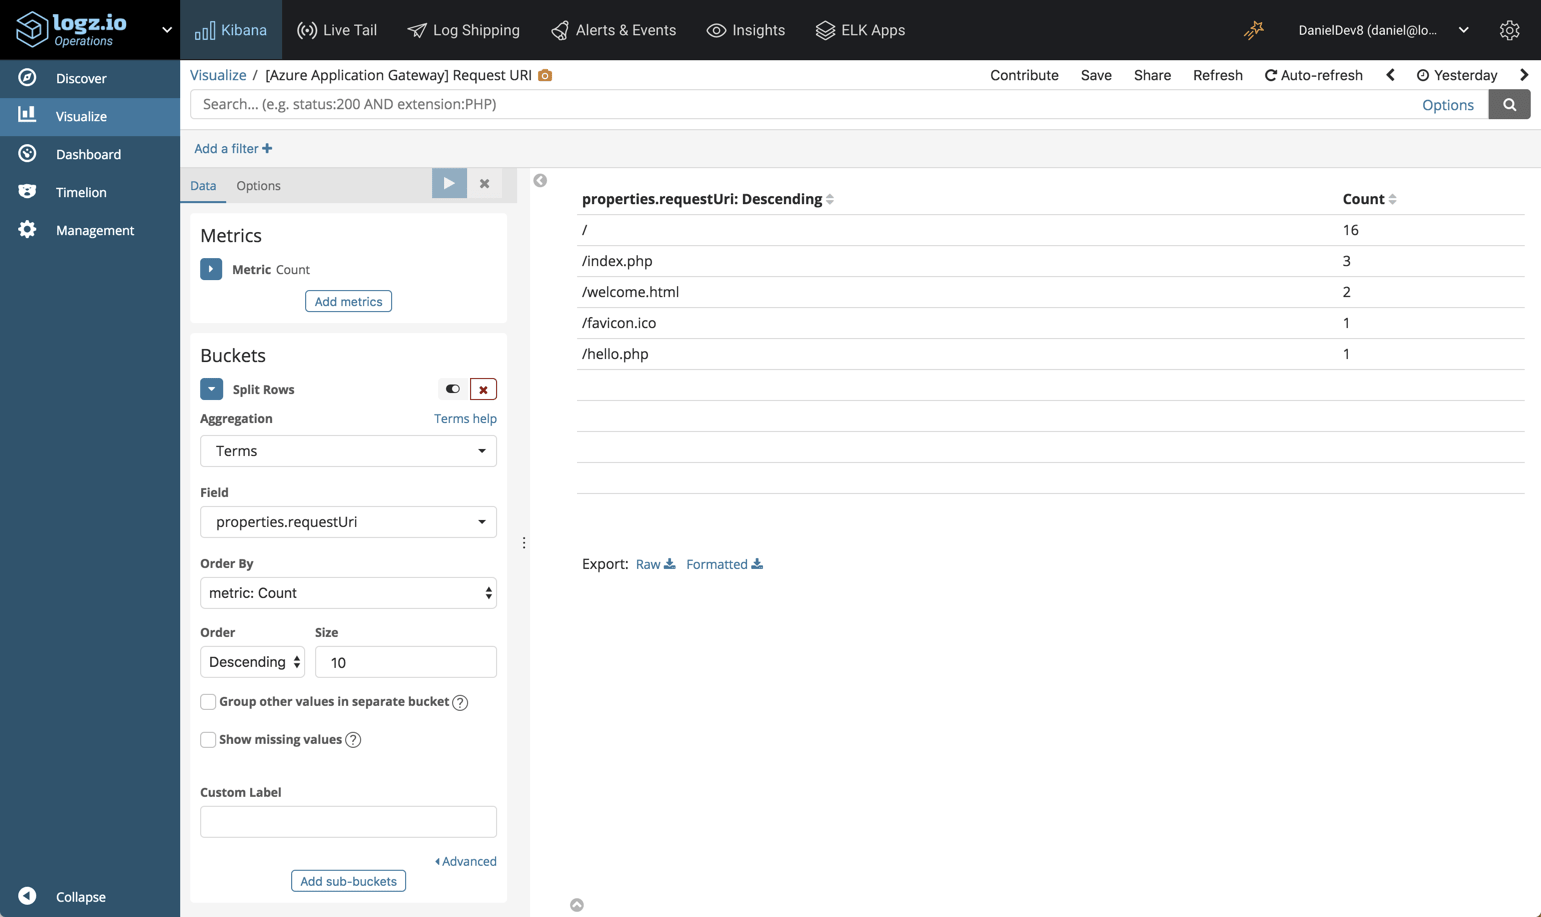
Top URIs
Using data tables is a great way to display the top requested URIs handled by Application Gateway:
Once you have all your visualizations ready, you can combine them into one comprehensive dashboard that gives you a nice overview of your Application Gateway instances:

Again, these are just examples. You can slice and dice the different logs and metrics collected from Azure using Kibana’s rich analysis capabilities. The dashboard here is available, if you like, in ELK Apps — Logz.io’s library of pre-made Kibana objects.
Endnotes
Azure Application Gateway logs contains a lot of valuable information on how load balancers are behaving and the traffic they are routing. You can monitor latencies, anomalies in traffic load, amount of failed requests and plenty more. The challenge is how to aggregate the data efficiently and analyze it effectively.
The integration with Logz.io is simple to implement and will provide you with the analysis tools to help you make sure traffic is being handled in an optimized manner and give you the tools to perform root cause analysis should an issue occur.